Candlestick patterns are visual tools that reveal price movement and market psychology, making them essential for futures traders. Originating in 18th-century Japan and introduced to the West in 1991, these patterns help traders identify potential reversals, momentum shifts, and indecision in high-leverage markets during day trading sessions like the E-mini S&P 500 or Nasdaq 100. Here’s what you need to know:
- Single Candlestick Patterns: Include the Hammer, Doji, and Yo-Son/In-Sen, useful for spotting reversals or indecision. Always confirm with additional signals like volume or support/resistance levels.
- Double Candlestick Patterns: Examples like Bullish/Bearish Engulfing and Inside Bars offer stronger reversal or continuation signals. Context, such as key structural levels, is critical.
- Triple Candlestick Patterns: Patterns like Morning/Evening Stars and Three White Soldiers/Black Crows provide robust confirmation of trend changes, especially on higher timeframes.
- Risk Management: Candlestick patterns help define stop-loss levels and manage risk, especially for traders in funded accounts with strict drawdown limits.
The Ultimate Candlestick Patterns Trading Course (For Beginners)
sbb-itb-46ae61d
Single Candlestick Patterns
Single candlestick patterns provide a snapshot of market sentiment through price movements, offering quick signals about potential market direction. A green (or white) candle indicates a session where the close was higher than the open, reflecting bullish sentiment. On the other hand, a red (or black) candle shows the opposite: bearish sentiment, where the close was lower than the open.
These patterns depend on the timeframe you’re analyzing. For example, a scalper trading E-mini S&P 500 futures might rely on 1-minute or 250-tick charts for rapid signals. Meanwhile, position traders often use 4-hour or daily charts to filter out short-term noise. Choosing the right timeframe is crucial – scalpers won’t find much value in weekly charts, just as swing traders might find 1-minute charts too chaotic.
"Each candlestick is a simple, yet powerful tool to understand what’s happening in the market" – Steve Nison
In highly leveraged futures markets, patterns like the Hammer and Doji are especially useful for spotting reversals or market indecision. However, these signals are not foolproof and require confirmation. For instance, a Hammer near a key support level means little unless the next candle confirms the reversal with bullish momentum or a volume surge. Ignoring this validation can be risky, particularly under the strict risk limits of futures prop firms.
Let’s dive into some key single candlestick patterns, starting with the Hammer.
Hammer
The Hammer is a bullish reversal pattern that shows up at the bottom of a downtrend. It’s identified by a small body near the top of the candle, with a lower shadow at least twice the body’s length. This shape tells a story: sellers initially drove prices down, but strong buying pressure reversed the session, closing near the open.
In futures trading, spotting a Hammer near critical levels like an EMA or a swing low is important, but confirmation is essential. A bullish follow-through candle or a spike in volume strengthens the signal. The Hanging Man, a similar pattern, appears during an uptrend and signals potential bearish reversals.
Doji
A Doji forms when the opening and closing prices are nearly identical, creating a candle that looks like a cross or plus sign. The term "Doji" comes from Japanese, meaning "the same thing", emphasizing the balance between buyers and sellers. This pattern reflects indecision in the market – neither side has gained control.
"A doji indicates that the latest movement of the chart has ended and the pattern is now neutral." – RJO Futures
In futures markets, where leverage amplifies every move, a Doji often signals fading momentum. For example, if you’re holding a Nasdaq 100 futures position and a Doji forms near your profit target after a strong rally, it might be a good time to tighten your stop-loss. Variations like the Dragonfly, Gravestone, and Long-legged Doji exist, but candles with a clear rejection of price levels, such as Pin Bars, often provide stronger signals. To improve reliability, Dojis are best used alongside other technical indicators rather than as standalone signals.
Yo-Son and In-Sen
Building on patterns like the Hammer and Doji, Yo-Son and In-Sen candles offer additional insights into market trends. A Yo-Son candle (bullish) forms when the close is higher than the open, typically represented as a green or white candle, signaling buyer dominance. An In-Sen candle (bearish) forms when the close is lower than the open, shown as red or black, reflecting selling pressure.
A series of strong Yo-Son candles, with long bodies and minimal shadows, often signals robust bullish momentum, potentially triggering traders’ "fear of missing out." Conversely, multiple In-Sen candles with solid bodies can indicate aggressive selling. Paying attention to the size and consistency of these candles is key. For example, a large Yo-Son candle breaking above resistance on high volume after a period of consolidation could mark the start of a new uptrend. Observing these patterns can help traders understand the underlying psychology driving price action in markets like crude oil or gold futures.
Double Candlestick Patterns
Double candlestick patterns build upon the insights gained from single candlestick formations, offering traders a more reliable way to confirm shifts in market sentiment. By analyzing the interaction between two consecutive candles, traders can better understand whether the market is gaining momentum, consolidating, or reversing direction.
These patterns are especially useful in leveraged futures markets like the E-mini S&P 500 (ES) or Nasdaq 100 (NQ), where even small moves can have a significant impact. For instance, a bullish engulfing pattern forming at a key support level doesn’t just imply interest from buyers – it shows that buyers have decisively overpowered sellers, wiping out prior selling pressure.
The relationship between the two candles is critical. Does the second candle engulf the first entirely? Does it stay within the range of the first candle? Or does it gap open and close deep into the previous candle’s body? Each scenario offers clues about the market’s next steps.
Bullish and Bearish Engulfing
Bullish and bearish engulfing patterns are among the strongest signals for potential reversals in candlestick analysis. Their structure is simple: the second candle’s real body completely engulfs the real body of the first.
- Bullish Engulfing: A small bearish (red) candle is followed by a larger bullish (green) candle that opens below the prior close and closes above the prior open.
- Bearish Engulfing: A small bullish (green) candle is followed by a larger bearish (red) candle that completely swallows it.
These patterns reflect a total shift in control. For example, in crude oil futures (CL), a bullish engulfing pattern appearing after a downtrend indicates that buyers have stepped in with enough force to overcome the prior selling pressure. To spot these patterns in real-time, focus on key structural levels like support and resistance zones, major moving averages (e.g., the 200-period EMA), or trendlines. A spike in volume during the engulfing candle further validates the move.
For ES futures, a common strategy involves entering one tick above the engulfing candle’s high and placing a stop one tick below its low.
Inside Bar
The inside bar pattern represents market consolidation, where the candle’s range fits entirely within the range of the previous candle. This pattern signals a pause as the market gathers strength for its next move.
"The inside bar pattern shows a pause or indecision in the market, and depending on the surrounding price context it formed within, this provides us with an extremely valuable clue about what a market is about to do next." – Nial Fuller, Professional Trader
In trending markets, inside bars often act as continuation signals. The market takes a breather, volatility contracts, and then the trend resumes. However, when inside bars form at major support or resistance levels, they may also hint at a potential reversal.
A six-month study of SPY (S&P 500 ETF) found that inside days occurred only 22% of the time, but when they did, the price broke out of the previous day’s range 77.78% of the time. These breakouts were slightly more likely to be bullish, with a 52% chance of an upside move. Notably, when the price broke above the prior day’s high, the session closed green 74% of the time, while a break below the low led to a red close 80% of the time.
For intraday futures trading, a 30-minute strategy can be effective. Identify an inside bar setup at the open, let the first 30 minutes establish a range, and then enter long on a break of the 30-minute high or short on a break of the low. Stops are placed just below the low for longs (or above the high for shorts), with the previous day’s high or low as initial profit targets.
Dark Cloud Cover
Dark cloud cover is a bearish reversal pattern that typically forms at the peak of an uptrend. It starts with a bullish candle, followed by a bearish candle that gaps up but then closes below the midpoint of the first candle. This pattern tells a clear story: the session begins with optimism, but sellers take control and erase more than half of the prior gains.
Unlike a full bearish engulfing pattern, dark cloud cover only requires the second candle to close below the midpoint of the first, making it a less aggressive signal. When this pattern appears near resistance levels – such as in gold futures (GC) – it often signals that the uptrend is losing steam.
The depth of the bearish candle’s penetration is key. A close just below the midpoint is less convincing than one that drives deep into the first candle’s body. Short shadows on both candles suggest decisive selling with minimal hesitation.
As with any candlestick pattern, confirmation is essential. A third bearish candle or supporting indicators like RSI or MACD can help validate the signal. Combining dark cloud cover with resistance levels increases the likelihood of a successful trade. This pattern, like other double candlestick formations, is a valuable tool for navigating the complexities of high-leverage futures markets.
Triple Candlestick Patterns
Triple candlestick patterns reflect a complete cycle of market sentiment, offering confirmation of reversals. These patterns rely on three consecutive sessions of price action, making them more reliable than single or double candlestick formations. They build on the foundation of double candlestick setups, providing traders with stronger validation in their strategies.
While a single candle might indicate a spike and two candles suggest a potential shift, three candles confirm a trend change. For fast-moving assets like the E-mini S&P 500 (ES) or crude oil (CL), waiting for this confirmation can help traders avoid false signals and focus on genuine trend reversals.
"A ‘Confirmation Entry’ waits for the market to prove the zone is holding. By waiting for the 3-Candle Confirmation, you may sacrifice a few pips of entry price… but you gain massive advantages: Higher Win Rate and Mental Clarity." – Trading Strategy Guides
These patterns are especially effective when they occur at major support or resistance levels or within defined zones like Order Blocks. For example, a Morning Star forming near a key support level on a daily chart has greater significance than one appearing in isolation. Additionally, increased trading volume on the third candle often signals institutional activity. As with other candlestick patterns, confirming signals near significant levels enhances their reliability, particularly during prop firm challenges.
Morning Star and Evening Star
The Morning Star is a bullish reversal pattern composed of three candles. It begins with a long bearish candle following a downtrend. The second candle, often a Doji or spinning top, has a small body and gaps down, signaling indecision. The third candle is a strong bullish bar that closes well into the body of the first candle, confirming buyers have taken control.
The Evening Star, its bearish counterpart, signals a reversal after an uptrend. It starts with a long bullish candle, followed by a small, indecisive candle that gaps up, and concludes with a strong bearish candle that closes deep into the first candle’s body.
These patterns are most effective on higher timeframes, where they indicate significant shifts in sentiment. For instance, in gold futures (GC), a Morning Star at a major support level on the daily chart is more reliable than one forming in isolation. Before acting on these patterns, check longer-term charts to ensure there are no nearby resistance (for bullish setups) or support (for bearish setups) levels that could limit the move.
It’s wise to avoid relying solely on these patterns during high-impact news events, such as Non-Farm Payrolls (NFP) or Consumer Price Index (CPI) releases, as extreme volatility can disrupt technical formations.
Three White Soldiers and Three Black Crows
The Three White Soldiers pattern signals strong bullish momentum, whether as a reversal or continuation. It consists of three consecutive long bullish candles. Each candle opens within the body of the previous one and closes near its high, reflecting consistent buying pressure.
On the other hand, the Three Black Crows pattern represents a bearish trend. It features three consecutive long bearish candles, each opening within the body of the prior candle and closing near its low, indicating sustained selling pressure.
In Nasdaq 100 futures (NQ), Three White Soldiers appearing after a pullback to the 200-period moving average on a 1-hour chart may suggest the continuation of a broader uptrend. However, each candle should show steady progress without long upper or lower wicks, which could indicate hesitation.
Volume is crucial in validating these patterns. A spike in volume across all three candles often confirms institutional participation. Conversely, declining volume during the pattern’s formation may weaken its reliability.
Three Inside Up and Three Inside Down
The Three Inside Up pattern is a bullish reversal sequence. It starts with a long bearish candle, followed by a smaller bullish candle that forms an inside bar, and concludes with a third bullish candle that closes above the high of the first candle. This progression indicates a shift from selling pressure to buying momentum.
The Three Inside Down pattern works in the opposite direction. It begins with a long bullish candle, followed by a smaller bearish inside bar, and ends with a third bearish candle that closes below the first candle’s low.
These patterns are particularly helpful for refining entry and exit strategies. For example, in crude oil futures (CL), a Three Inside Up pattern forming near $70 per barrel at a support level offers a clear entry point above the third candle’s high and a logical stop-loss below the pattern’s low.
To maximize effectiveness, identify key zones on higher timeframes and confirm the pattern on lower timeframes. For instance, spotting a Three Inside Up on a 15-minute chart after validating the zone on a daily chart ensures alignment with the broader market structure while allowing for precise timing.
"Confirmations such as increased trading volume can further enhance confidence in the reversal signal." – Brett Simba, Tradeify
If a pattern appears unclear on your current timeframe, switch to a higher one for a clearer perspective. A formation that seems ambiguous on a 5-minute chart may become crystal clear on a 15-minute chart. This approach, combined with volume confirmation, aligns well with risk management practices, helping traders maintain precision in high-leverage scenarios.
Applying Candlestick Patterns in Futures Trading
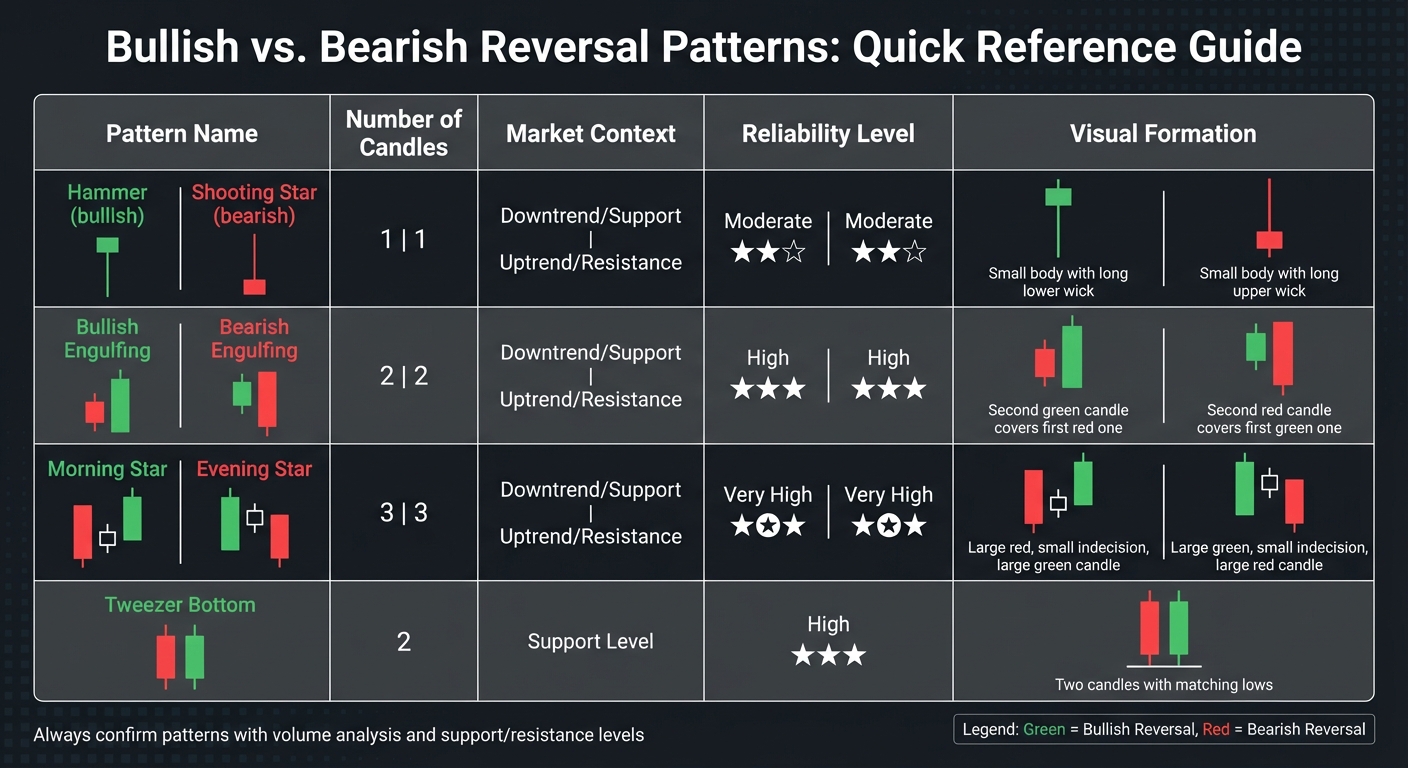
Candlestick Pattern Comparison Chart: Bullish vs Bearish Reversal Patterns for Futures Trading
Candlestick patterns can be incredibly effective tools in futures trading, but their success often depends on context and disciplined risk management. For instance, a Hammer pattern might not mean much if it appears in the middle of a trading range. However, if the same pattern forms at a major support level and is accompanied by high trading volume, it could signal a strong trading opportunity.
Combining Patterns with Support and Resistance
The most reliable candlestick patterns tend to form near key technical levels, such as support or resistance zones, important moving averages like the 200-period EMA, or established trendlines. Patterns that appear randomly within a range often lack reliability compared to those at significant levels.
Take the example of an E-mini S&P 500 (ES) trade from January 2026. In this case, during a downtrend, the price retraced to a major daily support level. A bearish candle was followed by a bullish engulfing candle that opened lower, closed higher, and showed heavy volume. This combination provided a clear entry signal with well-defined stop-loss levels.
To execute trades, consider entering one tick beyond the signal candle’s extreme and setting stop-losses just below the low for long trades or just above the high for short trades. This approach ensures risk is clearly defined.
Using multiple timeframes can also improve your strategy. Signals that might seem unclear on a 5-minute chart often become more apparent on longer timeframes, like a 15-minute or hourly chart. Additionally, volume plays a crucial role. High trading volume on a reversal candle often indicates institutional activity, which helps confirm the move. For example, in gold futures (GC), a Three White Soldiers pattern accompanied by volume spikes across all three candles can confirm strong bullish momentum.
When setting profit targets, aim for key resistance levels or previous swing highs. Trailing stops based on the highs or lows of recent candles can help lock in profits as the trend develops. This structured approach naturally supports disciplined risk management, especially in high-pressure trading environments.
Risk Management in Prop Firm Challenges
For traders working with funded accounts from firms like Apex Trader Funding, Tradeify, or FundedNext Futures, strict risk management is non-negotiable. Candlestick patterns can help define clear stop-loss levels, which are critical for staying within the drawdown limits these firms impose.
"Discipline beats impulse every time." – FundedNext
Before entering a trade based on a candlestick pattern, ensure your position size aligns with the firm’s risk-per-trade limits. Use tools like a futures trading profit calculator, wait for confirmation candles to close, and focus on timeframes of 15 minutes or longer to reduce market noise. For example, a Shooting Star at resistance can signal a good time to scale out of a position, while a Doji near a profit target might suggest tightening your trailing stop as the market shows indecision.
Comparison Table: Bullish vs. Bearish Reversal Patterns
| Pattern | Number of Candles | Market Context | Reliability | Formation Detail |
|---|---|---|---|---|
| Hammer | 1 | Downtrend / Support | Moderate | Small body with long lower wick |
| Shooting Star | 1 | Uptrend / Resistance | Moderate | Small body with long upper wick |
| Bullish Engulfing | 2 | Downtrend / Support | High | Second green candle covers first red one |
| Bearish Engulfing | 2 | Uptrend / Resistance | High | Second red candle covers first green one |
| Morning Star | 3 | Downtrend / Support | Very High | Large red, small indecision, large green candle |
| Evening Star | 3 | Uptrend / Resistance | Very High | Large green, small indecision, large red candle |
| Tweezer Bottom | 2 | Support Level | High | Two candles with matching lows |
Incorporating additional technical indicators can strengthen these signals. For instance, an RSI reading below 30 often aligns with bullish reversal patterns, while readings above 70 support bearish setups. Similarly, MACD crossovers can provide extra confirmation when they coincide with multi-candle reversal patterns like the Morning or Evening Star.
Conclusion
Candlestick patterns offer a glimpse into market psychology, reflecting the ongoing tug-of-war between buyers and sellers. However, their effectiveness depends heavily on context. For instance, a Hammer pattern forming at a critical support level with high trading volume carries much more weight than one appearing in a neutral zone.
Skilled futures traders don’t rely on candlestick patterns alone. They combine these signals with structural levels, volume analysis, and momentum indicators like RSI or MACD. This layered approach helps filter out false signals. For example, bullish patterns often perform better in uptrends during pullbacks, while bearish patterns tend to work well in downtrends during temporary rallies.
Turning these insights into actionable strategies requires disciplined risk management. For traders using funded accounts from firms like Take Profit Trader or Topstep, candlestick patterns can naturally define stop-loss levels. A common strategy is to place stop-losses just beyond the wick of the signal candle and adjust position sizes to align with strict risk rules, such as daily loss limits or trailing drawdowns. Using higher timeframes – hourly or longer – can also help cut through market noise and provide clearer signals.
If you’re looking to refine your trading or scale up with a funded account, DamnPropFirms is a resource worth exploring. They offer side-by-side comparisons of top proprietary trading firms, educational tools for passing evaluations, and features like the Consistency Rule Calculator to help you stay within firm-specific risk parameters. You can also find verified reviews and discount codes for firms like Alpha Futures and Purdia, making it easier to choose a firm that fits your trading approach.
FAQs
Which candlestick patterns work best for futures?
Candlestick patterns can be incredibly useful for futures trading, particularly reversal patterns like the hammer, engulfing, and morning/evening star. These patterns often indicate potential shifts in market direction, making them valuable for identifying ideal entry or exit points.
To enhance the reliability of these signals, traders frequently pair them with volume profile setups, such as edge rejections or POC (Point of Control) mean reversion. Since futures markets are deeply influenced by price action and volume analysis, this combination can provide a more accurate picture of market movements.
How do I confirm a candlestick signal before entering?
To confirm a candlestick signal, it’s essential to examine other market data or patterns. For example, check if the candlestick closes in a way that supports the signal – like a bullish engulfing pattern closing above the previous high. Many traders rely on additional tools such as technical indicators, price action, or volume analysis to strengthen their confidence in the signal. For even greater precision, consider waiting for confirmation on higher timeframes. This approach can help reduce the risk of false signals.
Where should I place stops and targets using candles?
Stops are often positioned close to significant support or resistance levels, which are indicated by candlestick shadows or wicks. For bullish setups, it’s a good idea to place stops just below the pattern’s low. On the other hand, for bearish setups, stops should go slightly above the pattern’s high.
When it comes to setting targets, aim for previous swing highs or lows, or the next support or resistance zone as identified by candlestick patterns. This strategy helps maintain a balance between managing risks and maximizing potential profits.