Tick value calculators are a lifesaver for futures traders. They take the guesswork out of calculating profit and loss (P&L) by automating the math. For contracts like ES (E-mini S&P 500) or NQ (E-mini Nasdaq), these tools use a simple formula: (Exit Price – Entry Price) / Tick Size × Tick Value × Contracts. You just plug in your numbers, and boom – your P&L is done.
If you trade futures, you need to know tick values. ES moves $12.50 per tick per contract, while NQ ticks at $5.00. That difference impacts how fast you hit your loss limits or profit targets. Tools like these also help you size positions based on risk, not just margin, which is where a lot of new traders screw up. Whether you’re trading with futures prop firms or your own account, these calculators can keep you from blowing up by staying within drawdown rules.
Let’s break down how they work for ES, NQ, and multi-contract setups.
Futures Contract Tick Values and Specifications Comparison Chart
1. ES Tick Value Calculator
Accuracy
ES tick value calculators rely on the standard futures formula to determine profit and loss[1]. For the E-mini S&P 500 (ES), the tick size is 0.25, with each tick worth $12.50. A 20-point move equals 80 ticks, or $1,000 per contract[3].
Most calculators only display gross profit, so you’ll need to account for broker commissions and exchange fees yourself. As Pineify explains:
This tool calculates Gross Profit/Loss based on price movement. You should subtract your broker’s commission and exchange fees from the result to find your Net P/L
[1]. If you’re trading with firms like Apex Trader Funding or Topstep, these fees can stack up quickly. Make sure to deduct them manually for a clear picture of your net profit.
These calculations are essential for understanding the contracts supported by the calculator.
Supported Contracts
ES calculators handle both the standard and Micro E-mini S&P 500 (MES) contracts. The MES offers 1/10th the tick value of the ES – $1.25 per tick instead of $12.50[2][3] – making it a better fit for smaller accounts or for traders evaluating prop firms where tighter risk control is critical. Despite this, the ES remains the go-to contract for most futures traders.
User Interface
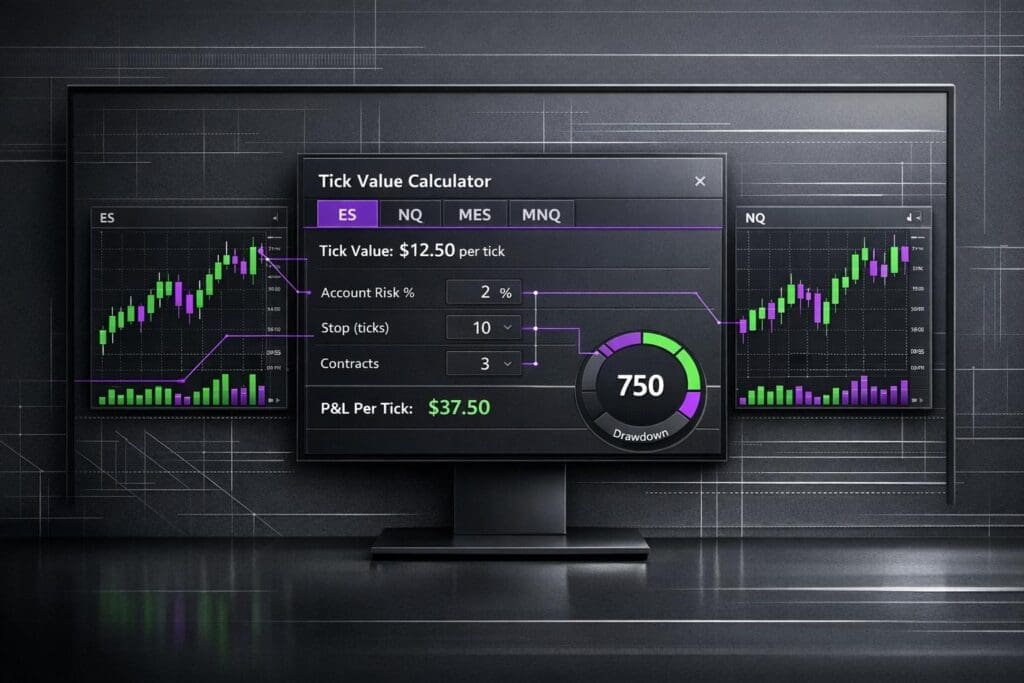
The best ES calculators keep things simple. You input your entry price, exit price, and the number of contracts, and they instantly show your profit or loss[1]. More advanced calculators go a step further by integrating ATR (Average True Range), which helps you set dynamic stop losses and profit targets based on market volatility[2]. This is particularly helpful during active trading hours, like the New York session (9:30 AM–4:00 PM ET), when ES volume is high and spreads are tight[2].
This intuitive design paves the way for deeper customization to suit individual trading needs.
Customization Options
Modern ES calculators now include advanced features for fine-tuned risk management. Many offer presets tailored to specific trading styles, including "Prop Presets" that reflect the drawdown limits and contract caps of firms like FundedNext Futures and Take Profit Trader[2]. You can also input your account size and preferred risk percentage (e.g., risking 1% of your account) to calculate the optimal number of contracts automatically. This shifts the focus from chasing profits to managing risk effectively.
sbb-itb-46ae61d
2. NQ Tick Value Calculator
Accuracy
NQ tick value calculators rely on standard futures formulas, just like ES calculators, but they’re specifically designed for NQ contracts. For the E-mini Nasdaq-100 (NQ), the tick size is 0.25, with each tick worth $5.00. So, a 10-point move on one NQ contract results in a $200 profit or loss. It’s a simple calculation, but always double-check that the calculator’s tick size and tick value match what your broker uses before placing trades[1].
Supported Contracts
These calculators usually cover both the E-mini Nasdaq (NQ) and the Micro Nasdaq (MNQ). The MNQ is perfect for smaller accounts, as its tick value is just $0.50 per tick, a tenth of the NQ’s $5.00[2]. For traders managing multiple contracts, the calculators often let you compare NQ setups with other instruments like ES, CL, or GC. Some of the more advanced tools even support over 15 contracts across six different categories, giving you flexibility to weigh your options[2].
User Interface
NQ calculators keep things simple but effective. Just like ES calculators, they’re designed with a clean layout and helpful visuals for comparing instruments. You plug in your entry price, exit price, and number of contracts, and the tool instantly calculates your P&L. Some of the more advanced versions step it up with features like P&L curves and performance metrics (think Kelly Criterion and Sharpe Ratio)[2]. Many tools also include dropdown menus, so you can quickly switch between NQ and other instruments like ES or CL without juggling multiple tabs. The goal here is efficiency, and these calculators deliver a smooth, user-friendly experience.
Customization Options
For a volatile instrument like NQ, being able to tweak risk settings is non-negotiable. Modern calculators shine here, offering features tailored to NQ’s price swings. For instance, many tools include ATR-based settings for dynamic stop-loss placement – using an ATR multiplier (like ATR x2) to adjust for NQ’s volatility[2]. This lets you size positions based on how much drawdown you can handle instead of just focusing on margin requirements. It’s a practical approach that helps traders manage risk in a way that aligns with NQ’s unpredictable nature. These features make it easier to adapt to the market and protect your account from wild price moves.
3. Multi-Contract Tick Value Calculator
Accuracy
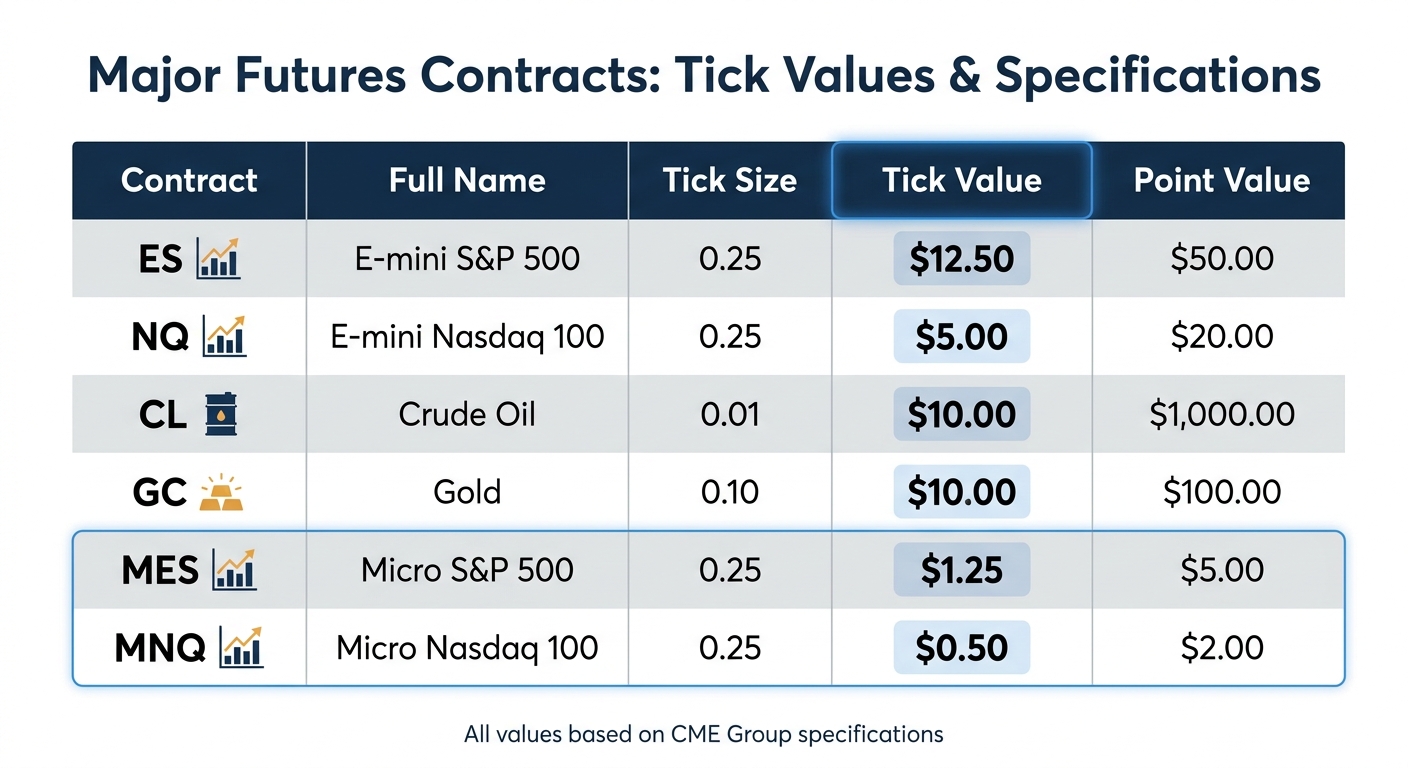
Multi-contract calculators rely on standard CME Group formulas to deliver precise calculations for supported contracts. For instance, the tick value for the E-mini S&P 500 (ES) is $12.50, for the E-mini Nasdaq 100 (NQ) it’s $5.00, and for Crude Oil (CL) it’s $10.00 per tick[1][2]. These tools show gross profit or loss, but remember to deduct broker commissions and exchange fees to get your net results[1]. Advanced versions often include real-time margin requirements and prop firm-specific rules, helping you stay within your account’s risk limits[2]. This setup extends the logic of ES and NQ calculators to cover a wider range of instruments.
Supported Contracts
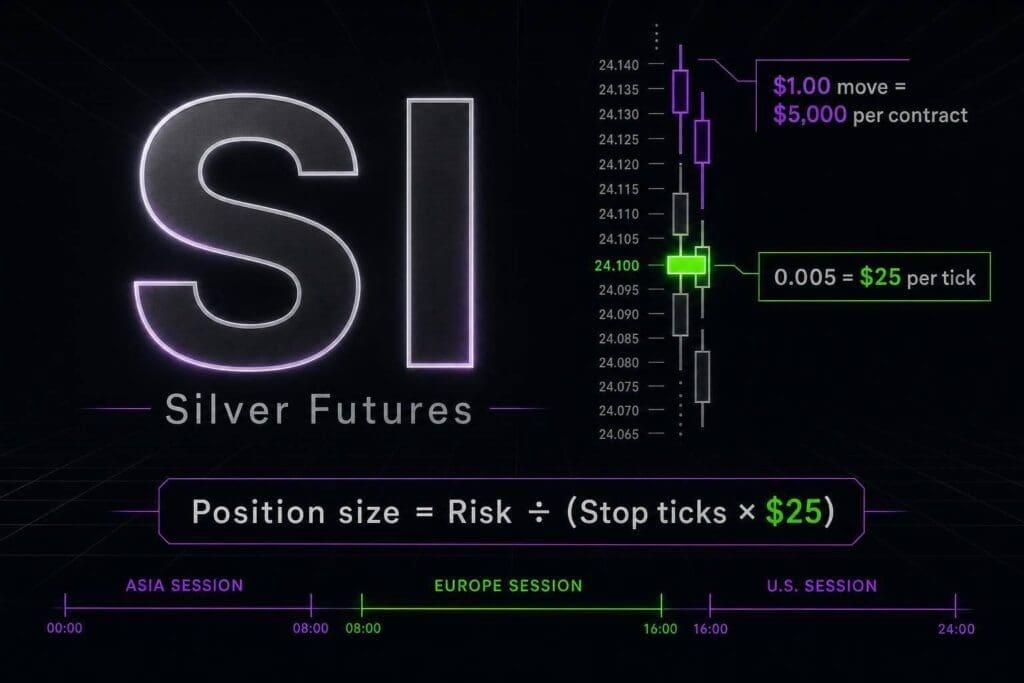
Unlike single-contract tools, multi-contract calculators bring everything together in one place for a variety of futures instruments. Most cover key CME Group products across six main categories: Equity Indices, Energy, Metals, Currencies, Interest Rates, and Agriculture[2]. You’ll typically see popular contracts like ES, NQ, YM, CL, GC, SI, and their micro counterparts (MES, MNQ, MCL, MGC). Here’s a quick breakdown of some common contracts:
| Contract | Tick Size | Tick Value | Point Value |
|---|---|---|---|
| ES (E-mini S&P 500) | 0.25 | $12.50 | $50.00 |
| NQ (E-mini Nasdaq 100) | 0.25 | $5.00 | $20.00 |
| CL (Crude Oil) | 0.01 | $10.00 | $1,000.00 |
| GC (Gold) | 0.10 | $10.00 | $100.00 |
| MES (Micro S&P 500) | 0.25 | $1.25 | $5.00 |
| MNQ (Micro Nasdaq 100) | 0.25 | $0.50 | $2.00 |
Some calculators may limit the contracts available based on specific prop firm rules[2]. If you’re trading with firms like Apex Trader Funding or Topstep, make sure your tool filters contracts allowed by your firm.
User Interface
These calculators are designed to be user-friendly and efficient. Features like dropdown menus, real-time profit/loss curves, and performance metrics (such as Kelly Criterion and Sharpe Ratio) make navigation smooth[2]. Many tools also include a "Micro" toggle, letting you quickly compare the risk of full-size contracts versus micros. For example, you can see the difference between trading one NQ contract or several MNQ contracts without switching tabs or doing manual math.
Customization Options
Customization features let you fine-tune setups across multiple contracts. You can usually input account balances from $10,000 to $300,000 and set risk tolerance as a percentage of your balance, typically between 0.5% and 2%[2]. Presets often include prop firm-specific risk parameters, like those for Apex Trader Funding, Topstep, or FundedNext Futures, automatically factoring in drawdown limits, daily loss caps, and contract maximums[2]. You can also use ATR (Average True Range) settings to create adaptive stop losses, such as ATR x2, that adjust to volatility.
Don’t base your position sizing solely on available margin. Instead, use a risk calculator to account for your drawdown buffer. This is crucial for proper risk management[2]. Position sizing done right can make all the difference.
How to Calculate Profit or Loss on Futures Contracts
Pros and Cons
Let’s break down the strengths and weaknesses of basic, advanced, and multi-contract calculators, along with institutional platforms, to see how they stack up for traders.
Basic calculators are perfect for quick profit and loss estimates. They’re straightforward, fast, and get the job done when you’re only looking for gross P&L numbers[1]. But that simplicity comes at a cost – they don’t account for risk metrics or more complex trading rules.
Advanced calculators take things up a notch. They include tools for risk management and even integrate rules from prop firms like Apex Trader Funding and Topstep. You’ll find features like the Kelly Criterion and ATR-based stops here[2]. The downside? The interface is packed with data, which can be overwhelming if you’re just starting out.
Multi-contract calculators shine when you’re trading across multiple instruments. They support up to 17 major contracts, including ES, NQ, CL, and GC. However, some tools limit their contract options based on prop firm-specific rules. If you’re trading with firms like FundedNext Futures or Tradeify, double-check that the calculator covers your contracts.
Institutional platforms go even further, offering real-time tick value calculations and advanced order flow tools. But they come with a steep learning curve and often require a subscription fee.
One of the biggest challenges for beginners is understanding the difference between margin and drawdown. Many confuse available margin with having enough drawdown room[2]. Advanced calculators help by focusing on position sizing based on your drawdown buffer, not just margin. This feature can save your funded account from getting wiped out.
Here’s a quick comparison of features across different calculator types:
| Feature | Basic Calculators | Advanced Calculators | Multi-Contract Tools | Institutional Platforms |
|---|---|---|---|---|
| Accuracy | High (CME Specs) | High (CME Specs) | High (CME Specs) | Real-time Broker Data |
| Supported Contracts | Major Indices/Commodities | 15+ Contracts | 17+ Major Contracts | All Broker-Supported |
| User Interface | Simple & Minimalist | Data-Dense/Professional | Modern & Functional | Complex/Institutional |
| Customization | Basic Entry/Exit | High (ATR, Kelly %, Risk %) | Quick R:R Presets | Full (C# Scripting, Layouts) |
| Ideal For | Quick P&L Estimates | Advanced Risk Analysis | Prop Firm Evaluations | Professional Order Flow Trading |
If you’re confident with basic tools, it’s worth stepping up to an advanced calculator. Features like drawdown management and prop firm rule integration can keep you compliant and avoid blowing your evaluation. This is especially useful for traders working with Apex Trader Funding, Take Profit Trader, or Alpha Futures. The right tool can be a game-changer for your trading.
Conclusion
Picking the right tick value calculator comes down to your trading approach and experience level. If you’re just getting started or need quick profit-and-loss estimates, Pineify keeps it simple with a five-step process: choose your contract, check its specs, input your prices, set the position size, and get your results [1].
For prop firm traders working with firms like Apex Trader Funding or Topstep, TickPilot and DealPropFirm stand out. They include presets tailored to help you stay within daily drawdown limits [4][2]. TickPilot even auto-fills the latest settlement price, saving you the hassle of manual input [4].
One critical point: position sizing should be based on your drawdown buffer, not just available margin. DealPropFirm stresses this, which is crucial for traders with firms like FundedNext Futures or Alpha Futures, where blowing past the drawdown limit can cost you your account [2].
For advanced traders, adapting to market volatility is key. DealPropFirm incorporates ATR (Average True Range) into stop-loss placement, which is especially useful in volatile markets like NQ, with a 14-day ATR of about $263.87 compared to ES’s $53.89 [5]. This lets you adjust position sizes dynamically instead of sticking to static stop levels.
All three tools – TickPilot, Pineify, and DealPropFirm – are free and use CME specs for accuracy [1][4][2]. Most calculators show gross P&L, so don’t forget to account for broker commissions and exchange fees when figuring out your net numbers. These tools simplify tick value calculations and help protect your funded account by translating tricky metrics into actionable insights.
FAQs
How do I calculate net P&L after fees?
To figure out your net P&L after fees, start by calculating your gross profit or loss. Multiply the number of contracts you traded by the points gained or lost and the tick value. Once you have that number, subtract all the trading fees – this includes commissions and transaction costs.
If you’re looking for a quick way to estimate, tools like tick value calculators can be handy. They’ll help you get your gross P&L, which you can then adjust by factoring in the fees to see your actual net result.
Should I size futures trades by margin or drawdown?
When you’re trading futures like the ES, it’s smarter to base your trade size on your drawdown tolerance instead of just the margin requirement. Sure, the margin might be low – like $500 for a single ES contract – but that doesn’t reflect your real risk. Your actual exposure depends on how much drawdown you can handle. Sizing trades with drawdown in mind keeps your risk in check, helps you ride out market swings, and ensures you stick to trading rules, especially the ones set by prop firms.
When should I trade micro contracts instead of minis?
Micro contracts work great if you’re looking for tighter risk control, need less capital to trade, or want to test out a new strategy. Their smaller tick sizes and values – like $0.50 per tick for MNQ compared to $12.50 for NQ – give you more control over your risk and position sizing. They’re perfect for traders with smaller accounts, beginners learning the ropes, or anyone fine-tuning their approach. Micro contracts keep potential losses smaller and give you more flexibility than trading minis.