Trading low-volume futures markets requires a different approach. In thin liquidity conditions, even small trades can cause large price moves, making tools like Footprint Charts, Cumulative Volume Delta (CVD), and Depth of Market (DOM) essential. These tools help you analyze real-time buyer and seller activity, spot institutional moves, and manage risks effectively.
Key takeaways:
- Low Liquidity = Higher Volatility: Thin markets (e.g., Asian trading hours) amplify price sensitivity.
- Order Flow Tools Are Critical: Use Footprint Charts for bid/ask volume, CVD for buyer/seller trends, and DOM for live liquidity tracking.
- Risk Management Is Non-Negotiable: Adjust position sizing, monitor slippage, and use tighter drawdown rules during volatile periods.
- Strategies That Work: Look for absorption patterns, track delta divergences, and use volume clusters for key price levels.
These methods help traders navigate erratic price moves and improve decision-making in low-volume sessions.
Trading Thin Volume In The Order Flow Made Easy With Orderflows Trader For NT8
sbb-itb-46ae61d
Challenges in Low-Volume Futures Markets
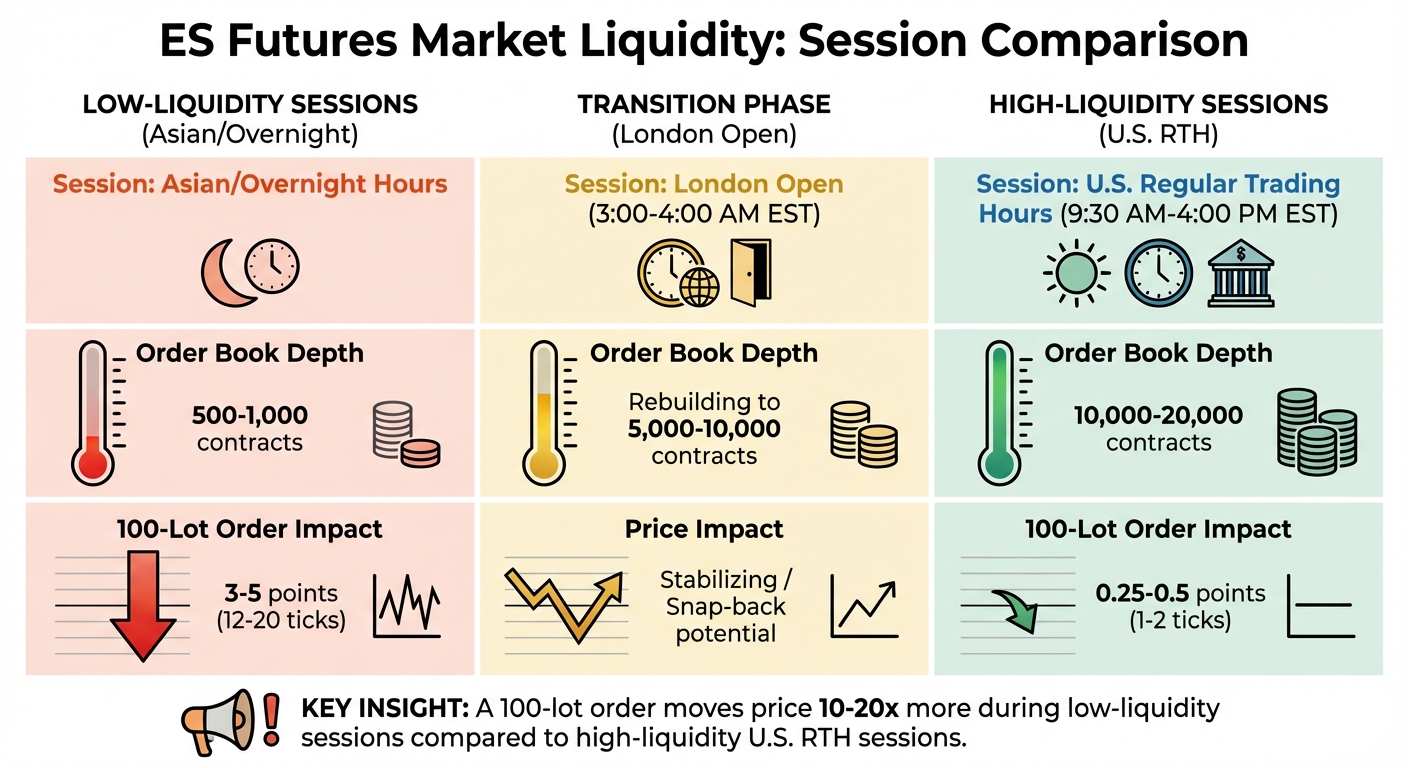
ES Futures Liquidity Comparison: Low-Volume vs High-Volume Trading Sessions
Trading during low-liquidity periods feels like stepping into an entirely different market compared to the high-paced action of regular U.S. trading hours. For instance, during peak times, the E-mini S&P 500 (ES) might boast an order book packed with 10,000 to 20,000 contracts. But shift to the Asian session or overnight periods, and that same depth can shrink drastically to just 500 to 1,000 contracts [4]. With fewer players in the market, price movements become highly reactive, often swinging sharply.
This lack of liquidity leads to exaggerated price sensitivity that’s driven more by an empty order book than by meaningful news or institutional trades. Bid-ask spreads widen, making trades more costly, and slippage becomes a frequent issue [4].
The market dynamics also change significantly. Institutional traders and market makers tend to retreat during these hours, leaving retail traders and algorithms to take the reins. This creates an environment where price action becomes erratic, with false breakouts, sudden spikes, and drifts that often lack any real momentum [4]. Prices might slowly move in one direction – not because of strong buying or selling – but simply because there’s no opposing force to balance the market [4].
"Low-liquidity markets don’t eliminate opportunity, but they demand a different mindset." – Bookmap [4]
Navigating such conditions requires a shift in approach. Traditional chart patterns and technical indicators often fail to distinguish between genuine institutional activity and liquidity-driven fluctuations in these thin markets [4]. This is where order flow tools become essential. They help traders spot absorption zones, identify areas where liquidity is rebuilding, and differentiate between algorithmic testing and genuine participation from committed traders [4]. Recognizing these challenges is crucial before diving into the order flow strategies discussed later.
Order Flow Tools for Low-Volume Markets
When liquidity dries up, standard chart patterns often lose their effectiveness. That’s where order flow tools come in – they provide a clearer view of real-time buyer and seller activity, helping traders distinguish between institutional moves and mere market noise.
Footprint charts are particularly useful for understanding market dynamics in low-volume conditions. These charts display the bid versus ask volume at every price level within a single candle, making it easier to spot the relative aggressiveness of buyers and sellers [2]. In thin markets, this is crucial for identifying absorption – a scenario where a 3x–4x disparity between bid and ask volume suggests strong absorption, a pattern less common in higher-volume sessions [2]. For instance, traders at the best futures prop firms often look for a diagonal imbalance of 300% to 400% to detect meaningful shifts [2].
"Footprint charts are not magic. They’re a microscope revealing order flow mechanics. The edge comes from interpreting them at critical junctures." [2]
Another essential tool is the Cumulative Volume Delta (CVD), which tracks the net total of aggressive buying versus selling throughout a session in low-volume environments [2]. One key signal traders watch for is delta divergence – when prices hit a new high, but the CVD doesn’t follow suit. This often points to buyer exhaustion and hints at a potential reversal.
To complement tools like CVD, the Depth of Market (DOM) and Volume Profile offer additional insights. The DOM, or order book, shows resting limit orders and highlights where liquidity is concentrated [3]. In low-volume markets, it’s especially helpful for spotting iceberg orders – large institutional trades that conceal most of their size [3]. These hidden orders often act as critical support or resistance levels. Meanwhile, the Volume Profile maps out the distribution of volume by price level. It highlights areas like High-Volume Nodes (HVN), which serve as support or resistance, and Low-Volume Nodes (LVN), where prices can move quickly due to a lack of liquidity [8]. The Value Area within the Volume Profile marks the price range where 70% of the session’s total volume occurred [8].
Platforms such as Sierra Chart, ATAS, Quantower, and NinjaTrader offer these tools, ranging from free basic versions to advanced setups like Hameral Order Flow‘s PRO Pack, priced around $550 [8]. By combining the Volume Profile to locate institutional interest, Footprint charts to identify absorption or imbalances, and the DOM to track live liquidity, traders can build effective strategies tailored to low-volume markets.
Top Prop Firms for Futures Traders
Once you’ve fine-tuned your order flow strategies for low-volume markets, finding a prop firm that truly understands the complexities of thin liquidity becomes essential.
Order flow traders in low-volume futures markets face unique challenges, as even a single large trade can significantly impact daily profits. This is where platforms like DamnPropFirms come in handy. They provide verified reviews, in-depth comparisons, and tools like the Consistency Rule Calculator, which helps traders navigate payout requirements without violating firm-specific rules – especially those tailored to high-frequency strategies.
For traders looking to skip lengthy evaluations, instant funding options offer a quicker path. For example, Lucid Trading’s LucidDirect program stands out with no activation fees and daily payouts. To date, they’ve paid over $20 million to more than 24,000 traders, with payouts processed in an average of just 15 minutes [10]. Similarly, Tradeify offers Lightning Funded accounts starting at $349, featuring a 90/10 profit split and payouts in as little as 60 minutes [11]. Both firms use an End-of-Day (EOD) drawdown model, which is particularly forgiving in low-volume sessions where intraday volatility could otherwise trigger restrictive trailing stops [9].
For traders who prefer traditional evaluation models, Apex Trader Funding offers an attractive setup: traders keep 100% of the initial $25,000 profit and can manage up to 20 accounts at once [11]. This flexibility complements order flow strategies, giving traders more confidence during periods of low liquidity. On the other hand, Take Profit Trader charges a $130 upfront activation fee, though firms like Lucid Trading and Tradeify eliminate this cost, reducing overall funding expenses [11].
The Consistency Rule Calculator on DamnPropFirms is a must-have tool for traders to ensure their profit distribution aligns with firm guidelines. For instance, Lucid Trading often enforces a 20–35% rule, while Tradeify caps single-day profits at 40% during evaluations [9]. In low-volume markets, where a single well-timed absorption pattern can yield a week’s worth of profits, this tool helps traders avoid costly mistakes.
With Trustpilot ratings to back their reputations – ranging from 4.4/5 for Apex Trader Funding (based on over 17,100 reviews) to 4.8/5 for both Lucid Trading and Tradeify – these firms have earned the trust of countless traders [12]. Whether you’re scalping volume clusters during the Asian session or trading absorption patterns at key levels, pairing your order flow expertise with the right prop firm can make all the difference. These firm-specific tools and features help sharpen your edge in the challenging world of low-volume futures trading.
1. Watch for Absorption Patterns at Key Price Levels
Using order flow tools effectively means recognizing absorption patterns in areas of thin liquidity. Absorption occurs when aggressive market orders hit substantial limit orders, causing price to stall despite heavy trading activity [2][6].
A telltale sign of absorption is high trading volume without much price movement. For instance, imagine over 2,000 contracts hitting a single price level on the E-mini S&P 500 (ES), yet the price barely budges [2]. On a footprint chart, this shows up as large bid and ask volumes at the same level, paired with a delta divergence – where cumulative delta reflects strong buying, but the price stays nearly flat [2].
"Absorption is essentially when you see huge orders on bid and ask; these need to be unusually large orders." [13]
Absorption becomes especially important near key structural levels like support, resistance, VWAP, or High-Volume Nodes (HVN) on a Volume Profile [2][14]. These areas often attract institutional liquidity in thin markets, a common challenge when trading with top futures prop firms. For example, there was a case on the ES where the price hit a session high of 4,520.00 with 3,000 aggressive buy contracts over three bars. Despite this, the price only ticked up slightly to 4,520.25. Traders who noticed this absorption entered short when the price fell back to 4,520.00, placing their stop at 4,521.00. This setup offered a high-probability reversal opportunity [2].
To act on these patterns, wait for confirmation like a reversal candle or a price reclaim from the key level [2][6].
"Absorption followed by a small move in the opposite direction often indicates the end of the absorption phase and the beginning of a strong directional move." [6]
Keep your stop-loss just beyond the absorption zone to limit risk while keeping potential rewards attractive.
During low-volume sessions, compare what qualifies as "unusually large" volume against the session’s average [14]. Look out for iceberg orders – hidden large orders that are executed in chunks and appear as consistent volume at the same price across multiple bars [6]. Additionally, monitor unfinished auctions, which show up as thin tails with minimal volume at extremes. These can act as magnets for price setups with strong potential edges.
2. Use Cumulative Volume Delta to Spot Divergences
Cumulative Volume Delta (CVD) aggregates net aggressive orders over a period of time, making it a valuable tool for distinguishing genuine order flow from random noise in thin markets [15][19]. While prices in low-liquidity markets often show erratic movements, CVD helps identify whether those moves are backed by real market activity or are just temporary fluctuations.
Two key divergence patterns emerge when analyzing CVD:
- Exhaustion Divergence: This occurs when the price hits a new high or low, but CVD fails to follow suit. It signals a loss of momentum in the market [16][17][18].
- Absorption Divergence: This happens when CVD reaches a new extreme, but the price remains flat. It suggests that aggressive orders are being absorbed by opposing forces [16][17][2].
"The true power delta is revealed when we use it to determine the market’s reaction to powerful buying or selling. We want to see if the market has reacted as we would expect or not."
- Adam, Founder, Jumpstart Trading [17]
These divergence signals are especially useful for confirming trends in the market. When price and CVD align, it indicates strong order flow. For example, if the price breaks above a recent swing high, CVD should also surpass its previous high to confirm aggressive buying activity [17][18]. On the other hand, if price and CVD fail to align, it can act as an early warning of potential market weakness. This makes CVD particularly effective on lower timeframes – such as four hours or less – where shifts in market sentiment are more pronounced [18].
To get the most out of CVD analysis, focus on active trading hours, like the US market open at 9:30 AM ET or the European session starting around 3:00 AM ET. During these periods, liquidity is higher, and signals are more reliable [2]. If the price reaches new highs but CVD lags, it could indicate buyer exhaustion, signaling a potential reversal. In such cases, taking profits might be a smart move [17][18]. By aligning CVD with price action, traders can gain clearer confirmation for their decisions, even in low-volume markets.
3. Confirm Limit Orders in Thin Liquidity
In low-volume futures markets, a large visible limit order doesn’t always mean there’s real liquidity behind it. The Depth of Market (DOM) might show resting orders at various price levels, but those orders can disappear in seconds, especially during thin trading periods. That’s why simply observing isn’t enough – you need confirmation.
The best way to verify a limit order’s legitimacy is through absorption. For example, if aggressive market orders hit a price level and volume surges – say 2,000+ contracts in ES futures – but the price barely moves a tick, you’re seeing a strong limit order absorbing the activity [2]. This "all effort, no result" scenario signals that someone is actively defending that level, rather than bluffing—a tactic often discussed in futures prop firm guides.
"Limit orders don’t move the market… they are simply resting orders. I wouldn’t look at them as magnets unless the price is within 1-2 points of the area."
- Faisal, TRADEPRO Academy [20]
Once you’ve confirmed absorption, you can use visual tools for further verification. Footprint charts complement the DOM by showing where orders are actually being filled, not just where they’re resting. For instance, "zero prints" at price extremes (like zero bids at a swing low) suggest that limit orders have been fully consumed [20]. Tools like Bookmap also help by visualizing resting liquidity as colored blocks, making it easier to spot iceberg orders – hidden large positions that automatically replenish [4].
Another key signal is re-bidding. When liquidity quickly reappears at the same level after being partially consumed, it often reflects genuine institutional interest rather than market manipulation or spoofing [20].
Lastly, proximity matters. Limit orders are most meaningful when the price is within 1–2 points of the level. This closeness allows you to observe how market orders interact with the limit order, providing further confirmation of its authenticity [20].
4. Trade Volume Clusters from Previous Sessions
When analyzing low-volume markets, historical volume clusters provide a useful layer of context alongside real-time order flow data. These clusters highlight key price zones where significant trading activity occurred in the past, and markets often "remember" these levels, even days later [21]. In futures markets with thin order books, these clusters stand out as areas of meaningful activity amidst the noise [1]. They work alongside tools like real-time absorption and delta divergences to pinpoint zones of lasting interest.
Some of the most important clusters to watch are High Volume Nodes (HVNs) and the Point of Control (POC). HVNs tend to act like a magnet, pulling prices back toward them and holding them in place [23]. Meanwhile, the POC, which marks the price level with the highest volume for a session, represents the market’s perception of fair value. If a POC hasn’t been revisited – commonly called a "Naked POC" – it often becomes a high-probability target for price reversals or continuation moves [23].
"Volume clusters act like the market’s memory, highlighting the exact area where buyers and sellers have engaged in intense competition."
- Bookmap [21]
To identify these clusters, you can use Volume Profile indicators, which are available on platforms like Sierra Chart (around $36/month) or MotiveWave ($49/month) [23]. By setting these tools to daily or weekly intervals, you can locate the Value Area and its boundaries [23]. Pay attention to unfinished auctions – price extremes with thin tails – as these often act as price magnets [2].
A practical strategy is to project the previous session’s POC forward. This level can serve as potential support if the price is above a prior HVN, or resistance if it’s below. During low-liquidity periods, such as the Asian trading hours for ES futures, prices often drift toward these historical clusters due to the lack of liquidity to counter directional moves [1]. These insights from past sessions can be a valuable guide for making support and resistance decisions in quieter trading periods.
5. Use Low Volume Nodes for Mean Reversion Trades
In thin markets, mean reversion trading often relies on Low Volume Nodes (LVNs) to pinpoint potential reversals after sharp price movements. LVNs are price levels where the market moved quickly with minimal trading activity, leaving behind areas of low volume [25]. These zones typically highlight points where large traders drove prices into areas of rejection, which tend to either reverse or break through decisively.
In low-volume futures markets, LVNs can be a reliable tool for identifying high-probability mean reversion setups. When prices revisit an LVN, institutional traders often step in to defend their earlier positions. This activity can be observed using footprint charts or heatmaps, where absorption of orders becomes evident. The key to success here is patience – waiting for a pullback to the LVN and ensuring it aligns with the broader order flow strategy outlined earlier.
"Low Volume Nodes (LVNs) represent areas where the price moved fast and volume was low, showing strong activity from large traders." – ChartFanatics [25]
A practical example from ChartFanatics illustrates this concept. After a demand zone initiated an impulsive rally, two LVNs emerged – one around 5563 and another in the 5550s. When the price retraced to the 5563 level, order flow tools revealed buyer absorption of sell orders. A long position was entered at 5561, with a tight stop just below the zone. This setup allowed the trade to capture the rally to the day’s high [25].
For execution, start by identifying the LVN using a volume-by-price profile. Wait for the price to return to the level and look for signs of absorption, which indicate institutional defense of the zone [25]. Place your stop just outside the LVN to account for a clean break, which would invalidate the trade. This method works well when combined with other order flow tools, such as footprint charts and delta analysis, to confirm institutional activity at these critical levels.
6. Track How Fast Liquidity Returns
Tracking how quickly liquidity returns after a price move can help you separate meaningful market activity from noise. In low-volume futures markets, the speed at which liquidity rebuilds after a move indicates whether the move is genuine or fleeting. For example, during the Asian session (7:00 PM–11:00 PM EST), the ES order book typically holds between 500 and 1,000 contracts. A single 100-lot market order can push prices 3–5 points in mere seconds. However, by the London open (3:00 AM–4:00 AM EST), the order book deepens significantly, holding 5,000–10,000 contracts per level as institutional traders step in [1].
To track this, keep an eye on your Depth of Market (DOM) to see how quickly resting orders reappear at key levels. Tools like DOM and heatmaps are invaluable here. If orders quickly restack at a breakout level, it signals institutional support. On the other hand, if the order book remains thin, the breakout likely lacks strength. As Bookmap explains:
"When new liquidity starts rebuilding at key levels, it often signals that genuine interest is returning" [1].
Heatmaps can make this even more visual. After a sharp price move, watch for colored blocks (representing resting orders) to reappear at critical levels. A fast rebuild of these blocks suggests the move has momentum. If they don’t return quickly, the price may snap back once real participants enter the market [1][3].
Another key tool is Time & Sales (the tape), which provides insight into trade frequency. A noticeable increase in trade size and frequency at the bid or ask often signals that liquidity is returning [3]. During U.S. regular trading hours (9:30 AM–4:00 PM EST), the ES order book deepens further, typically holding 10,000–20,000 contracts. At this point, a 100-lot order moves the price by just 0.25–0.5 points, compared to the larger impact seen during low-liquidity sessions [1].
| Session Phase | Typical ES Liquidity (Contracts) | 100-Lot Order Price Impact |
|---|---|---|
| Low-Liquidity (Asian/Overnight) | 500–1,000 | 3–5 points (12–20 ticks) |
| High-Liquidity (U.S. RTH) | 10,000–20,000 | 0.25–0.5 points (1–2 ticks) |
| Session Transition (London Open) | Rebuilding to 5,000–10,000 | Stabilizing / Snap-back potential |
Session overlaps, like the London–New York crossover, naturally improve liquidity and make order flow signals more trustworthy [1]. Avoid chasing breakouts in thin liquidity – confirm that orders are staying at the breakout level before committing. This discipline is vital when scaling funded accounts where capital preservation is paramount. This approach aligns with futures risk management, a necessity in low-volume trading environments.
7. Filter Large Trades to Find Institutional Orders
In low-volume futures markets, where the order book is often thin, spotting institutional players is essential. One effective strategy is setting a minimum contract size – like 200 or more contracts on ES (E-mini S&P 500 futures) – to separate institutional activity from retail noise [27]. This approach works well alongside tools like footprint charts and Time & Sales to confirm institutional moves. In these environments, even a single 100-lot order can shift the price by 3–5 points [1].
By applying this filter, you can analyze the relationship between effort and result. For example, if a massive order (2,000+ contracts) causes only a one-tick price movement, it’s a sign of institutional absorption [2]. As Faisal from TRADEPRO Academy explains:
"Using a trading filter can show you when the big money is participating, when they get desperate and even when a trend is about to capitulate and reverse" [27].
Footprint charts further enhance this strategy by highlighting stacked imbalances – three or more consecutive price levels with a bid/ask volume disparity of 3x–4x [2]. These imbalances often indicate institutional activity and are frequently defended on retests. For ES, a common filter setting to catch these large trades is 189 or 200 lots per transaction [27].
Additionally, monitoring Time & Sales data alongside your filters helps you track trade size, price, and execution speed [3][28]. If you notice multiple large trades hitting the same price level without breaking through, it suggests institutions are defending that zone. Activating "Power Trader" alerts can provide instant notifications when trade volumes surpass the average, signaling the involvement of hedge funds or other large players [5].
Here’s a quick guide to interpreting key signals:
| Signal Type | What to Look For | What It Means |
|---|---|---|
| Absorption | Large volume (2,000+ contracts) with minimal price movement | Institutions defending a level or quietly accumulating [2] |
| Stacked Imbalance | 3+ consecutive levels with 3x–4x bid/ask disparity | Aggressive institutional trend initiation [2] |
| Sweep Orders | Large volume hitting multiple levels instantly | High urgency and conviction to enter/exit [29] |
8. Combine Footprint Charts with Support and Resistance
Support and resistance zones highlight critical price reaction areas, while footprint charts provide a deeper look into trade timing. This pairing is especially useful in low-volume markets, where prices may briefly dip below or above key levels to trigger retail stop orders before reversing. Footprint charts help you distinguish between genuine breakouts and liquidity traps.
To start, mark your key support and resistance zones on a higher timeframe, like a daily or 4-hour chart. Then, switch to a lower timeframe footprint chart – such as a 5- or 15-minute chart – to observe order absorption at these levels. Absorption occurs when significant buy or sell orders prevent the price from moving further, confirming that these zones are being actively defended. This approach connects detailed order flow insights with classic price levels, giving you a better sense of when to enter a trade.
Next, monitor the delta for confirmation. At support levels, wait for the delta to shift from negative to positive, signaling aggressive buying. At resistance, a shift from positive to negative indicates sellers are taking control [2][7]. This delta shift strengthens the absorption signal and helps refine your entry. Additionally, watch for stacked imbalances – three or more consecutive price levels showing a 3x–4x volume disparity. These often indicate institutional activity and can act as dynamic support or resistance during retests [2][22][6].
Absorption and imbalances play a crucial role in this strategy. For example, trader Carmine Rosato used this method to profit from a demand zone. He identified a demand zone at the market open and waited for the price to pull back to a Low Volume Node at 5,563. When the footprint chart revealed passive buyers absorbing aggressive sell orders at that level, he entered a long position at 5,561 with a tight stop-loss, ultimately riding the move to the day’s high [26].
When setting your stop-loss, place it just beyond the absorption zone or the edge of a stacked imbalance. Avoid using arbitrary tick counts to ensure a balance between risk and room for the trade to develop. As AlgoStorm explains:
"Volume Profile provides: WHERE (session POC, value area, HVN/LVN structural levels). Footprint provides: WHEN (real-time confirmation at those levels)" [2].
9. Scale Into Positions on Aggressive Flow Imbalances
When trading in thin markets, scaling into positions can be a smarter way to manage risk compared to entering with your full size all at once. In low-volume futures markets, a relatively small order – like a 100-lot – can push prices significantly, moving 12 to 20 ticks against you instead of the 1 to 2 ticks you’d typically see during high-volume sessions [1][4]. Starting with a smaller position and gradually adding as the market confirms your analysis can help you avoid unnecessary slippage and filter out false moves that are common in illiquid conditions.
A key signal to watch for is a stacked imbalance – three or more consecutive price levels showing a volume disparity of 3× to 4×. This often points to institutional activity [2]. For example, if a stacked imbalance drives the price higher, you can enter a small position and wait for a pullback to that zone. Look for signs like absorption (high volume without price movement) or a delta flip turning positive before adding to your position. As LeoTheTiger from OrderFlow Labs puts it:
"Start with a smaller initial size and build up to a full position in an acceptable range… higher volume means more participants and moves will be more violent so it’s ok to work a range, start small and build your position" [24].
To refine your scaling decisions, use cumulative delta as a confirmation tool. If price and delta are moving together, it strengthens your signal [2][3]. Also, pay attention to how quickly liquidity rebuilds at key levels. A rapid return of liquidity often indicates genuine institutional interest, signaling safer conditions to scale up your position [1][4].
For risk management, place your stop-loss just beyond the stacked imbalance zone, using the actual market structure to validate your levels. Once your trade moves into profit, take partial exits at key levels like the session Point of Control (POC) or the prior Value Area High, and trail your stop to lock in gains [2].
10. Adjust Risk Management for Volatility Spikes
When trading on aggressive flow imbalances, managing risk becomes even more critical during periods of heightened volatility.
In low-volume futures markets, prices can shift dramatically and unexpectedly. Events like sudden news releases or large institutional trades can lead to sharp moves, especially when liquidity is limited. To navigate these conditions, adjust your position sizing for risk-adjusted scaling dynamically and treat volatility like a shift in market behavior.
For instance, when the 14-day Average True Range (ATR) exceeds its 6-month median, immediately reduce your risk per trade by 25% to 50% [30]. Let’s say you typically risk $500 on a $50,000 account using one E-mini contract. In such cases, consider switching to Micro E-minis or reducing the number of contracts to limit your risk to $250–$375. Use this formula to calculate your position size:
Quantity = Dollar Risk / (Stop Distance × Tick Value)
Always round down to ensure you stay within your risk tolerance [54,55]. As Jasman Mann from the International Trading Institute explains:
"Volatility is a regime. When ranges expand, spreads widen, and correlations break, the same position size that felt conservative last month can become reckless overnight" [30].
Another critical signal to watch is liquidity removal. Before a volatility spike, market makers often withdraw their resting orders, leading to wider bid-ask spreads and thinner order books [32]. If you observe blank zones on your depth-of-market (DOM) display, prepare for worse fills and reduce your position size. In these fast-moving conditions, calculate your position with a worst-case slippage buffer instead of relying solely on theoretical stop prices to account for execution risk [30].
Set a stricter daily loss cap during volatile periods – 30% to 50% tighter than your prop firm’s official limit [33]. For example, firms like Apex Trader Funding or Take Profit Trader often use trailing drawdowns that adjust upward with gains but don’t decrease. This means a sudden spike in volatility could turn unrealized gains into a sharp pullback, potentially breaching your limit even if you close with a profit. To mitigate this, many traders cap individual trade risk at 1% of their capital, while more aggressive setups may allow up to 2% [31].
Finally, implement a three-tiered drawdown protocol to protect your account during extended volatility. If your account drops 5% from its recent high, cut your risk per trade by 25% but continue with your usual strategy. At a 10% to 15% drawdown, reduce risk by 50% and focus only on high-conviction setups. If losses exceed 15%, pause trading for 24 to 72 hours and review your trading journal [30]. This structured approach minimizes emotional decision-making and helps maintain discipline when fast market movements threaten your clarity. By integrating this protocol into your overall strategy, you can safeguard your capital during turbulent sessions.
Conclusion
Trading futures in low-volume markets requires a specific approach and a keen eye for market behavior. Pay attention to absorption patterns at crucial price levels, keep an eye out for delta divergences that signal exhaustion, and use volume clusters from prior sessions to fine-tune your trade entries.
Having the right tools is just as important as having a solid strategy. Footprint charts help you see where aggressive market orders meet passive limit orders, while Volume Profile vs Price Action comparisons highlight how high-volume nodes that often act as support and resistance. Cumulative Delta can alert you when institutional activity begins to wane as prices test new extremes. Together, these tools provide a window into the forces shaping low-liquidity conditions.
Understanding market dynamics isn’t just about finding good entries – it also shapes your risk management strategy. In thin markets, risk management becomes non-negotiable. Adjust your position sizes, widen profit targets to account for slower price movement, and tighten loss limits during volatile periods. Many proprietary trading firms use trailing drawdown rules that can be triggered by sudden price spikes, even if your trade eventually recovers. For example, firms like Apex Trader Funding and Take Profit Trader offer opportunities to test these strategies using firm capital, minimizing the risk to your own savings.
If you’re still honing your skills, platforms like DamnPropFirms can be invaluable. They provide tools for comparing firms, verified reviews, and resources like the Consistency Rule Calculator to help you navigate funding requirements. Whether you’re looking for instant funding options with Lucid Trading or Tradeify, or aiming to scale accounts with FundedNext Futures or Topstep, these platforms offer discount codes and educational resources to ease your transition into low-volume trading. Success in these markets isn’t about predicting every price move – it’s about understanding the interplay of supply, demand, and participation, and using that knowledge to craft a winning strategy. [8]
FAQs
How can I quickly identify absorption in low-volume futures markets?
To spot absorption in low-volume futures markets, focus on order flow patterns. Watch for large orders consistently getting absorbed at certain price levels. This often signals significant buying or selling interest. Tools like footprint charts, cumulative volume delta (CVD), and iceberg order detection can make it easier to pinpoint these areas of absorption.
Keeping an eye on these tools can give you a clearer picture of market behavior, helping you anticipate possible price reversals or trends – an advantage in markets with limited liquidity.
How can I effectively use CVD divergence in low-volume overnight futures trading?
To make the most of Cumulative Volume Delta (CVD) divergence during low-volume overnight sessions, it’s crucial to focus on confirming signals before making any moves. Divergence occurs when the price reaches a new high or low, but the volume delta doesn’t follow suit. This often hints at a weakening trend. However, in overnight or low-volume conditions, these signals can be less reliable.
To reduce the chances of false signals, look for confirmation through price action or tools like footprint charts and absorption patterns. For instance, a divergence signal becomes more trustworthy when it’s followed by a clear breakout or reversal with a noticeable increase in volume. Pairing CVD divergence with other order flow tools, such as volume profile analysis, can also help determine if the divergence truly indicates a shift in supply and demand dynamics.
Patience is essential here. Let the market validate the divergence through observable movements before committing to a trade. This method helps cut through the noise and leads to better decision-making in low-volume, overnight trading environments.
How can I adjust my position size to manage slippage in low-volume futures markets?
To handle slippage in low-volume futures markets, start by figuring out the average slippage you encounter during trades. You can do this by studying recent market behavior – look at the difference between your expected and actual fill prices, especially during volatile times or in markets with less liquidity.
Once you’ve estimated the average slippage, adjust your position size cautiously to match your risk management strategy. For example, if your typical slippage is around 2-3 ticks, consider reducing your position size to limit its overall effect on your trade risk. Another helpful tactic is using order flow analysis to spot potential liquidity gaps. This insight can guide you to avoid placing market orders in thin markets, lowering the chances of experiencing slippage.
By factoring slippage into your trade planning and tweaking your position size, you can better manage the hurdles of low-volume markets while keeping your risk under control.