Volume Profile helps traders identify hidden support zones by analyzing where significant trading activity occurred at specific price levels. These zones, often missed on traditional charts, are based on actual market participation, making them more dependable than visible swing lows. Key components include:
- High-Volume Nodes (HVNs): Areas with heavy trading volume, showing strong market acceptance.
- Value Area Low (VAL): The lower boundary of the zone containing 70% of total volume, often acting as support.
- Point of Control (POC): The price with the highest traded volume, serving as a demand zone.
- Volume Shelves: Flat sections where volume increases sharply, indicating accumulation.
By focusing on these levels, traders can improve entries, exits, and risk management. This approach is especially useful for futures traders working with firms that impose strict loss limits, as it ties risk to real market data instead of arbitrary chart points. Tools like anchored volume profiles allow even greater precision by isolating data from specific events like economic reports or major price swings.
Key Takeaways:
- Hidden support zones reflect true market commitment, unlike arbitrary swing lows.
- Volume Profile maps volume by price, highlighting areas of accumulation and rejection.
- Practical uses include identifying pullbacks, setting tight stops, and avoiding false signals in low-volume zones.
This strategy is particularly effective for futures markets like the E-mini S&P 500 (ES), Nasdaq (NQ), and crude oil (CL), offering traders a structured way to manage risk and refine their setups.
What Hidden Support Zones Are and Why They Matter
Defining Hidden Support Zones
Hidden support zones are price levels where significant trading activity occurred in the past, creating areas the market has identified as fair value. Unlike the obvious swing lows you might notice on a candlestick chart, these zones are often tucked within consolidation ranges, lacking dramatic reversal points or clear pivot lows.
Time-based charts, while useful, only show volume over time, not how that volume is distributed across price levels. For instance, a wide-range candle may appear unremarkable but could conceal thousands of contracts traded within a tight price range. This creates what’s known as a volume shelf or high-volume node (HVN), which can later act as a support level.
The key difference is that hidden zones reflect true market commitment, not just surface-level patterns. By using tools like the volume profile, which plots volume horizontally across price levels, traders can identify these hidden accumulation areas and turn them into actionable references.
These zones often align with specific structures in the volume profile:
- High-Volume Nodes (HVNs): Price levels with exceptionally high trading volume, indicating strong market acceptance.
- Value Area Low (VAL): The lower boundary of the area containing about 70% of total volume, where buyers previously stepped in.
- Volume Shelves: Flat sections on the volume histogram where volume suddenly increases, often showing accumulation by larger market players.
For U.S. futures traders working with contracts such as the E-mini S&P 500 (ES) or Nasdaq (NQ), these zones provide a way to define dollar-risk levels based on actual order flow rather than arbitrary chart lines. By aligning entries, stops, and targets with zones backed by tens of thousands of contracts, traders can place stops beyond meaningful structural levels, often requiring risk in the range of several hundred dollars per contract.
Understanding these structures lays the groundwork for seeing why they consistently act as support in the markets.
Why Hidden Support Zones Work in Futures Trading
Hidden support zones are particularly effective because they represent areas where large institutional players have accumulated positions through concentrated buying. When significant buying takes place over a narrow price range, it creates elevated volume that appears as an HVN or volume shelf.
When price revisits these areas, a combination of existing longs, short-covering, and new buying interest often converges. This collective activity reinforces the support level, either causing a bounce or slowing downward momentum. These zones essentially turn previous accumulation points into functional support, even when they don’t align with an obvious swing low.
This approach offers a major advantage over traditional "eyeballed" technical levels. Lines drawn solely based on a single pivot low or an indicator can be arbitrary. In contrast, a high-volume support zone – where thousands or even tens of thousands of contracts were traded – indicates a level many market participants are motivated to defend to avoid losses. This reliance on actual traded volume aligns with a data-driven approach to support analysis.
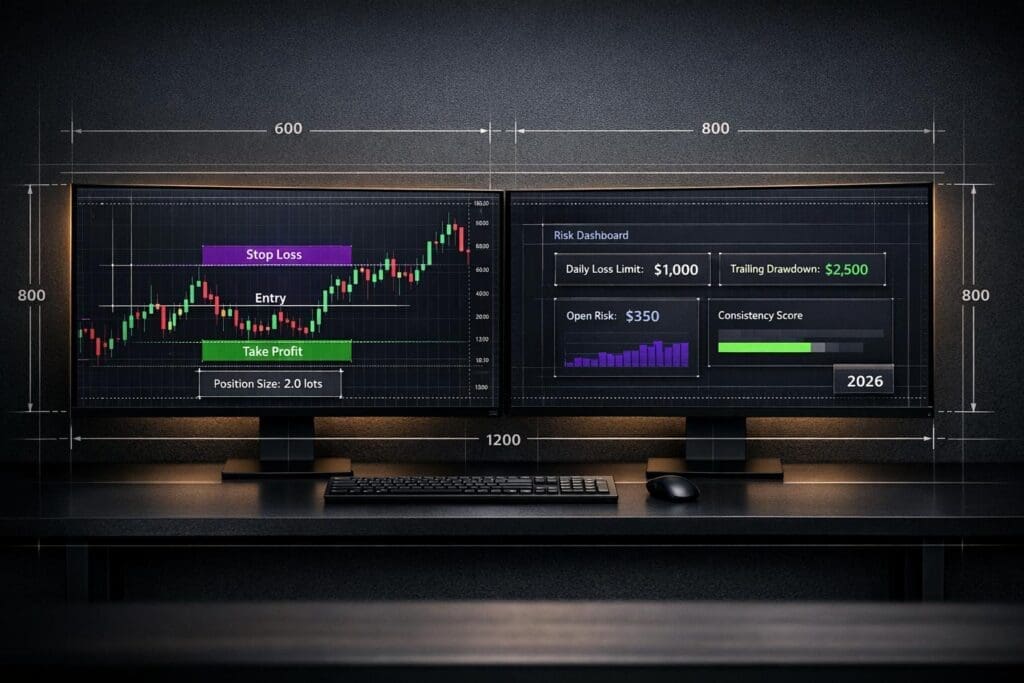
For futures traders, especially those working with proprietary trading firms like Apex Trader Funding, Take Profit Trader, Topstep, or Alpha Futures, this insight can be a game-changer. These firms often impose strict daily loss limits and trailing drawdowns, making it essential to place stops just beyond well-defined HVNs or VAL levels. This ensures that risk is tied to real market data rather than arbitrary points, aligning with the risk management principles highlighted on DamnPropFirms.
Additionally, hidden support zones help traders steer clear of false signals that often arise in areas with low trading volume. Low-volume nodes (LVNs), where the market has previously rejected prices, tend to experience rapid price movements due to limited liquidity. Knowing where the next HVN lies below the current price allows traders to anticipate where a pullback might stall, rather than placing stops in vulnerable low-volume "air pockets."
In practice, whether you’re trading crude oil (CL) or Treasury futures (ZB), these zones help refine position sizing by identifying areas where volatility may compress within high-volume regions or expand in low-volume areas. This structural understanding ensures that tick values, account sizes, and risk-per-trade rules align with the actual dynamics of the market.
STOP Losing Trades: Use Volume Profile to Find REAL Support & Resistance
How Volume Profile Finds Hidden Support Zones
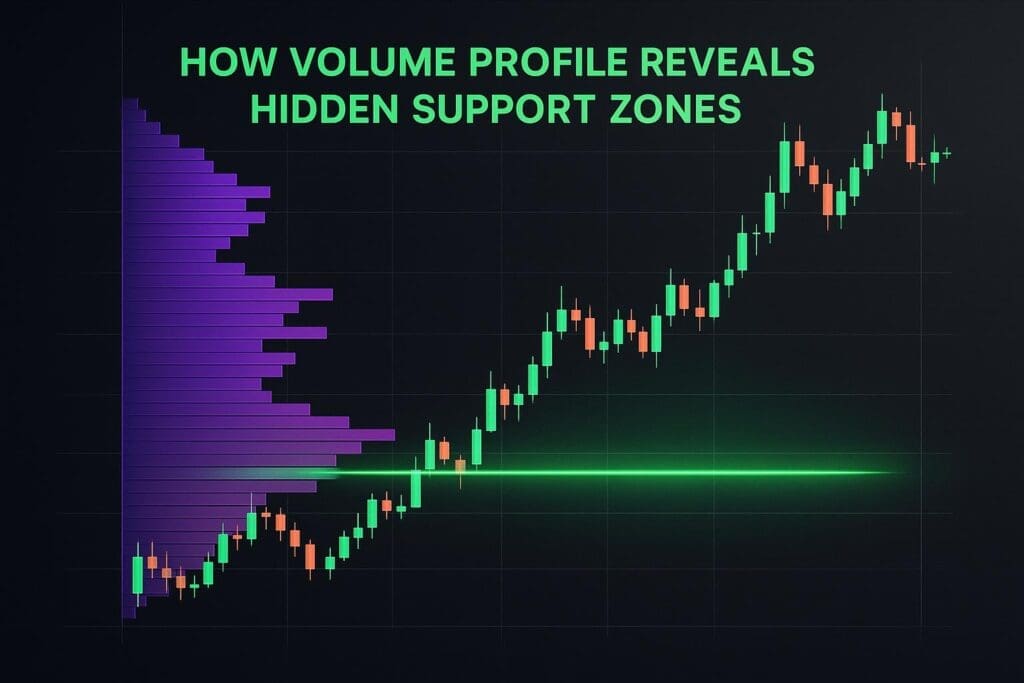
Volume profile analysis provides a detailed way to identify hidden support levels that might not be obvious on traditional charts. It shifts the focus from time-based analysis to showing how much trading activity occurred at specific price levels, creating a horizontal histogram of volume. This unique perspective highlights areas of price acceptance – zones where significant trading occurred and where the market is likely to react when revisited.
When large volumes of contracts trade within a specific price range, it signals that the market has found a fair value at those levels. These areas often serve as structural support zones, even if they don’t align with visible swing lows or pivot points. For U.S. futures traders, volume profile allows for pinpointing support levels based on actual order flow, offering a more reliable alternative to relying solely on chart patterns.
Key Volume Profile Components to Watch
Four main elements of the volume profile help traders identify hidden support zones. Each highlights where institutional and algorithmic orders have concentrated their activity.
- Point of Control (POC): This is the price level with the highest traded volume. When price revisits a previous session’s POC, it often acts as a hidden demand zone, with buyers stepping in to defend this fair-value level.
- Value Area Low (VAL): The lower boundary of the value area, which contains about 70% of all traded volume. It often acts as support when price approaches from above. For example, in the E-mini S&P 500 (ES), risking 5.25 points (or $262.50 per contract at $50 per point) below the VAL ties risk to a clear market structure.
- High-Volume Nodes (HVNs): These are bulges on the volume histogram where heavy trading occurred. When price retests an HVN from above, it often stabilizes as buyers defend their positions or new participants enter at perceived fair value.
- Volume Shelves: These are broader areas of sustained high volume over a price range. They often form below breakouts, and when price pulls back into these shelves, they provide reliable support. Stops can be placed just below the lower edge for clear invalidation.
By understanding these components, traders can mark precise horizontal levels based on actual traded volume, making their risk management more data-driven.
How Volume Profile Analysis Works
Volume-by-price analysis separates areas of price acceptance from areas of rejection. High-volume zones, such as HVNs, the POC, and the value area, indicate where significant positions were established. When price returns to these zones, the accumulation of positions creates natural resistance to further downward movement.
On the flip side, low-volume nodes (LVNs) represent price levels the market rejected quickly. These areas often allow for rapid price movement, with little resistance until the next high-volume zone or volume shelf is reached.
To use this method effectively, configure your volume profile tool with the right settings. For broader trends, apply a composite profile over several weeks. For more immediate levels, use session profiles that cover regular trading hours. On a 5-minute or 15-minute chart, plot daily POC, VAL, and HVNs. Mark these levels as horizontal lines and use visual aids like shading to highlight HVNs, LVNs, and value areas.
During U.S. trading sessions, monitor pullbacks to prior POC, VAL, or volume shelves. Use confirmation tools like order flow, footprint charts, or price-action signals (e.g., rejection wicks or failed breakdowns) to time your entries.
Practical Applications for Futures Traders
For traders working with futures prop firms like Apex Trader Funding, Take Profit Trader, FundedNext Futures, and others, volume profile analysis is especially useful. These firms often have strict rules, such as daily loss limits and trailing drawdowns. By placing stops just beyond HVNs or VAL levels, traders can tie their risk to actual market data, avoiding arbitrary stop placements. Platforms like DamnPropFirms provide tools like the Consistency Rule Calculator to help align trading strategies with firm-specific requirements.
Anchored Volume Profile for Event-Driven Support
An anchored or fixed-range volume profile adds another layer of precision. This tool lets you start the volume analysis from a specific event, such as a major swing low, an FOMC decision, or an inventory report. By isolating volume-by-price data from that point forward, traders can identify event-driven POCs, HVNs, and volume shelves.
For example, anchoring a profile from a major low in crude oil (CL) after a U.S. inventory report might reveal a new HVN and POC cluster around $72.50–$73.00. If price pulls back from $76.00 into this range, traders can treat it as a structural support zone tied to the event. They can plan staggered entries and set stops just below the anchored VAL for a precise, risk-managed approach.
sbb-itb-46ae61d
Trading Strategies for Hidden Support Zones
Once you’ve pinpointed hidden support zones using volume profile analysis, the next step is to apply trading strategies that connect these volume-based levels to actionable setups. These strategies can help you fine-tune your entries, manage risk effectively, and set realistic targets across various market scenarios, whether you’re trading multi-day breakouts or intraday rotations.
Fixed Range Volume Profile for Breakouts
A fixed range volume profile focuses on a specific consolidation period, such as a three-day range in the E-mini S&P 500 (ES) or a multi-session consolidation in crude oil (CL). It maps out where the market found fair value during that period by plotting volume by price.
One effective strategy here is the breakout-retest approach. First, wait for a decisive breakout above or below the range, confirmed by rising volume. Then, watch for the first pullback into the previous value area or the Point of Control (POC) from that range. These levels often act as hidden support because they represent areas where significant positions were built during consolidation, even if they don’t align with obvious price chart patterns.
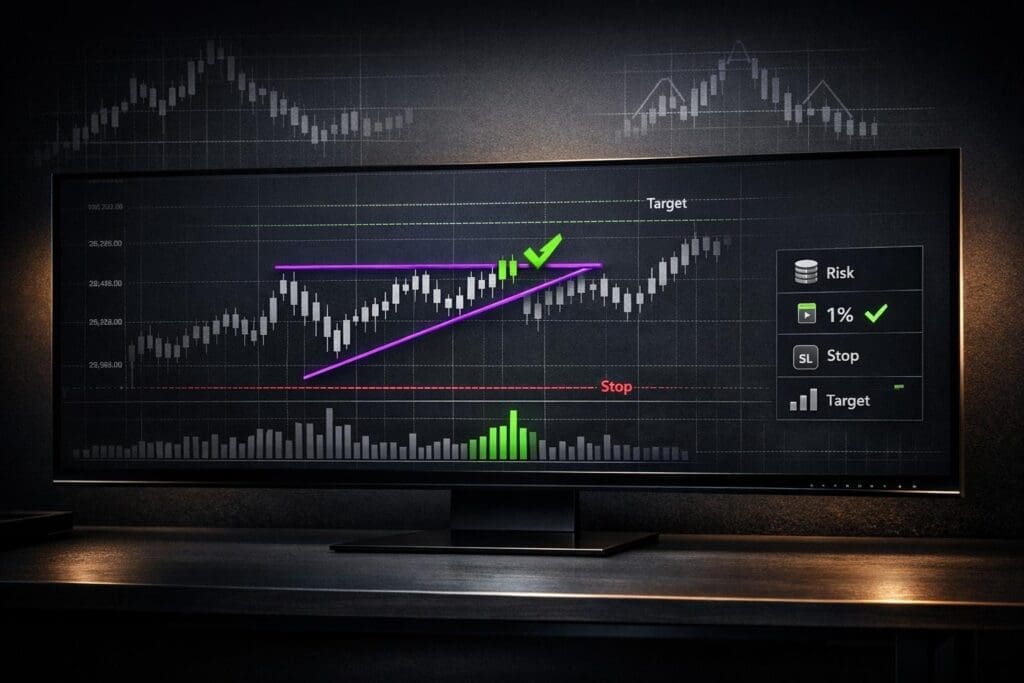
For instance, say the ES consolidates between 4,500 and 4,540 over three days. The fixed range profile shows a POC at 4,520, a value area between 4,516 and 4,526, and a high-volume node (HVN) near 4,520. On day four, the price breaks above 4,540 with strong volume and later pulls back to 4,522, briefly dipping into the prior value area and retesting the 4,520 POC. A trader might go long at 4,523 after spotting a bullish engulfing candle on a 15-minute chart, place a stop at 4,514 (below the value area low and a minor swing low), and aim for a 40-point move, targeting 4,563. With one ES contract, this setup risks 9 points (around $450) on a $45,000 account, keeping risk at 1% per trade.
Stops should be placed just beyond the value area edge to avoid being shaken out by market noise. Targets can be set at the next low-volume node (LVN), the opposite side of the range extension, or based on a measured move derived from the consolidation’s height.
Another variation involves using volume shelves – flat sections in the profile where volume drops off sharply. When the price breaks through a volume shelf, the edge of the shelf can act as hidden support on the first retest. Traders can stagger their entries near this shelf edge and place stops just below its lower boundary for clear trade invalidation.
For those trading with futures prop firms like Apex Trader Funding, Take Profit Trader, or Topstep, this fixed range strategy aligns well with the strict drawdown and consistency rules these firms require. Tools like the Consistency Rule Calculator on platforms such as DamnPropFirms can help traders adapt these strategies to meet firm-specific guidelines.
Session Volume Profile for Intraday Trading
Session volume profiles chart price-based volume during regular trading hours (9:30 a.m.–4:00 p.m. ET). These profiles help day traders identify each session’s value area and POC, which can serve as key reference points for the current or next trading session.
A common intraday strategy involves retesting the prior session’s value area low (VAL) or POC. For example, after a gap up or an early trend move, prices often pull back into the previous session’s VAL or POC. Even if these levels don’t align with obvious swing lows, they often act as hidden support because they reflect areas of fair value from the prior session. Traders might enter long when the price tags these levels in an uptrend – trading above the opening price and VWAP – while placing stops a few ticks below the low-volume edge of the value area. Initial targets could be set at the current session’s VWAP or POC.
Another approach uses the developing session profile. Many traders let the first 30 to 60 minutes establish an "initial balance" and then build a developing profile that identifies the early POC and value area. If the market trends higher in the morning, a midday pullback into early volume clusters might signal a low-risk long entry. Stops can be kept tight, with targets set for an afternoon range extension or a retest of intraday highs.
Time-of-day patterns also play a role. Liquidity and volatility tend to spike at the U.S. open (9:30 a.m. ET) and close (3:30–4:00 p.m. ET), while midday often sees a slowdown. Traders can use this rhythm to their advantage by entering on midday pullbacks into morning volume clusters and holding positions into the afternoon, when order flow often accelerates. For instance, if the ES opens at 4,550 and establishes a morning POC at 4,555, then trends to 4,570 by late morning, a pullback to 4,556–4,558 around lunchtime could offer a low-risk entry. A trader might enter at 4,557, set a stop at 4,552 (below the morning VAL), and target 4,570 or the developing afternoon high. This setup works well for traders operating under strict consistency and drawdown rules at firms like FundedNext Futures, Alpha Futures, and Tradeify.
Combining Volume Profile with Price Action
Volume profile provides the framework for identifying key price levels, but price action is what refines your trade entries. By combining these two tools, traders can reduce false signals and improve timing.
At a hidden support zone – like a VAL, POC, HVN, or the edge of a volume shelf – wait for a clear rejection pattern before entering. Look for bullish pin bars, engulfing candles, or consolidation patterns that reject lower prices. For example, a valid long setup might involve an upside breakout above a fixed-range value area, followed by a pullback into the prior VAL/POC cluster. If a bullish pin bar forms on a 5-minute or 15-minute chart, you could enter on the close of the confirmation candle, place your stop a few ticks below its low, and target the next LVN or a previous high.
Another method is the failed break or rejection pattern. Here, the price briefly dips below a VAL or LVN, quickly recovers, and closes above it. This signals a strong long opportunity, as it shows sellers couldn’t maintain control below the volume-based level. Adding volume analysis helps confirm the trade – watch for declining selling volume into the support zone, followed by a volume spike on the reversal candle. Secondary indicators like RSI divergence or moving-average confluence at key volume levels can also reinforce the setup. For additional confirmation, order flow or footprint charts can reveal absorption, where large bids prevent the price from dropping further.
These strategies, rooted in volume analysis and refined by price action, create a structured approach to trading hidden support zones, helping traders execute with confidence and precision.
Pros and Cons of Volume Profile for Hidden Support
Volume profile comes with its own set of strengths and weaknesses. By understanding both, traders can leverage its potential while steering clear of common mistakes. This balanced view builds on earlier discussions of volume profile strategies, offering a well-rounded perspective on identifying hidden support zones.
Benefits of Volume Profile Analysis
Volume profile organizes trading activity by price, making it easier to spot where significant buying and selling occurred. This approach uncovers support zones that standard price charts might miss, giving traders an edge in identifying high-probability setups.
- Support zones based on real volume: Unlike traditional charts that may show arbitrary resistance or support, volume profile identifies areas where substantial trading activity occurred. These zones often represent the "battlefields" where buyers and sellers clashed, making them more reliable as support levels.
- High-volume nodes (HVNs) and value areas: These zones, which typically encompass about 70% of total traded volume, often act as strong support when revisited. When prices return to these areas, institutional investors frequently step in, creating a natural floor for the market [1][2].
- Precision in entries and stops: Volume profile allows traders to define support zones within narrow price brackets. For instance, in the E-mini S&P 500 (ES), a high-volume zone might span just a few ticks. This precision helps traders place limit orders effectively and set tight stops, improving reward-to-risk ratios while minimizing the impact of market noise [7][1].
- Clarity on market structure: By distinguishing between balanced ranges, trend bases, or anomalies, volume profile provides context about the type of support zone in play. This insight helps traders decide how aggressively to trade a level and what kind of price behavior to anticipate [1][2][3].
- Scalability for different trading styles: Whether you’re day trading the ES or swing trading crude oil (CL), volume profile principles remain consistent. It adapts well across various timeframes and markets [1][2][3].
For traders working with futures prop firms like Apex Trader Funding, FundedNext Futures, or Alpha Futures, volume profile’s precision is invaluable. Tight risk definitions around high-volume zones help traders adhere to strict drawdown and consistency rules. Platforms like DamnPropFirms offer tools and resources to support these strategies.
While these benefits are compelling, volume profile is not without its challenges.
Limitations to Keep in Mind
Despite its strengths, volume profile has limitations that traders should consider:
- Range selection risk: Choosing the wrong range can result in misleading support zones, as it may not accurately reflect market acceptance.
- Backward-looking nature: Volume profile relies on past trading activity, which means it can’t predict sudden market shifts caused by news or economic events.
- Over-reliance on past volume: Just because a level saw heavy trading in the past doesn’t guarantee it will hold as support in the future. Market participants may have exited or adjusted their positions, weakening the zone’s significance.
- Challenges in illiquid or volatile markets: In thinly traded markets or during rapid price moves, price can easily cut through both low-volume and high-volume areas. This makes support zones less reliable and prone to false signals.
- Ignoring broader context: Solely focusing on hidden support zones without considering the overall trend, higher-timeframe structures, or additional tools like VWAP can lead to poor decisions and increased risk.
- Data quality issues: Poor data quality or platform errors can distort volume profiles, leading to inaccurate support zones and potential execution problems [3][5][4].
| Aspect | Benefit for Hidden Support | Limitation / Risk |
|---|---|---|
| HVNs / Value Area | Strong, repeatable support zones; ideal for mean-reversion trades [1][2][3] | May turn into congestion zones, leading to choppy price action for late entries |
| LVNs / Thin Zones | Highlight breakout paths and weak support areas [1][2][3] | Lack of strong support; price can quickly cut through these zones |
| POC (Point of Control) | Serves as a price magnet and reference for stops and targets [1][3] | In strong trends, price may bypass the POC without reacting significantly |
| Session / Fixed-Range Profile | Enhances precision by tailoring support zones to specific sessions [1][2][3] | Incorrect range selection can distort levels |
| Illiquid Futures / Off-hours | Limited applicability | Profiles can be noisy and unreliable due to sparse trading [3][5][6] |
| Standalone Use | Simple framework for mapping structure and support [1][3] | Increases risk when used without other tools or broader market context |
Conclusion
Volume profile provides a fresh perspective on support analysis by highlighting price levels where significant market activity occurred. These levels, often overlooked in traditional chart patterns, tend to function as support because institutional players defend their positions at these points.
Key elements like high-volume nodes, value area lows, and the point of control reveal where buyers and sellers reached equilibrium. Meanwhile, low-volume nodes act as rejection zones, where prices often move quickly until they find the next area of heavy trading. This approach bridges theoretical concepts with actionable strategies for identifying support.
For practical use, intraday traders often rely on Session Volume Profile to monitor evolving support zones during U.S. trading hours in instruments like the E-mini S&P 500 (ES), Nasdaq futures (NQ), or crude oil (CL). On the other hand, swing traders use Fixed Range Volume Profile to analyze multi-day consolidations and locate stronger support zones. Pair these volume-based levels with price action signals – such as rejection wicks or engulfing candles – and add confluence tools like Fibonacci retracements around major high-volume nodes. A simple playbook could look like this: “Enter long at the prior value area low with confirmation from a price action signal, set a stop below the low-volume node, and target the point of control.”
It’s important to stay grounded in reality. Volume profile shows where trading has occurred, but it doesn’t guarantee these levels will hold. Market conditions can shift due to breaking news or heightened volatility, which may render older profiles less relevant. To identify accurate value areas, selecting the right range is crucial. By combining volume profile insights with disciplined risk management and a clear understanding of broader market conditions, traders can enhance their strategies. However, volume profile should never be used in isolation – risk controls, macroeconomic awareness, and a solid grasp of market context are essential, especially in leveraged futures trading where slippage and gaps can override even strong volume-based support.
For those trading with funded or evaluation accounts, volume profile’s precision can be a valuable asset in meeting strict drawdown and consistency requirements. Platforms like DamnPropFirms help traders compare U.S.-friendly futures prop firms, including Apex Trader Funding, Take Profit Trader, FundedNext Futures, Alpha Futures, Tradeify, TradersLaunch, Lucid Trading, Phidias Prop Firm, FundedFuturesNetwork, and Topstep. Traders can also leverage tools like the Consistency Rule Calculator and verified discounts to optimize their performance.
To put these ideas into action, start by selecting a futures market and applying a volume profile tool. Identify major high-volume nodes and value area lows from recent trading ranges, then observe how these levels behave as hidden support during pullbacks. Keep a detailed trade journal to track performance, analyze outcomes, and refine your strategy based on real-world results. With volume profile, previously unseen support levels become a structured framework for making informed trading decisions rooted in market activity.
FAQs
How can I use Volume Profile to find hidden support zones in volatile futures markets?
Volume Profile is an excellent tool for spotting hidden support zones by examining how trading activity is distributed across various price levels. In the often unpredictable futures markets, these zones usually align with areas of significant trading volume, signaling strong interest from either buyers or sellers.
To get the most out of Volume Profile, pay close attention to high-volume nodes. These are price levels where trading activity is particularly concentrated. Such areas frequently serve as support zones because they attract traders to revisit them, leading to potential reversals or periods of consolidation. When you pair Volume Profile with other technical analysis methods, you can gain a clearer picture of market behavior and make more confident trading decisions.
What are the benefits of using anchored volume profiles to identify support levels after key market events?
Anchored volume profiles are a powerful tool for traders looking to uncover hidden support levels. By examining how trading volume is distributed around specific price points following major events – like earnings reports or economic announcements – this approach sheds light on areas of significant buying or selling activity. These insights help traders zero in on price zones where the market is more likely to respond.
This method focuses on event-driven price movements, giving traders a way to align their strategies with real-time market behavior. It sharpens decision-making and makes it easier to identify high-probability trade opportunities. Anchored volume profiles are especially useful in futures markets, where rapid responses to breaking news or data releases can open the door to fresh trading possibilities.
How does Volume Profile compare to traditional technical analysis tools for identifying support zones in futures trading?
Volume Profile sets itself apart from typical technical analysis tools by diving deeper into market activity. While indicators like moving averages or RSI focus on price trends or momentum, Volume Profile zeroes in on actual trading volume at specific price levels. This unique approach shines a light on hidden support and resistance areas that other tools might miss.
By emphasizing the price levels where trading is most concentrated, Volume Profile offers a sharper insight into market sentiment and potential turning points. For futures traders, this can be a powerful tool for pinpointing key support zones grounded in real volume data.