Profit factor beats win rate. Hands down. Why? Because profit factor tells you if you’re actually making money. Win rate? It just tells you how often you win – not how much you win (or lose) when you do. You can win 80% of your trades and still blow your account if your losses are massive compared to your gains.
If you’re a scalper or running a high-frequency strategy, sure, win rate matters more. You’ve got to hit a high percentage because your profit margins are tiny. But for swing or trend traders, profit factor is king. A 40% win rate can crush it if your winners are big enough.
This article breaks it down: when to care about each, how to calculate them, and why profit factor is the real test of your trading edge. Let’s dive in.
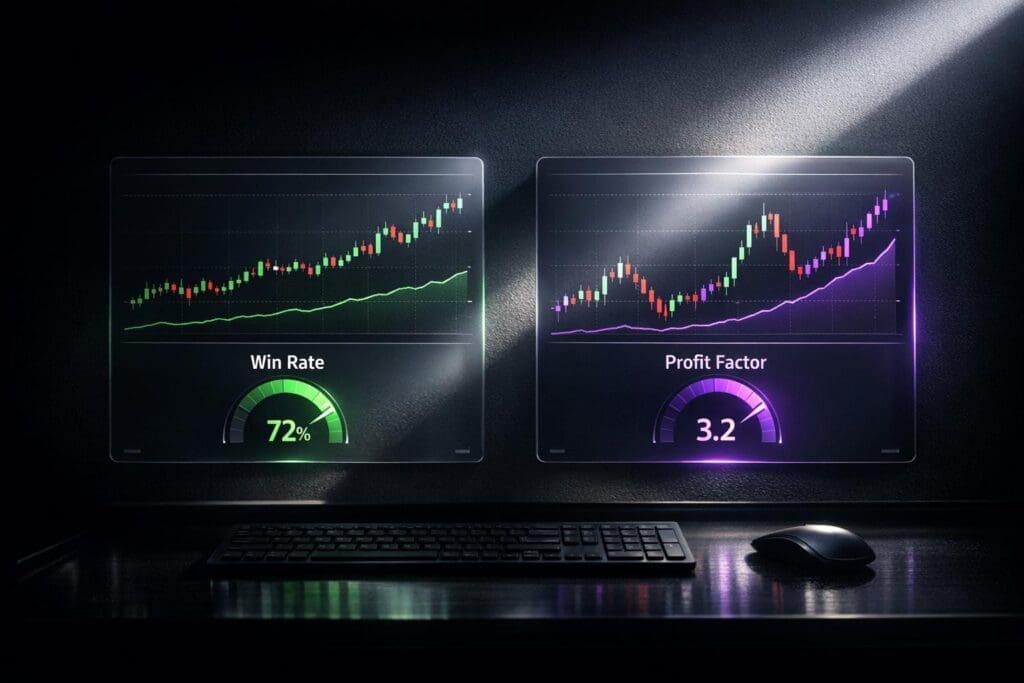
Profit Factor vs Win Rate: Trading Metrics Comparison
This guy passed a $100K account with less than a 50% win rate
sbb-itb-46ae61d
What Is Win Rate?
Win rate measures how often your trades end in profit, expressed as a percentage. It’s a simple way to gauge the success of your trading strategy. For example, if you have a 60% win rate over 100 trades, that means 60 of those trades were profitable.
How to Calculate Win Rate
The formula for win rate is straightforward: Win Rate = (Number of Winning Trades / Total Trades) × 100. Let’s break it down with an example: if you placed 50 trades last month, with 30 winners and 20 losers, your win rate would be (30 ÷ 50) × 100 = 60%. While most trading platforms calculate this for you, knowing the formula helps you double-check your stats.
Keep in mind, win rate becomes reliable only after a decent sample size. Experts suggest analyzing at least 30 to 50 trades, though 100 or more is ideal for better accuracy [1]. A 70% win rate over just 10 trades might just be luck, so having a bigger data set is key to understanding your strategy’s performance.
What High and Low Win Rates Mean
A high win rate often feels like you’re on the right track, but it doesn’t guarantee you’re profitable. In fact, about 73% of beginner traders focus too much on win rate rather than profit factor. This is often tied to loss aversion – the psychological tendency to feel losses more strongly than gains [4].
Here’s the kicker: a trader with a lower win rate can still outperform one with a higher win rate if their winning trades are much larger than their losing ones. For instance:
- Trader A: 70% win rate, average win = $50, average loss = $200. Over 100 trades, they lose $2,500.
- Trader B: 40% win rate, average win = $300, average loss = $100. Over the same 100 trades, they make $6,000 [1].
As K.M.F. says: "Win rate without context is meaningless – a 70% win rate can still be a losing strategy" [1].
Different trading styles, especially when using the best futures prop firms, naturally lead to different win rates. Scalpers typically aim for a win rate of 65% or higher since their profit margins are slim, and commissions can eat into their gains [7]. On the other hand, trend followers often work with win rates between 35% and 50%, relying on smaller, frequent losses and occasional big wins to stay profitable. The bottom line? Win rate alone doesn’t tell the whole story. You’ve got to pair it with the size of your wins and losses to get the full picture of your trading performance.
Understanding win rate lays the groundwork for comparing it with profit factor, which we’ll dive into next to see how these metrics work together to evaluate your strategy.
What Is Profit Factor?
Profit factor is a way to measure how much money your trading strategy makes compared to how much it loses. It’s the ratio of total gross profit to total gross loss over a specific time or set of trades [4]. In simple terms, it answers: "For every dollar lost, how many dollars are earned?" [1] While win rate tells you how often you win, profit factor digs deeper by showing how efficient your strategy is, factoring in both the size and frequency of wins and losses [2].
The beauty of profit factor is that it’s tough to fake. A trader might inflate their win rate by grabbing small profits and letting losses balloon, but profit factor will expose that approach as flawed. A profit factor above 1.0 means your strategy is making money, while anything below 1.0 signals it’s losing [4].
How to Calculate Profit Factor
The formula is straightforward:
Profit Factor = Total Gross Profit ÷ Total Gross Loss [4].
For example, if you’ve made $12,000 in wins and $8,000 in losses across 100 trades, your profit factor is $12,000 ÷ $8,000 = 1.5. This means you’re earning $1.50 for every $1.00 lost [4].
"Profit factor is the most misquoted metric in trading. Someone posts a 4.5 PF and everyone assumes holy grail. Nobody asks the sample size." [3]
Here’s a quick guide to understanding profit factor ranges:
| Profit Factor | Rating | Description |
|---|---|---|
| < 1.0 | Losing | Strategy loses money overall [4] |
| 1.0 – 1.5 | Weak/Fragile | Barely profitable; sensitive to costs [4] |
| 1.5 – 2.0 | Solid | Shows a sustainable edge with good risk control [5] |
| 2.0 – 3.0 | Strong/Robust | Reflects high-quality, professional-level trading [5] |
| > 3.0 | Exceptional | Often indicates over-optimization or small sample size [3] |
Always use net figures – after commissions and slippage – when calculating profit factor. For scalpers at top prop firms, a gross profit factor of 1.3 might shrink to 1.05 or less after costs. Generally, a profit factor of 1.5 or higher is the baseline for a strategy that can hold up over time [4].
Now, let’s dive into why profit factor is such a clear indicator of the balance between risk and reward.
Why Profit Factor Shows Risk-Reward Balance
Unlike win rate, which only tells you how often you win, profit factor captures both how often and how much you win or lose. It gives a complete picture of your strategy’s risk-reward profile – showing what actually happened, not just what you hoped for [4].
Take this example: A trader with a 40% win rate can outperform someone with an 85% win rate if their profit factor is higher. Many new traders (about 73%) fixate on win rate because of loss aversion, which often leads to bad habits like cutting winners short or letting losses run. Both of these kill profit factor [1][4].
The math behind profit factor looks like this:
Profit Factor = (Win Rate ÷ Loss Rate) × (Average Win ÷ Average Loss) [3].
This explains how a strategy with a low win rate can still crush it. For instance, backtested futures strategies often show profit factors between 1.2 and 2.0 [2]. Scalpers tend to land between 1.1 and 1.5, while position traders might hit 1.5 to 3.0 or more [3].
To boost your profit factor, you’ve got two levers:
- Let your winners ride to their targets (increase the numerator).
- Cut your losses quickly at planned stops (shrink the denominator) [1].
It’s all about managing risk and reward effectively.
Key Differences Between Profit Factor and Win Rate
Win rate and profit factor each tell a different story about your trading. Win rate is all about frequency – how often you win – while profit factor dives into efficiency, showing how much you earn compared to what you lose [6][1]. It’s like comparing how many times you score in a game (win rate) versus how many points those scores actually add up to (profit factor). One’s about the number of wins; the other’s about the quality of those wins.
Here’s the catch: win rate doesn’t care about trade size. You could win 80% of the time, but if your losses are massive compared to your small wins, you’re still in trouble [6][5]. Profit factor, on the other hand, looks at the whole picture – how often you win and how much you win [2][1]. A profit factor above 1.0 means you’re making money; below 1.0 means you’re losing. Win rate can’t give you that level of insight [6][2].
Psychologically, win rate feels good – it’s instant validation. But profit factor is the real judge of performance. Around 73% of new traders get stuck on win rate because they hate losing. They’d rather be "right" more often, even if it means grabbing small wins while letting losses spiral [4]. This mindset can wreck your account over time.
| Feature | Win Rate | Profit Factor |
|---|---|---|
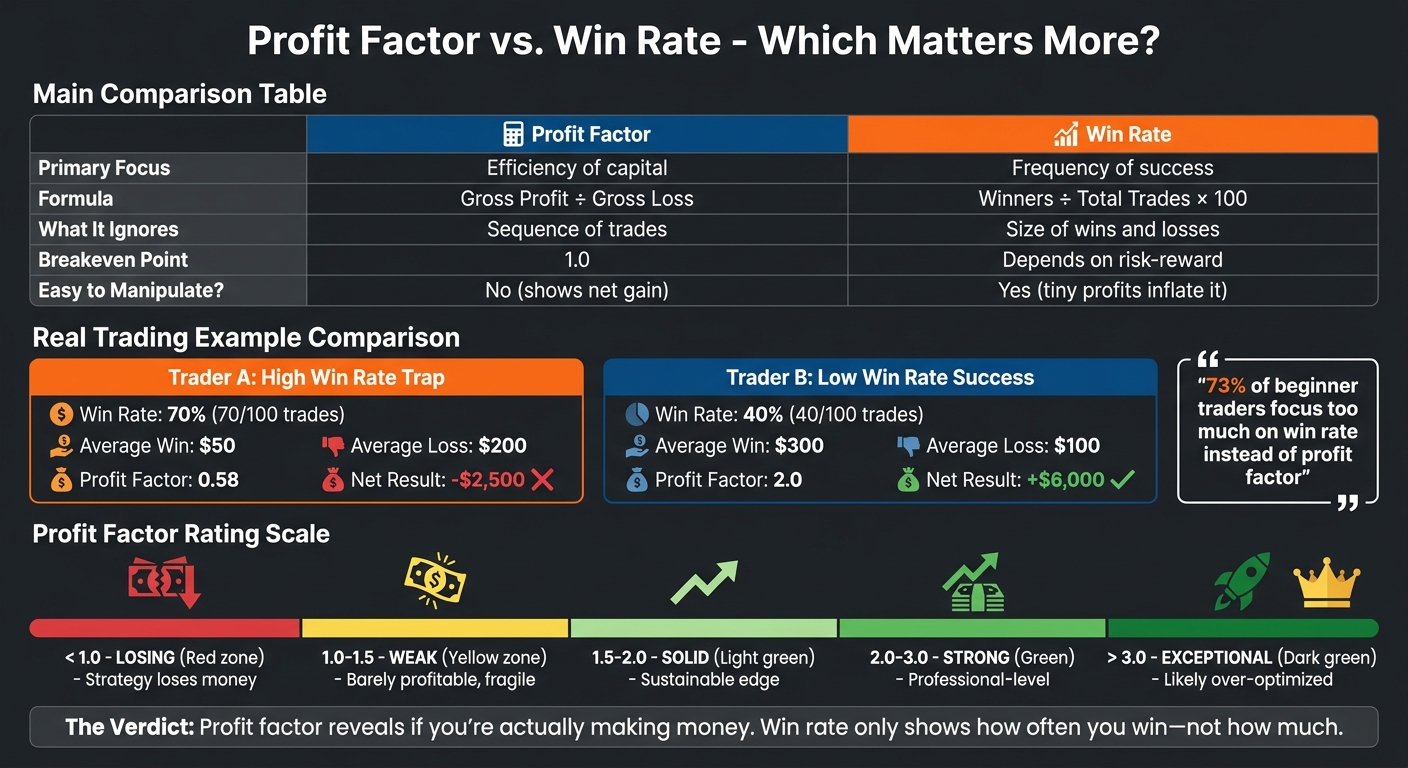
| Primary Focus | Frequency of success | Efficiency of capital |
| Formula | Winners ÷ Total Trades | Gross Profit ÷ Gross Loss |
| Ignores | Size of wins and losses | Sequence of trades |
| Breakeven | Depends on risk-reward | 1.0 |
| Gaming Potential | Easy to inflate with tiny profits | Hard to manipulate; shows net gain |
These differences become even more obvious when you see them in action, which we’ll dive into next.
Profit Factor vs. Win Rate: Trading Examples
Let’s take the definitions of win rate and profit factor and see how they play out in real trading. Numbers on a spreadsheet don’t hit home until you see them in action. Below are two scenarios that show how these metrics can tell completely different stories about the same trading account.
Example 1: High Win Rate, Low Profit Factor
Trader A wins 70 out of 100 trades, giving them a solid 70% win rate. Sounds great, right? But here’s the kicker: their average winning trade is $50, while their average losing trade costs $200. That math results in a profit factor of just 0.58. After 100 trades, they’re down $2,500 [1].
This shows why chasing frequent small wins while taking big losses is a recipe for disaster. Trader A is locking in quick wins for the dopamine hit but letting losses spiral out of control, hoping they’ll reverse. That’s classic loss aversion [4]. A profit factor below 1.0 means the strategy is bleeding cash, no matter how good the win rate looks [4].
Worse, this strategy is fragile. Add slippage and commissions into the mix, and that $2,500 loss could be even uglier. Profit factors between 1.0 and 1.5 are already shaky, but below 1.0? You’re in trouble [4][5].
Example 2: Low Win Rate, High Profit Factor
Now let’s look at Trader B. They only win 40 out of 100 trades – just a 40% win rate, which would make most new traders panic. But here’s the difference: their average winning trade is $300, and their average losing trade is only $100. That gives them a profit factor of 2.0. After 100 trades, they’re up $6,000 [1].
This is the trend-following mindset in action. Trader B keeps losses small and lets winners run. They’re fine with being wrong 60% of the time because when they’re right, they hit big. A profit factor of 2.0 is in the "strong" range, meaning this strategy has a real edge and can absorb trading costs without breaking a sweat [4].
| Metric | Trader A (High Win Rate) | Trader B (Low Win Rate) |
|---|---|---|
| Win Rate | 70% | 40% |
| Avg Winner | $50 | $300 |
| Avg Loser | $200 | $100 |
| Profit Factor | 0.58 | 2.00 |
| Net Result (100 Trades) | -$2,500 | +$6,000 |
Trader B’s results aren’t about luck – they’re about sticking to disciplined risk-reward rules and letting the odds do the heavy lifting. These examples highlight how knowing when to focus on win rate versus profit factor can make or break your strategy.
When Win Rate Matters More
Win rate becomes a top priority in trading strategies where frequency and consistency outweigh the size of individual wins. For scalping and high-frequency trading, a high win rate is non-negotiable. These methods rely on tiny profit margins per trade, and cumulative costs like commissions and slippage can quickly eat into your gains[6]. For instance, a gross profit factor of 1.3 can shrink to just 1.05 after fees, which puts you dangerously close to breaking even[3].
Mean reversion strategies also depend heavily on a high win rate, typically aiming for 60% to 75% or more[5]. These strategies bank on prices snapping back to the average, so frequent, smaller wins are necessary to stay profitable. Compare that to trend-following strategies, where a win rate around 40% might still work because big winners make up for fewer overall wins. But beyond the mechanics of each strategy, psychology plays a massive role in why win rate matters.
Studies show that most beginners overemphasize win rate because of loss aversion – the pain of losing feels about twice as intense as the joy of winning the same amount[1][4]. High win rates create smoother equity curves and reduce drawdown volatility, which helps traders stick to their plan without panicking. This mix of psychological comfort and strategy requirements is even more critical in futures prop trading.
Even though profit factor measures overall efficiency, a high win rate is often key to passing prop firm challenges. Futures prop traders face strict drawdown and consistency rules, so strategies with high win rates are often better suited for these environments. For example, a strategy with a 70% win rate and a tight risk-reward ratio of 0.86:1 can still hit a strong profit factor of 2.0[3]. This makes it easier to stay within drawdown limits and meet consistency requirements. When backtesting high-win-rate setups for prop challenges, aim for a profit factor of at least 1.5. Keep in mind that live trading conditions often knock this down to 1.2–1.3[2].
If you’re looking for detailed reviews and updates on prop firm rules, check out DamnPropFirms. For example, our Apex Trader Funding review covers the latest account options and rule changes.
When Profit Factor Matters More
Profit factor is crucial in strategies where the size of wins outweighs the frequency of wins. For example, trend-following and swing-trading strategies often have win rates below 50%. But they can still be highly profitable because their winners are much larger than their losers, measured in "R-multiples" [7][1]. A strategy with a 30% win rate can make money if the winners are three times bigger than the losers. On the flip side, a 70% win rate can still bleed cash if the losers are five times larger than the winners [5]. This is why profit factor is so valuable – it gives a clear, single-number snapshot of profitability. If it’s above 1.0, you’re making money. Win rate alone doesn’t tell you that [6][2]. This makes profit factor a key metric for strategies that prioritize trade size over trade frequency.
For traders who take fewer but larger trades – like swing or position traders – profit factor becomes even more important. Each trade carries more weight, so the metric provides a better gauge of performance [7]. Professional-level strategies often aim for a profit factor between 2.0 and 3.0. Anything below 1.5 in backtesting is risky once you factor in slippage and commissions [2][5]. For trend-followers, low win rates aren’t a dealbreaker if the profit factor stays above 1.5 [5][4].
Another reason profit factor stands out is that it’s hard to game. Boosting win rates with tiny profits will drag down your profit factor and overall returns [6][1]. If you want to improve this metric without changing your entry signals, focus on cutting losses at your planned stops and letting your winners run to their full targets [1]. To get reliable results, analyze at least 50–100 trades [2][7].
In futures prop trading, a profit factor of 1.3 or higher over 100+ trades usually signals a repeatable edge, not just luck [3]. While most prop firms don’t enforce a strict minimum profit factor, anything under 1.2 leaves little room for error, especially with tight drawdown rules [3]. For day traders, a profit factor between 1.3 and 1.8 is solid. With high trade frequency, even small edges can add up fast [3].
Check out our in-depth reviews of prop firms on DamnPropFirms, including detailed breakdowns for Take Profit Trader, Topstep, and Apex Trader Funding.
Profit Factor and Win Rate in Futures Prop Trading
In futures prop trading, profit factor (PF) is far more critical than win rate when it comes to evaluations and funded accounts. While most firms don’t set a strict minimum PF, a range of 1.3–1.4 is often seen as the baseline for passing challenges without relying on luck. Anything under 1.2 leaves almost no room for error, especially with tight drawdown limits and consistency rules. If you’re a day trader taking multiple trades per session, a PF between 1.3 and 1.8 is generally solid since even small edges can add up quickly with frequent trades [3].
Win rate, on the other hand, can be deceiving. You could win 70%–80% of your trades but still blow your account if your PF is below 1.0. Prop firms care about one thing: can you hit profit targets without breaking drawdown rules? PF sums up your trading performance in one number. For swing traders or trend-followers who take fewer but larger trades, a PF of 1.5–2.5 is more realistic, giving enough cushion to handle a few consecutive losses [3]. This emphasis on PF over win rate highlights the importance of understanding benchmarks and consistency rules in prop trading.
Prop Firm Benchmarks for These Metrics
The profit factor you should aim for depends on your trading style:
- Scalpers: Typically see PFs between 1.1 and 1.4, with 1.3 being a solid target.
- Day Traders: Often land in the 1.2–1.8 range, with 1.5 or higher being strong.
- Swing Traders: Commonly achieve PFs between 1.3 and 2.5, with 1.8 considered excellent.
If you see a PF above 3.0 in backtesting, that’s usually a red flag for over-optimization or an insufficient sample size [3].
At firms like Apex Trader Funding, Topstep, and Take Profit Trader, you’ll need at least 100 trades before your PF becomes a reliable metric. For scalpers taking 20+ trades a day, this often means 500+ trades are required to get consistent data. If your PF is based on just 30–40 trades, it’s probably meaningless noise [3]. These benchmarks show how your trading style impacts the metrics you’ll need to succeed in prop trading.
How Consistency Rules Affect These Metrics
Consistency rules, like the common 50% daily profit cap, are designed to prevent traders from passing evaluations with a single lucky trade. These rules often limit any one trading day to contributing no more than 40%–50% of your total profit target [8]. This forces you to sustain a stable PF across a larger number of trades instead of relying on a single high-volatility session.
If your daily profit contributions are inconsistent, you could fail the evaluation even if you’re technically profitable. For example, a trader with a steady PF of 1.5 over 100+ trades is much more likely to pass than someone with a PF of 0.8 who lucked out on one big day. Firms enforce these rules to weed out traders who use risky tactics like over-leveraging. It’s worth noting that pass rates for evaluations at major firms hover around 9%–20%, with many failures caused by violations of consistency or trailing drawdown rules – not unprofitable strategies [8].
To pass evaluations and keep your funded account, treat consistency rules as a key part of your strategy. Track how much each session contributes to your total profit, consider trading smaller sizes early in the evaluation, and aim for a PF of 1.5 or higher to give yourself a safety buffer [8]. Mastering these consistency requirements will help you use PF and win rate effectively in your trading.
For more details on how different firms handle these metrics, check out our full reviews on DamnPropFirms, including breakdowns for FundedNext Futures, Alpha Futures, and Tradeify.
How to Improve Both Metrics
If you want to level up your profit factor and win rate, you’ve got to focus on two key areas: your risk-reward ratios and your entry/exit timing. These adjustments aren’t just for show – they’re what help you pass those tough prop firm evaluations and keep your funded account alive.
Adjusting Risk-Reward Ratios
Your profit factor gets a serious boost when you weed out bad setups. Before you even think about placing a trade, calculate how far your stop loss is from your target. If the risk-reward ratio isn’t at least 1.5:1, skip it. Why? A 1.5:1 ratio only needs a 40% win rate to break even, while a 2:1 ratio drops that requirement to just 33%[9].
The key here is data. Use your P&L journal to see what’s actually working. Don’t cut winners short because it feels “safe.” For example, if a pattern you trade typically nets $300, don’t settle for $150 just to lock in a quick win. While a 3:1 risk-reward might look good on paper, real-world results often land closer to 1.8 due to slippage and early exits[4]. If your realized risk-reward consistently falls short of your planned ratio, tweak your stops or be pickier about your setups[9]. These small changes can make a big difference in your overall discipline and profitability.
Improving Entry and Exit Timing
Dialing in your timing is just as important as refining your risk-reward ratios. Stick to your stop losses and let your winners hit their targets – it’s simple but effective. Better yet, focus on market conditions that align with your strategy. For example, if you’re a trend trader, you’ll likely see a profit factor of 2.2 in trending markets but drop to 0.7 in choppy conditions[3]. If your win rate tanks during consolidations, consider scaling down your position size or waiting for a better setup[9].
For scalpers, execution quality is everything. Slippage and missed fills can turn a backtested profit factor of 1.8 into a live result of 1.2 or worse. Use limit orders when you can, and keep an eye on your rolling profit factor over the last 50 to 100 trades. This helps you spot performance issues before they spiral[3].
These strategies aren’t just for show – they’re critical for hitting prop firm benchmarks and staying funded. If you want more details on how specific firms handle these metrics, check out our reviews for Apex Trader Funding, Take Profit Trader, and others on DamnPropFirms. Need help tracking your stats? The Consistency Rule Calculator is a great tool to keep you compliant with prop firm rules.
FAQs
What profit factor should I aim for based on my trading style?
A solid profit factor usually falls between 1.3 and 2.0, though this can vary based on your trading style. For scalpers, who rack up a high number of trades, a range of 1.2 to 1.5 is common. Swing traders, aiming for bigger price moves, tend to target a profit factor between 1.5 and 2.5. Make sure your sample size is large enough – anything over 3.0 with fewer than 100 trades might not hold up. Don’t forget to factor in transaction costs and slippage, as they can eat into your results.
How many trades are needed for win rate and profit factor to be meaningful?
Win rate and profit factor start to make sense only after you’ve logged at least 100 trades. Anything less than that is shaky and can swing wildly, giving you a false sense of your performance. For instance, a 60% win rate or a 1.8 profit factor might look solid, but with a small sample size, those numbers don’t hold much weight. As your trade count grows, these metrics settle and give you a clearer picture of your strategy’s reliability.
How do prop firm drawdown and consistency rules affect which metric matters most?
In prop trading, the balance between profit factor and win rate can depend heavily on the firm’s rules, especially around drawdowns and consistency. When you’re dealing with tight drawdown limits, profit factor takes center stage. It shows how well you’re managing your wins versus losses – critical when even a small slip-up can cost you your account. On the other hand, firms that push for frequent, smaller trades might make a high win rate more important. Still, profit factor tends to give a broader picture of your performance, particularly in setups with strict constraints.