Want to trade Nasdaq-100 (NQ) pullbacks with futures prop firms? Here’s the deal: Pullbacks are temporary price reversals in a trending market, offering great entry points if you know what to look for. The goal? Avoid chasing trades after big moves and enter at better prices near support or resistance levels.
Key takeaways:
- Identify the trend: Use tools like the 20 EMA, 50 SMA, and VWAP to confirm market direction.
- Wait for pullbacks: Look for retracements to Fibonacci levels (23.6%-50%) or key moving averages.
- Use confirmation signals: Enter only after price action triggers like engulfing candles or wick rejections.
- Stick to rules: Follow a checklist, manage risk (0.5%-1% per trade), and avoid trading during volatile news events.
Done right, this strategy can help you trade smarter, not harder. Let’s break it down step-by-step. If you need capital to execute this strategy, you can compare the best futures prop firms to find the right funding partner.
NQ Trading Red Day Market Pull Back | VWAP Wave System
sbb-itb-46ae61d
How to Identify the NQ Trend and Market Context
Before jumping into a pullback trade, it’s critical to understand the market’s current direction. Trading against the trend often leads to poor results. Your main objective is to determine if the NQ is trending upward, downward, or moving sideways. Once you’ve identified the trend, you can wait for pullbacks that align with that direction.
Tools for Identifying Trends
Start by analyzing the market structure and adding the 20 EMA and 50 SMA to a 15-minute chart. In an uptrend, you’ll notice higher highs and higher lows, while a downtrend will show lower highs and lower lows [1][4]. These visual cues provide a clear picture of the market’s likely direction. If the price stays above both moving averages, the market is bullish; if it’s below, the market is bearish [2].
Another helpful tool is the VWAP (Volume Weighted Average Price), which reflects institutional sentiment [1][5]. When the price is above the VWAP, it suggests a bullish intraday bias, while a price below indicates bearish sentiment. Many professional traders align the majority of their trades – up to 90% – with the prevailing market bias, avoiding the temptation to pick tops or bottoms [4]. If moving averages appear flat or tangled, it’s a sign the market is ranging, and pullback strategies may not work effectively [2].
For a more detailed analysis, use a multi-timeframe approach. Start with the 15-minute chart to identify the dominant trend, then switch to a 1-minute or 5-minute chart to fine-tune your entries. Focus on value areas like the 20 EMA or VWAP for timing. In strong trends, pullbacks often respect the 20 EMA. For steadier trends, look to the 50 SMA, while in weaker trends, the 200 MA may act as support or resistance [3]. This approach helps you estimate how deep a pullback might go before the trend resumes.
Key Price Levels for Market Context
In addition to trend indicators, key price levels provide valuable insights into the market’s behavior. Each morning, mark the Previous Day High (PDH) and Previous Day Low (PDL) on your chart. These levels often act as magnets, with the price testing them before continuing in the trend’s direction [1][5]. Also, track the Overnight High (ONH) and Overnight Low (ONL), which outline the range established before the high-volume New York session starts at 9:30 AM EST [1][6].
The Opening Range, defined by the first 15 to 30 minutes after the New York open, often sets the tone for the day’s direction [1][5]. Avoid trading during this time; instead, use it to establish your "Initial Balance." Wait for a candle to close outside this range to confirm the market’s direction [6]. Keep an eye out for liquidity sweeps, where the price briefly breaks the PDH or PDL before reversing. Entering on a retest of these levels after a sweep can lead to high-probability setups [5].
| Tool | Purpose | Market Signal |
|---|---|---|
| VWAP | Institutional Bias | Above = Bullish; Below = Bearish |
| 20 EMA | Short-term Momentum | Price near the 20 EMA signals a strong trend |
| 50 SMA | Overall Trend | Indicates the session’s "path of least resistance" |
| PDH / PDL | Liquidity Targets | Breakouts = Expansion; Rejections = Ranging Day |
| ONH / ONL | Overnight Sentiment | Defines pre-market range before NY session |
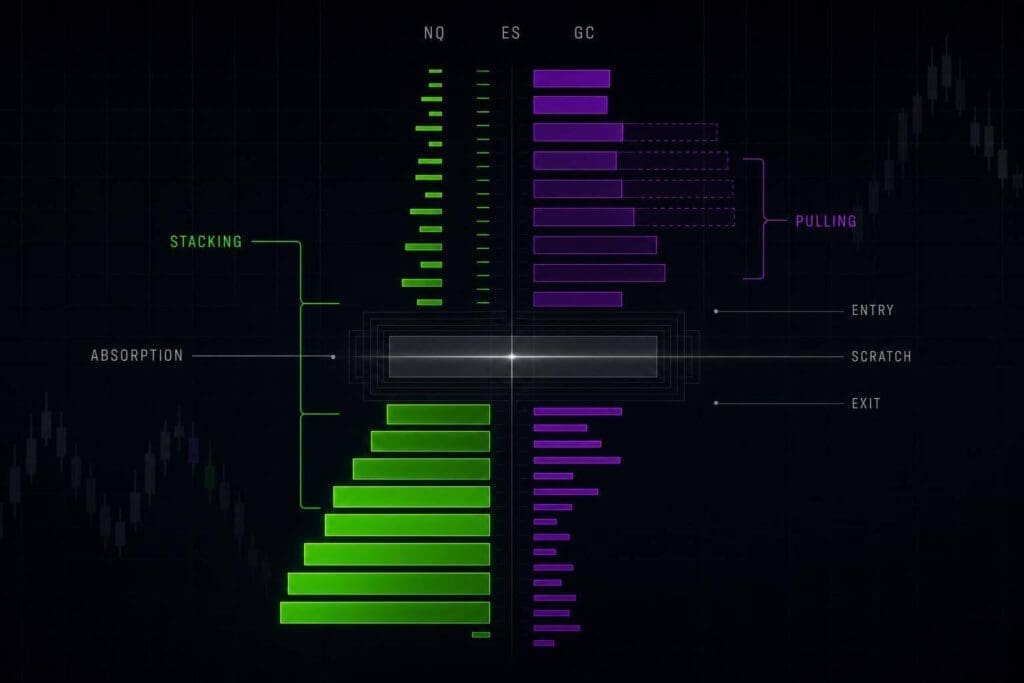
What Makes a Valid NQ Pullback
Valid vs Invalid NQ Pullback Characteristics Comparison Chart
Let’s get into the specifics of what defines a valid pullback in the NQ market. A valid pullback isn’t random; it follows clear, measurable criteria. It happens in a market with a distinct trend, where prices stay aligned with the 20 EMA and 50 SMA. Range-bound conditions? Best to avoid those entirely, as noted in our futures prop firm guides [2].
Pullback Depth and Price Structure
The depth of a pullback gives insight into the trend’s strength. Here’s how it breaks down:
- Shallow pullbacks: These usually retrace to the 23.6% to 38.2% Fibonacci levels, showing strong momentum.
- Moderate pullbacks: These hit the 50% retracement level, often referred to as the "golden" zone for mean reversion [4].
- Deeper pullbacks: These extend to 61.8% or 78.6%, which can indicate a weakening trend, especially near the 50 SMA or a major support level [2][7].
When a pullback retraces more than 50% of the prior impulsive wave, it could signal a trend reversal [7]. For those following Elliott Wave principles, a valid Wave IV pullback in NQ should generally stay above the 50% retracement of Wave III to preserve its impulsive nature [7]. Additionally, in an uptrend, the previous swing low must remain intact – breaking it could invalidate the setup [2].
Volume and location are equally important factors to consider, as they can further validate the strength of a pullback.
Volume and Pullback Location
Volume and where the pullback happens play a big role in determining its reliability. For example:
- Shallow retracements with low volume typically indicate temporary profit-taking, not a full trend reversal [10].
- High-volume clusters at key levels strengthen pullback setups. Data shows that high-volume breakouts (above the 30-day average) have a 66% chance of pulling back, making them appealing for traders [9].
Location also matters. The most reliable pullbacks occur at confluence zones – areas where multiple technical indicators overlap. This could be a Fibonacci level that lines up with the 20 EMA or a prior support/resistance level that coincides with a volume profile node [2][10].
Market analyst Jasper Osita from ACY Securities explains, "The best pullbacks are not guesses – they’re planned reactions to known areas" [2].
On the other hand, pullbacks that happen in "white space" with no previous volume support or structural relevance are risky. These are more likely to continue falling.
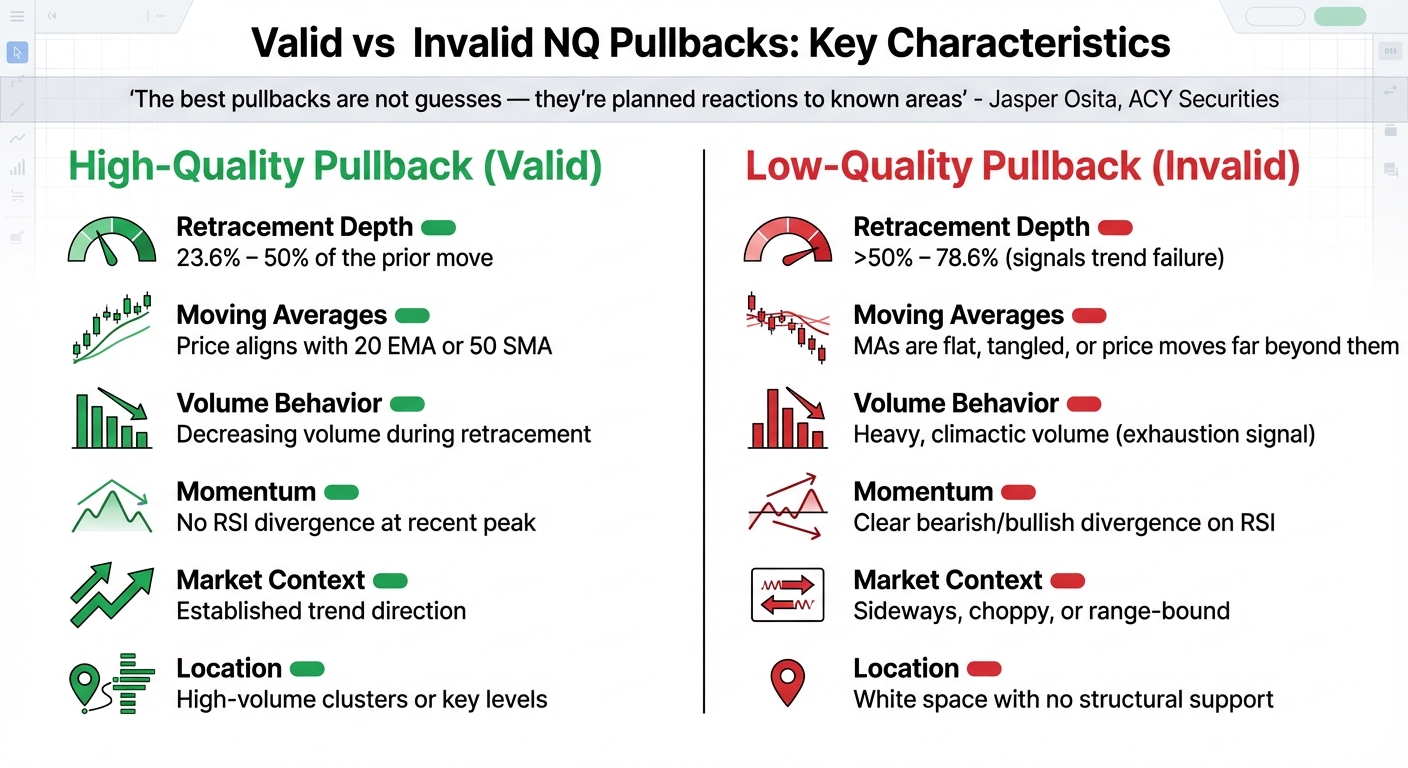
Valid vs. Invalid Pullbacks
Here’s a quick comparison of what separates a high-quality pullback from a low-quality one:
| Feature | High-Quality Pullback (Valid) | Low-Quality Pullback (Invalid) |
|---|---|---|
| Retracement Depth | 23.6% – 50% of the prior move [2][7] | >50% – 78.6% (signals trend failure) [7] |
| Moving Averages | Price aligns with the 20 EMA or 50 SMA [2] | MAs are flat, tangled, or price moves far beyond them [2] |
| Volume Behavior | Decreasing volume during retracement [10] | Heavy, climactic volume (exhaustion signal) [8] |
| Momentum | No RSI divergence at recent peak [7] | Clear bearish/bullish divergence on RSI [7] |
| Market Context | Established trend direction [2] | Sideways, choppy, or range-bound [2] |
| Location | High-volume clusters or key levels [11][12] | White space with no structural support |
4 Rule-Based Entry Setups for NQ Pullbacks
Now that you know what makes a pullback valid, let’s dive into four specific entry strategies you can use consistently. Each method comes with clear rules to ensure disciplined and precise entries. These setups are designed to seamlessly fit within your overall pullback trading approach.
Confirmation Triggers: Regardless of the setup, always wait for confirmation signals such as a bullish or bearish engulfing candle, a wick rejection with a strong close, or a liquidity sweep followed by a market reaction. This approach helps avoid impulsive trades and reduces unnecessary risks.
Moving Average Pullback Entry
The 20-period EMA and 50-period SMA are your tools for this setup, offering two distinct entry opportunities. The 20 EMA is ideal for more aggressive entries, while the 50 SMA works better for deeper pullbacks. For bullish setups, make sure the price stays above the moving averages; for bearish setups, it should remain below. If the moving averages are flat or tangled (common in range-bound markets), it’s best to stay on the sidelines.
Look for confirmation signals like an engulfing candle or wick rejection before entering. During the pullback, you might notice volume contracting, followed by a spike when the trend resumes.
For stop placement:
- With the 20 EMA, use the entry wick or recent swing high/low.
- For the 50 SMA, place stops below the broader swing structure.
To improve your odds, check for confluence, such as alignment with a Fibonacci level (38.2%–61.8%).
"Discipline matters. What you want to do is to have the trade come to you – and not to run after it." – Kyle Maring, HighStrike
Professional traders often focus on high-volume periods, like the first few hours of the U.S. session, and avoid trading right before major economic announcements. This disciplined approach helps prevent chasing trades.
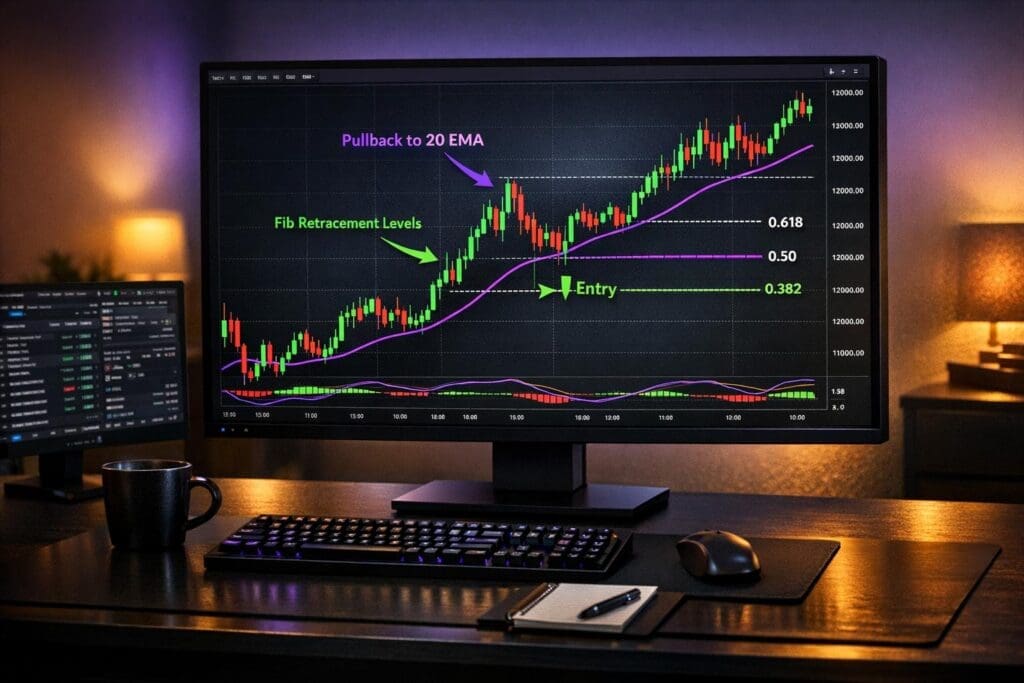
Fibonacci Retracement Entry
Fibonacci retracement levels are powerful tools for identifying key zones where trends are likely to resume. For Nasdaq futures, focus on the 38.2%, 50%, and 61.8% levels. To set up, draw the Fibonacci tool from the most recent swing low to swing high in bullish trends (or swing high to swing low in bearish trends). Shallow pullbacks (38.2%–50%) often signal strong trends, while deeper ones (61.8%–78.6%) may suggest a trend reset.
Only enter after seeing a confirmation trigger. Protect your position by placing stops below the swing low or just beyond the 78.6% level to account for market noise.
"The reason why trading pullbacks is so profitable, is because markets ebb and flow, and a pull back helps you to refine your entry point so that you are entering at or close to the turning point." – Nial Fuller, Professional Trader
For targets, start with the previous swing high or low as your initial take-profit. You can also use Fibonacci extensions like 1.272 or 1.618 for additional targets. In Elliott Wave terms, an NQ "Wave IV" pullback typically ends between the 23.6% and 38.2% retracement levels of Wave III. Keep in mind, if NQ retraces more than 50% of a major move, it often signals the original trend may be over.
Support and Resistance Retest Entry
This method focuses on breakout-then-retest patterns. After price breaks a key level, it often returns to "test" that level before continuing its trend. Look for prior significant peaks and valleys to identify these key levels. This setup works well during breakouts from consolidation patterns like triangles, wedges, or rectangles, or when price breaks a well-defined horizontal level.
Enter only after a candle closes outside the test range to avoid getting caught by erratic wicks. Place your stop-loss just beyond the recent structural low or high to give the trade room to develop.
"High volume breakouts have a tendency to pullback more often than low volume ones." – Thomas Bulkowski, Author
Aggressive traders might enter as soon as the price touches the pullback zone, while conservative traders wait for confirmation, such as a new trend structure forming (e.g., a lower low in a downtrend). This disciplined approach helps avoid chasing trades.
Volume Profile High-Volume Node Entry
Volume Profile tools pinpoint institutional value zones, also known as High-Volume Nodes (HVNs). These levels are particularly effective in trending markets, as they highlight areas of significant liquidity and interest. By avoiding low-volume nodes, you can steer clear of choppy price action.
For example, on the NQ, high-volume clusters (like one near 25,800 in December 2025) often act as defensive zones where buyers or sellers re-enter the market. Before the session begins, map out Points of Interest (POIs) based on order flow analysis to avoid making impulsive decisions during fast market moves. Wait for price action triggers, such as wick rejections or engulfing candles, rather than blindly entering at an HVN.
Set your stop-loss just beyond the high-volume cluster and aim for the next HVN or the edge of a low-volume area as your target. High-probability setups often occur when an HVN aligns with a Fibonacci level (38.2%–61.8%) or a moving average. Unlike support/resistance retests, which rely on psychological price levels, HVN setups are grounded in actual liquidity and volume data.
Pullback Setup Comparison Table
Here’s a quick comparison of the four setups to help you choose the right one for your strategy. The common theme? Always wait for clear, rule-based confirmations.
| Setup Type | Primary Tool | Entry Criteria | Stop Placement | Target Approach |
|---|---|---|---|---|
| Moving Average Pullback | 20 EMA or 50 SMA | Price touches MA plus a confirmation trigger | Below the entry candle’s wick or recent swing low/high | Previous swing high/low |
| Fibonacci Retracement | Fibonacci tool (38.2%–61.8%) | Price reaches the Fib zone with confirmation | Below the swing low or just beyond the 78.6% level | Previous swing high/low (initial), with extensions for longer targets |
| S/R Retest | Horizontal lines, patterns | Price returns to a broken structural level | Beyond the retested structural level | Next structural level or a fixed risk-reward ratio |
| Volume Profile HVN | Volume Profile (HVN) | Price revisits the high-volume cluster | Just beyond the high-volume node | Next HVN or the edge of a low-volume area |
Execution Rules to Stop Chasing Trades
Discipline in trading means sticking to a set of non-negotiable rules before every trade. These rules act as a safeguard, preventing you from impulsively hitting "buy" when the Nasdaq-100 (NQ) is already overextended. By following a structured approach, you allow trades to come to you instead of chasing after them.
Entry Checklists Before Every Trade
A solid checklist can be your best defense against emotional decisions. Think of it as an "IF-THEN" guide. For instance: "IF the price hits the 50 SMA AND forms a bullish engulfing candle, THEN enter long." This kind of logical framework ensures you only act when all conditions align.
Start by identifying the strength of the NQ trend:
- Strong trends respect the 20 EMA.
- Healthy trends hold the 50 SMA.
- Weak trends rely on the 200 MA.
Knowing the trend strength helps pinpoint your "area of value" for the session. Combine this with tools like Fibonacci retracement levels to locate high-probability entry zones, where multiple indicators align.
Before entering any trade, always wait for a price action trigger like a Hammer, Bullish Engulfing, or Pin Bar. These signals confirm the pullback is over. Never enter just because the price touched a level – confirmation is key.
Your checklist should also include account-level safeguards:
- Limit risk per trade to 0.5% of your account equity.
- Set a daily loss cap between 1.5% and 2.0%.
- Stop trading for the day after three consecutive losses.
Preparation is just as important as execution. Before the market opens, spend 15–30 minutes marking key levels like the Prior Day High/Low, VWAP, and Overnight High/Low. This ensures you’re reacting to a plan rather than market noise. Use bracket orders to automate discipline – your stop-loss and take-profit levels are set the moment you enter.
"I turn bullish at the instant my buy stop is hit, and stay bullish until my sell stop is hit. Being bullish and not being long is illogical." – Ed Seykota
These rules help create a disciplined trading framework, ensuring precision in both timing and price.
Time and Price Entry Filters
Once your checklist criteria are met, apply strict time and price filters to refine your entry. Not every pullback is worth trading, so focus on the right areas based on the trend type:
- In strong trends, wait for shallow pullbacks to the 20 EMA (38.2%–50% Fibonacci).
- In healthy trends, target moderate pullbacks to the 50 SMA (50%–61.8% Fibonacci).
- In weak trends, look for deeper pullbacks to the 200 MA (61.8%–78.6% Fibonacci).
If the price doesn’t pull back to your predefined zone, let the trade go. It’s better to miss an opportunity than to chase an overextended move.
Time filters are equally important. Define a specific trading window, such as 9:45 AM–11:30 AM ET, when liquidity and momentum are typically strongest. Once the window closes, stop trading, no matter what the market does afterward. Incorporate a news filter as well: avoid trading within five minutes before or after major events like CPI, NFP, or FOMC announcements to steer clear of unpredictable volatility.
Flat moving averages often signal range-bound conditions, which are unsuitable for pullback strategies. Similarly, in "runaway trends" where NQ keeps climbing without returning to your value area, it’s better to sit out than to chase. Professional traders understand that most trades align with the prevailing market bias, not by trying to predict reversals.
How to Avoid Common Chasing Mistakes
Chasing trades often stems from FOMO (fear of missing out). It’s tempting to jump in when a move feels strong, but this is usually when the market is overextended and primed for a retracement. Instead, wait for the price to reach your predefined area of value and confirm with a trigger signal.
Avoid entering after sharp price moves without any consolidation. When NQ breaks a level vertically, many traders panic and buy the spike – only to watch the market retrace. Instead, wait for a "buildup" at resistance before entering. A patient pullback strategy has historically delivered an average return of 17.53% per year over 24 years, simply by waiting for the right setup.
Another common mistake is moving your stop-loss to breakeven too quickly. Natural pullbacks often revisit the breakout point before resuming the trend, which can trigger your stop prematurely. Give the trade room to breathe. Once you’re in, resist the urge to over-manage. Use the "One Slow Breath" rule: before clicking "buy" or "sell", take a deep breath to reduce stress and ensure every checklist condition is met.
Professional traders prioritize survival over big wins, risking only 0.25%–0.5% per trade during their learning phases. The focus is on staying in the game, not hitting home runs.
| Item | Rule Example | Purpose |
|---|---|---|
| Max Risk per Trade | 0.5% of account | Prevents a single bad trade from causing significant damage |
| Max Daily Loss | 1.5%–2.0% | Caps daily losses to avoid emotional decision-making spirals |
| Entry Confirmation | Bullish Engulfing / Hammer | Confirms momentum is returning before entering a position |
| Trend Filter | Price > 20 EMA & VWAP | Ensures alignment with the dominant market momentum |
| Stop Placement | Below swing low + 2 ticks | Protects against noise while keeping the trade alive |
Risk Management for NQ Pullback Trading
When it comes to pullback trading, sticking to a clear set of rules isn’t just helpful – it’s essential. A strong risk management plan ensures your strategy holds up, especially if you’re trading on funded accounts. Why? Because these accounts have strict limits on drawdowns and demand consistency. To stay within these boundaries, you need to calculate your position size carefully, use stops based on market structure, and keep your losses – both single-trade and cumulative – well under control.
Position Sizing Based on NQ Tick Values
Before jumping into any trade, you need to figure out how many contracts you can trade without exceeding your risk limits. Here’s a simple formula to guide you:
Maximum Contracts = (Dollar Risk Per Trade) ÷ (Stop-Loss Distance in Ticks × Tick Value)
For the E-mini Nasdaq-100 (NQ), each tick is worth $5.00. The Micro E-mini (MNQ), on the other hand, is worth $0.50 per tick, and 1 NQ contract equals 10 MNQ contracts. Let’s break it down with an example: if your risk per trade is $250 and your stop-loss is 20 ticks ($5 per tick), you can trade 2 NQ contracts or 25 MNQ contracts for finer control.
Most traders aim to keep their risk between 0.5% and 1% of their total equity per trade. If your account takes a hit – say it drops by 5% – you might consider cutting your risk to 0.25% per trade to protect your capital. Always determine your stop-loss based on technical levels before calculating position size. Don’t adjust your stop just to fit the contract size you want. And remember, during high-volatility sessions, when the ATR (average true range) is wider, you’ll need to widen your stops and reduce your position size to keep the dollar risk consistent.
Once you’ve nailed down your position size, the next step is placing your stops with precision.
Stop-Loss and Profit Target Placement
When setting your stop-loss, place it slightly beyond the recent swing low (for long trades) or swing high (for shorts), adding a small buffer of 1-2 ticks. For instance, if the swing low is at 16,250.00, you might set your stop at 16,249.50 – just enough to avoid getting caught in minor stop-hunts.
To manage your trade effectively, use bracket orders for both your stop-loss and profit target. Aim for at least a 2:1 reward-to-risk ratio. If you’re risking 20 ticks, target a profit of 40 ticks or more. You can set a conservative profit target at a recent trend extreme or use Fibonacci extensions (like 1.272 or 1.618 levels) to decide on your exit point.
One thing to watch out for is how unrealized trailing drawdown works. Many firms base it on your real-time unrealized equity. This means if you have a big open profit but close the trade at break-even, your drawdown limit could still increase, leaving you with less room to trade. To avoid this, consider taking partial profits once you reach a 1:1 reward-to-risk ratio. Then, move your stop-loss to break-even on the remaining position. This locks in gains and protects you from an unfavorable adjustment to your drawdown limit.
Matching Risk Rules with Prop Firm Requirements
To trade successfully with a prop firm, your strategy needs to align with their rules. These firms enforce strict guidelines to prevent reckless trading. For example, most firms set daily loss limits between 3% and 5% of your account balance. However, many traders prefer to set their own personal cap at around 1.5% to 2% for extra safety. If you face three consecutive losses at 0.5% risk per trade, that 1.5% loss might be your signal to call it a day.
Consistency is another key requirement. Some firms won’t allow any single trading day to account for more than 30% to 40% of your total profits. This discourages traders from going "all-in" on one high-conviction setup. If you’re trading NQ alongside related indices like the S&P 500 (ES), treat them as one risk bucket. For example, if your total risk per trade is 1%, divide it proportionally between the two positions to stay within drawdown limits.
Tools like the Consistency Rule Calculator on DamnPropFirms can help you model various scenarios. By entering details like your account size, risk per trade, and the firm’s rules, you can ensure your pullback strategy stays compliant with scaling targets and drawdown thresholds.
Prop Firm Risk Rules Table
| Rule Type | Common Prop Firm Requirement | Pullback Strategy Adaptation |
|---|---|---|
| Daily Loss Limit | 3% – 5% of account balance | Set a personal cap at 1.5% – 2% to avoid breaching firm rules. |
| Max Drawdown | Trailing (based on unrealized P&L) | Use trailing stops or scale out at 1:1 reward-to-risk to secure a protective "floor." |
| Consistency Rule | No single trade >30-40% of total profit | Maintain steady position sizing and avoid "all-in" trades on high-conviction setups. |
| Position Limits | Max contracts (e.g., 5 NQ or 50 MNQ) | Use MNQ contracts for more precise risk control when wider stops are needed. |
| Scaling Plan | Increase size as balance grows | Only increase position size after building a 2-3% profit buffer above the trailing limit. |
Prop firms may have different sets of rules, but the main takeaway is always the same: protect your downside first, and then focus on growing your account.
Conclusion
Trading NQ pullbacks effectively demands a combination of discipline, structure, and patience. Start by identifying the trend with tools like the 20 EMA and 50 SMA, then wait for the price to retreat to a confluence zone – a spot where Fibonacci levels, moving averages, or VWAP align. Once you’ve pinpointed this zone, look for a clear price action trigger, such as a bullish engulfing candle or wick rejection, before committing to a trade. This methodical approach lays the groundwork for the rule-based setups outlined earlier.
The key to successful pullback trading lies in sticking to a plan when price reaches these confluence zones [2].
The four strategies – moving average pullbacks, Fibonacci retracements, support/resistance retests, and volume profile entries – offer a repeatable, systematic approach to trading. By incorporating execution filters, such as trading during the NY Open (9:30–11:00 AM EST) and using bracket orders with pre-set stops and targets, you create a framework designed to minimize emotional decisions [1][13].
To complete your trading framework, disciplined risk management is essential. This includes setting firm position sizes, placing stops beyond key swing levels, and maintaining a reward-to-risk ratio of at least 2:1.
"The goal is not to trade more. The goal is to trade better." – Joshua Soriano, Quant Matter [13]
FAQs
What are the best indicators to confirm the trend in the Nasdaq futures (NQ) market?
Traders looking to confirm trends in the Nasdaq futures (NQ) market often turn to a mix of technical tools. Popular choices include moving averages like the 50-EMA or VWAP, Fibonacci retracement levels, and clear market structure signals such as higher highs or higher lows. These indicators help paint a clearer picture of whether the market is moving up or down.
To strengthen their analysis, many also incorporate volume profiles and momentum indicators like the RSI or divergence signals. These tools shed light on the trend’s strength or weakness, offering additional layers of confirmation. By combining these strategies, traders can make more calculated decisions and steer clear of rash, emotion-driven trades.
How can I tell if a pullback is valid or likely to fail?
To spot a valid pullback, you’ll want to ensure it aligns with the current trend and respects key technical levels. Start by checking if the price remains on the correct side of the moving average – for example, above the 20- or 50-period moving average during an uptrend. Additionally, the price should retrace to a Fibonacci zone between 38.2% and 61.8% of the previous move. If the retracement goes beyond 78%, it might indicate a weakening trend or even a potential reversal.
Next, verify that the pullback respects higher time-frame support or resistance zones, such as those identified on a 60-minute chart. An oscillator can provide further confirmation; for instance, a stochastic indicator dipping into oversold (or overbought) territory and then crossing back suggests the pullback could be profit-taking rather than a structural shift in the trend.
Pay attention to clean price action as well. A valid pullback shouldn’t break recent swing highs or lows, should display normal or slightly elevated volume without sudden spikes, and must not show bearish divergence on momentum indicators. If all these elements are in place, the pullback is likely legitimate. Otherwise, it could signal a trend reversal rather than a continuation.
What are the best risk management techniques for trading NQ pullbacks?
To trade NQ pullbacks successfully, start by setting a hard stop-loss at important technical levels. These could be just below the swing low, the 61.8% Fibonacci retracement, or a moving average support zone. This step isn’t just about limiting losses – it also gives you a clear framework for setting a reward-to-risk ratio. Aim for at least a 2:1 ratio to ensure the potential reward outweighs the risk.
Keep your position size manageable, risking no more than 1%–2% of your account balance on any single trade. This approach protects your capital, ensuring that one bad trade doesn’t cause significant damage. Pair your stop-loss with specific profit targets – like the next resistance level or a previous high. You might also want to use a trailing stop to secure profits as the trade moves in your favor.
Don’t forget to account for your prop firm’s drawdown rules, especially if they use a trailing drawdown that adjusts with equity highs. Keep a close eye on your real-time equity, and be ready to tighten stops or exit trades if necessary to stay within those limits. By combining disciplined stop-losses, careful position sizing, and an understanding of drawdown mechanics, you can approach NQ pullbacks with confidence while keeping risk under control.