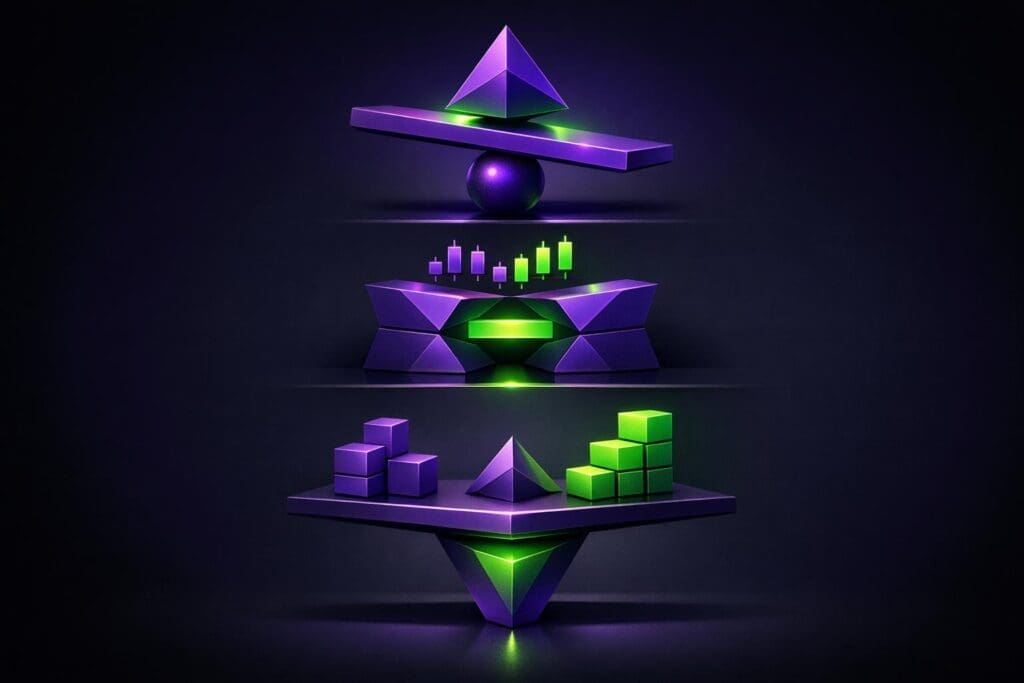
Trading Nasdaq futures (NQ) effectively boils down to understanding three key intraday market structures: Mid-Structure Pivot, Upper Structure Rotation, and Lower Structure Support. These structures help traders identify critical decision zones, manage risk, and align with market trends. Here’s the short version:
- Mid-Structure Pivot: Acts as the market’s balance point. Use tools like Volume Profile, VWAP, and Market Profile to spot this zone. It’s where price acceptance or rejection defines the next move.
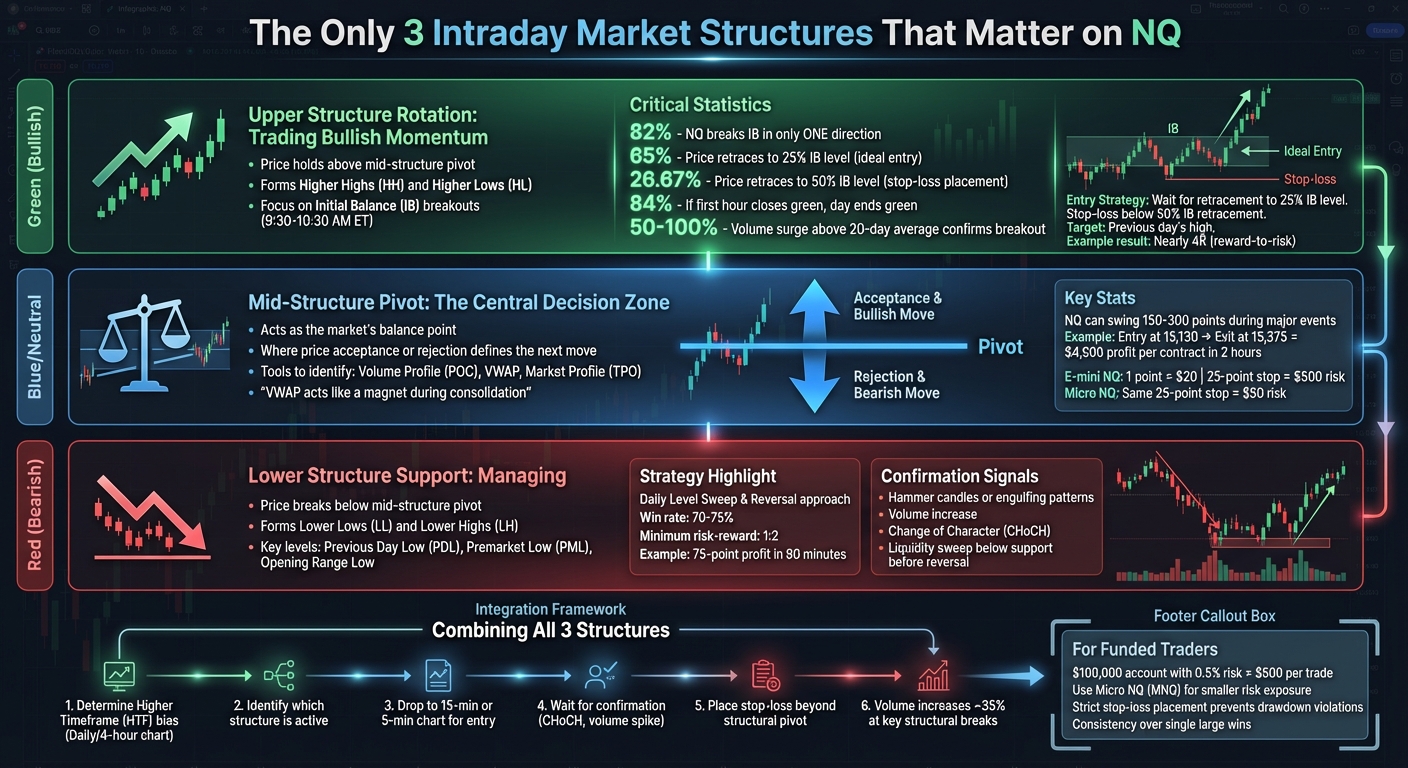
- Upper Structure Rotation: Signals bullish momentum when price holds above the pivot. Look for patterns like Higher Highs and retracements to the 25% Initial Balance (IB) level for high-probability entries.
- Lower Structure Support: Indicates bearish trends when price breaks below the pivot. Focus on support zones like the Previous Day Low (PDL) and use confirmation patterns like hammer candles or liquidity sweeps before entering trades.
These structures simplify decision-making, reduce impulsive trades, and help funded traders stay within strict risk limits. Whether you’re trading with a $100,000 account or managing micro contracts, mastering these levels ensures you trade with precision and discipline.
3 Key Intraday Market Structures for Trading Nasdaq NQ Futures
INTRADAY MARKET STRUCTURE PREVIEW | ES/NQ Analysis
Mid-Structure Pivot: The Central Decision Zone
The mid-structure pivot is where the market’s intentions come into focus. It’s the balance point where buyers and sellers converge, and the price either gains acceptance and moves forward or faces rejection and reverses. This zone reflects the market’s "fair price" – the level where the most contracts are traded and activity peaks. For traders working within tight drawdown limits, this is the crucial zone that determines whether you’re moving with the market or against it. Let’s break down how to identify this pivotal area using key trading tools.
How to Spot the Mid-Structure Pivot in Real Time
To locate the pivot, focus on three essential tools: Volume Profile, VWAP, and Market Profile.
- Volume Profile pinpoints the Point of Control (POC) – the price level with the highest trading activity, serving as your balance point.
- VWAP (Volume Weighted Average Price) acts as a real-time benchmark often used by institutions. During consolidations, price tends to gravitate back to VWAP, making it a critical tool.
- Market Profile (TPO) adds a time element, showing where the market spends the most time and highlighting areas of acceptance.
"VWAP can act like a magnet during consolidation, and price often reverts to VWAP if it gets too far from it." – MetroTrade
On instruments like the NQ (Nasdaq futures), which can swing 150–300 points during major events, accurately identifying this pivot is essential. A strong signal occurs when the POC and VWAP align – this is your central decision zone.
Reading Acceptance vs. Rejection Scenarios
Acceptance happens when the price holds steadily above or below the pivot with rising volume and minimal sharp reversals. This shows the market is "comfortable" at that price level, often a sign the trend will continue.
On the other hand, rejection is marked by sharp reversals, visible long wicks on candles, and repeated tests of the pivot that fail to hold. This signals a shift in sentiment and can act as an early warning.
For example, in August 2023, a trader spotted a long opportunity on a 15-minute NQ chart after weak employment data. The entry at 9:50 AM at 15,130 followed the price being accepted above the mid-structure pivot. The trade closed at 11:50 AM at 15,375, yielding a $4,900 profit per contract in just two hours.
Mastering these scenarios is a must for traders looking to apply pivot strategies effectively in funded accounts.
Using the Mid-Structure Pivot in Funded Accounts
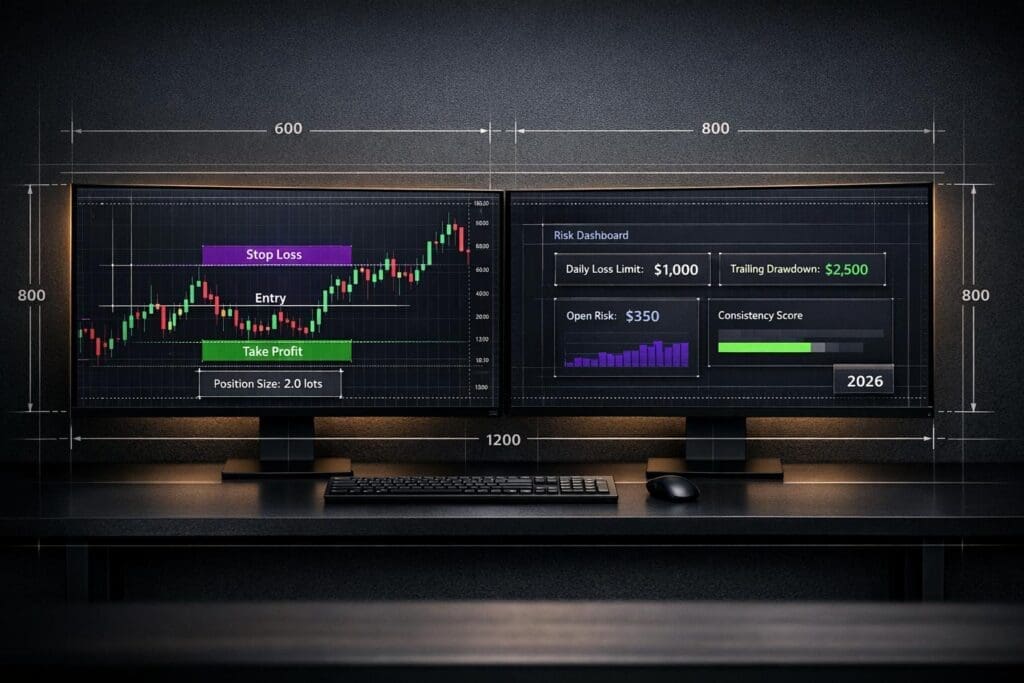
For traders using funded accounts, the mid-structure pivot can be a game-changer for precise entries and disciplined risk management. On the E-mini NQ, a single tick (0.25 points) equals $5, and one full point equals $20. A 25-point stop-loss on one contract risks $500. In a $100,000 account with a 0.5% risk per trade, this stop could use your entire risk allocation. By trading MNQ (Micro NQ), you could apply the same 25-point stop with a $50 risk instead of $500, allowing more flexibility without hitting drawdown limits.
To time your entries, wait for price to approach the POC or VWAP, then confirm the direction with a confirmation candle – one that closes at least halfway above or below the 9-period EMA. Checking higher timeframes, like the 1-hour or 4-hour charts, can also help you align with the broader trend and avoid getting caught in whipsaws. Finally, use the ATR (Average True Range) to determine your stop-loss placement. Set it beyond the pivot’s rejection zone rather than relying on arbitrary dollar amounts, which ensures your strategy accounts for NQ’s inherent volatility.
Upper Structure Rotation: Trading Bullish Momentum
Once the price pushes past the mid-structure pivot and holds above it, you’re entering the upper structure rotation phase. This is where bullish momentum takes over, and the market starts forming a pattern of Higher Highs (HH) and Higher Lows (HL). The key here is to spot when buyers are firmly in control and use that insight to time your entries – without falling into the trap of chasing the move. This phase naturally extends the directional bias established at the mid-structure pivot.
Identifying Upper Micro-Structures on NQ Charts
The Initial Balance (IB), defined as the range the Nasdaq (NQ) forms between 9:30 AM and 10:30 AM ET, is the first signal to monitor. When the price breaks above the IB high, it signals the market’s first strong commitment for the day. Here’s a compelling stat: 82% of the time, NQ breaks the IB in only one direction, meaning once the high is cleared, it’s unlikely the price will revisit the IB low during the same session.
Instead of jumping in immediately, wait for a retracement to the 25% level of the IB range. This happens in 65% of cases, offering a high-probability entry point. For comparison, the price only retraces to the 50% level 26.67% of the time, which makes it a logical spot for placing your stop-loss.
Another tool to confirm the trend is the Opening Candle Continuation (OCC). If the first hour (9:30–10:30 AM ET) closes green, there’s an 84% chance the day will also end with a green close. This provides additional confidence in the breakout. These methods allow you to extend pivot concepts into dynamic trend scenarios on NQ.
Once the breakout is confirmed, the focus shifts to fine-tuning momentum and entry timing.
Confirming Momentum and Timing Entries
Momentum isn’t just about upward price movement – it’s about the quality of that movement. A valid breakout is often accompanied by a volume surge of 50–100% above the 20-day average. Without this volume spike, the breakout could be nothing more than a trap.
"A Break of Structure isn’t just a random price move; it’s a validation of momentum." – Colibri Trader
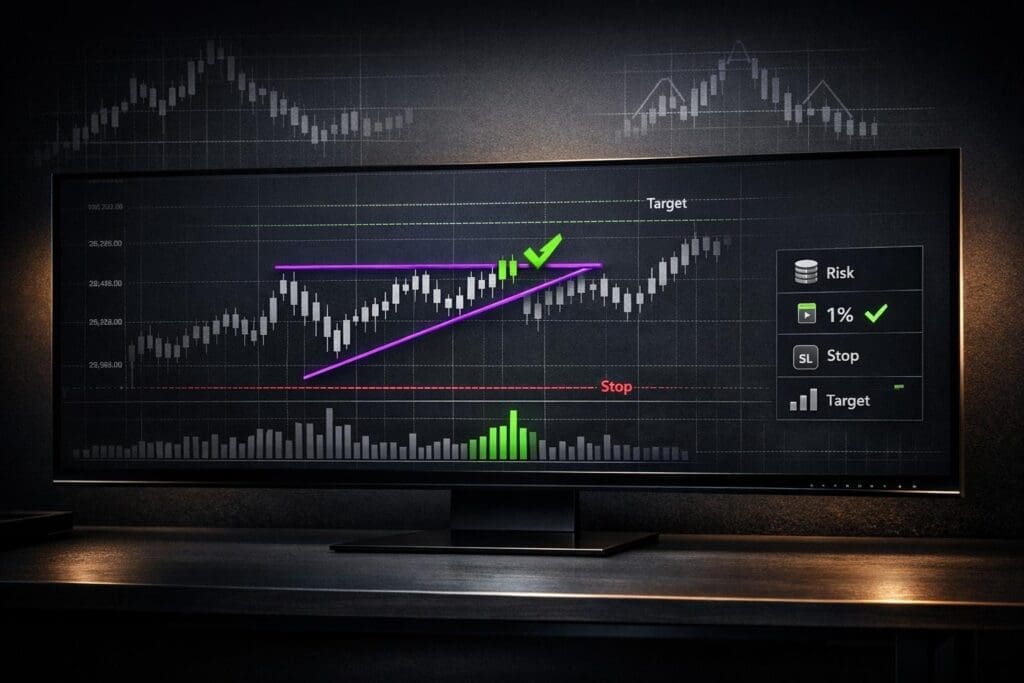
For confirmation, wait for a candle body close above the IB high. Wicks can be deceptive and are often used to lure traders into bad positions. A solid candle body close indicates buyer commitment. Once confirmed, set your limit order at the 25% retracement level and place your stop just below the 50% retracement of the IB range.
Take February 5, 2025, as an example. On this day, NQ opened within the previous session’s range and printed a green first-hour candle. At 11:05 AM, the price broke above the IB high. Traders who entered at the 25% retracement level, with a stop below the 50% level, targeted the prior session’s high. This setup delivered a nearly 4R (reward-to-risk) result.
Position Sizing and Risk Management for Funded Traders
Once your entry signals are confirmed, managing risk becomes the priority. Use the 50% IB retracement level as your stop-loss anchor. Since the price only revisits this level about 25% of the time on successful breakout days, this stop gives the trade room to breathe while minimizing potential losses.
For position sizing, calculate your risk based on the distance between your entry and stop. For instance, if you’re trading a $100,000 account with a 0.5% risk rule, you would risk $500 per trade. On the E-mini NQ, a 25-point stop translates to $500 because each point is worth $20. If you want to risk less, you can trade Micro NQ (MNQ), where a 25-point stop would only cost $50.
Your main profit target should be the previous day’s high, a level that institutional traders often monitor and one supported by OCC statistics. If the trade moves strongly in your favor and you’re up 2R or more, consider scaling out of half your position and letting the rest ride with a trailing stop.
"Trade with the trend. In an uptrend, buy the pullback; in a downtrend, sell the rally." – Colibri Trader
Lastly, always keep an eye on the bigger picture. If the 4-hour or Daily chart is trending downward, your bullish setup on a 15-minute chart might be going against the grain. Aligning your intraday trades with the broader trend helps you avoid unnecessary risks and keeps your capital intact.
Lower Structure Support: Managing Bearish Pressure
When the price breaks below the mid-structure pivot, it often signals a move toward lower structure support, a key area where bearish momentum meets potential buying interest. This is where the market forms Lower Lows (LL) and Lower Highs (LH) – patterns that can help traders identify when sellers might lose control or when a reversal could take shape. Understanding these support zones is just as important as spotting bullish structures, especially for traders aiming to maintain discipline. Unlike riding upward momentum, trading within lower structures demands patience and precision. This is particularly true for funded accounts, where even a single bad trade could breach drawdown limits.
Identifying Key Lower Structure Levels
To pinpoint crucial support zones, start with the Previous Day Low (PDL) and Premarket Low (PML). These levels often act as institutional liquidity pools, areas where large pending orders may sit, waiting to be executed. Between the Previous Day High (PDH) and the PML, you’ll typically find a "No Trade Zone" (NTZ) – a range of indecision where entering trades is risky and generally discouraged.
Another critical level is the Opening Range Low, established between 9:30 AM and 10:30 AM ET. A break below this threshold often signals a bearish trend day. To add further confirmation, use Floor Trader Pivots (S1, S2, S3), which are calculated from the prior day’s high, low, and close. These pivot levels frequently act as either reversal points or continuation targets.
Additionally, keep an eye on Order Blocks (OB) and Fair Value Gaps (FVG). An Order Block refers to the last bearish candle before a strong upward move, often marking areas where institutions placed significant buy orders. Fair Value Gaps, on the other hand, are temporary price imbalances that markets tend to revisit.
Another pattern to watch for is a liquidity sweep – a moment when the price briefly dips below a known support level (like the PDL) to trigger retail stop-losses before reversing sharply. This tactic is frequently used by institutions to gain liquidity.
"Retail traders aren’t losing because they lack skill – they’re losing because they’re fighting a war they don’t even know exists." – Steady Turtle Trading
Once you’ve identified these levels, the next step is crafting a precise entry plan.
Trading Approaches at Support Zones
Don’t rush to "catch a falling knife." Instead, wait for confirmation before entering a trade. Look for bullish reversal patterns, such as hammer candles or engulfing candles, supported by an increase in trading volume.
One effective strategy is the Daily Level Sweep & Reversal. For instance, in June 2025, NQ futures dropped to 15,040, sweeping the daily low of 15,070 to trigger liquidity grabs. The price then reclaimed 15,080, providing a long entry opportunity at 15,075 with a stop at 15,050. This trade delivered a 75-point profit in just 90 minutes, with a win rate of 70–75% and a minimum 1:2 risk-reward ratio.
Before entering, confirm a Change of Character (CHoCH) – a signal that the bearish trend may be reversing. For example, if the price fails to form a new lower low, it could indicate a potential shift in momentum. Use multi-timeframe analysis for added confidence. A bearish retest on a 5-minute chart, for instance, is more reliable when it aligns with support levels on a higher timeframe. Place stop-losses 10–20 points beyond the recent swing low to account for normal market fluctuations while protecting your trade. Ideally, enter near the support level after observing a clear rejection candle.
Once a reversal is evident, enforce strict stop-loss rules to align with the risk parameters of funded accounts.
Managing Risk Within Prop Firm Requirements
Prop firms impose strict daily loss and overall drawdown limits, making precise risk management essential. Identifying lower structure support helps you place stop-losses just beyond invalidation points, minimizing the risk of exceeding these limits. Stick to your risk management plan and adjust position sizes based on the distance to your stop-loss.
For example, in a $100,000 account risking 0.5% per trade ($500), a 20-point stop on E-mini NQ (with each point worth $20) would risk $400, while the same stop on MNQ would only risk $40.
Consider using ATR-based stops, which adjust to current market volatility. This approach reduces the likelihood of being stopped out by normal price swings, providing more flexibility in volatile conditions.
"No strategy survives without risk controls." – Colibri Trader
Avoid entering trades on the initial break of a support level. Instead, wait for the price to return and show clear rejection – a critical "Battle Zone" where buyers and sellers vie for control. This method increases the probability of entering a successful trade with a favorable risk-to-reward ratio, a key component for maintaining consistency in funded accounts.
sbb-itb-46ae61d
Combining the 3 Structures into Your NQ Trading Plan
To effectively integrate the three structures into your Nasdaq (NQ) trading plan, start by determining your higher timeframe (HTF) bias using the Daily or 4-hour chart. This step is crucial – it sets the foundation for every trade. Analyze whether NQ is in an uptrend (upper structure), downtrend (lower structure), or consolidation (mid-structure). Once your HTF bias is clear, shift to the lower timeframes to identify precise entry and exit points.
From there, focus on high-probability zones like order blocks or fair value gaps that align with your HTF bias. For example, if the Daily chart indicates a bullish trend, look for pullbacks to support zones where you can open long positions. Then, drop down to a 15- or 5-minute chart and wait for a confirmed Change of Character (CHoCH) before entering the trade. This top-down method eliminates guesswork and ensures your trades align with institutional trends.
Volume analysis is critical. When price breaks key structural levels, trading volume often increases by about 35%, signaling institutional activity. Institutions frequently manipulate price to trigger retail stop-losses by briefly pushing price beyond key levels before reversing sharply. Recognizing these traps can help you avoid being caught on the wrong side of the move. Use volume signals to validate structural levels and place your stop-losses just outside the HTF order block or structural pivot. This approach protects against stop hunts while giving your trade room to develop.
Acceptance vs. Rejection Outcomes Across Timeframes
The table below illustrates how different structural scenarios unfold across timeframes and informs your trade decisions:
| Structure Scenario | Daily Chart Impact (HTF) | 15-Minute Chart Action (LTF) | Trade Decision |
|---|---|---|---|
| Acceptance (Upper) | Candle closes above previous high, confirming bullish bias. | Consolidation above resistance; forms new higher lows. | Long: Enter on pullbacks to new support. |
| Rejection (Upper) | Long upper wick at resistance, signaling smart money selling. | CHoCH: Price breaks below the most recent 15m higher low. | Short/Exit: Take profits or prepare for a reversal. |
| Acceptance (Mid) | Price remains within the prior day’s range, indicating a choppy market. | Price oscillates between horizontal support and resistance. | Range Trade: Buy support, sell resistance, or stay flat. |
| Acceptance (Lower) | Candle closes below the previous low, confirming bearish bias. | Consolidation below support; forms new lower highs. | Short: Enter on rallies to new resistance. |
| Rejection (Lower) | Long lower wick signals a liquidity grab or buying interest. | CHoCH: Price breaks above the most recent 15m lower high. | Long/Exit: Target mean reversion back to the mid-pivot. |
Building a Daily Trading Routine
A structured daily routine is essential for disciplined trading. Begin by marking the Previous Day High (PDH), Previous Day Low (PDL), and the midpoint between them. These levels establish your initial structural framework. Combine these levels with your HTF bias and structural zones to reinforce your entry and exit strategies.
Pay special attention to the opening and closing trading hours (9:30–10:30 AM ET and 3:30–4:00 PM ET), as these times often see peak volatility and clear structural movements. During the opening hour, watch for the "Opening Rip", which can serve as an early momentum indicator.
Avoid jumping into trades the moment price touches a structural zone. Instead, wait for confirmation – such as a candle body closing beyond the level, a CHoCH on lower timeframes, or a volume spike indicating institutional involvement. Use ATR-based stop-losses to adapt to current volatility, ensuring disciplined risk management. For funded accounts, this level of discipline is critical, as prop firms enforce strict daily loss limits. A single impulsive trade could breach your drawdown threshold.
Finally, remember that market structure is fractal. The same patterns – higher highs, lower lows, and breaks of structure – repeat across all timeframes, from 1-minute charts to monthly charts. Whether you’re scalping on a 5-minute chart or swing trading on a Daily chart, the three-structure framework applies universally. Stick to your routine, confirm setups, and let market structures guide your decisions. Consistency is the key to long-term success.
Resources for NQ Traders at DamnPropFirms

Verified Reviews of Top Futures Prop Firms
DamnPropFirms offers detailed reviews of leading NQ futures prop firms like Apex Trader Funding, Take Profit Trader, and FundedNext Futures. These reviews cover essential aspects such as drawdown types, platform compatibility, and profit splits – key considerations for navigating the high-volatility nature of NQ trading.
For instance, Take Profit Trader, which boasts a 4.4/5 rating on Trustpilot from 7,614 reviews, offers flexible payout structures. However, only 20.37% of its registered users successfully passed their evaluation between January and August 2023. This statistic underscores the importance of a disciplined and structured trading strategy. Additionally, the reviews delve into NQ’s Average True Range, which was approximately 250 points in Q1 2024. These insights and tools are designed to equip traders with the knowledge they need to approach NQ trading with precision and discipline.
Trading Tools and Calculators
To complement their reviews, DamnPropFirms provides essential tools tailored for NQ traders. Two standout tools include the Consistency Rule Calculator and TradeSyncer, both designed to simplify and enhance the trading process.
The Consistency Rule Calculator is invaluable for traders navigating evaluation phases. It ensures profits are steady and not overly reliant on a single large trade. This is particularly important for NQ trading, where a single 160-point move could yield $3,200 per contract but might violate consistency requirements if it skews the overall profit curve. This tool helps reinforce the disciplined trading approach critical for success.
The TradeSyncer tool allows traders to mirror trades across up to 20 funded accounts. Given that a single NQ contract carries a notional value of about $354,000 (based on an index price of 17,700), this feature helps traders spread their strategies across multiple accounts. By doing so, they can scale their capital while staying within each firm’s daily loss limits.
"With certain proprietary firms offering traders up to 20 accounts with them, where they can mirror their trades to spread across all of the accounts" – Faisal from TRADEPRO Academy
This approach is particularly useful for NQ traders managing 20–25 point stop-losses, which translates to roughly $400–$500 risk per E-mini contract. It allows traders to stay within drawdown limits while maintaining a disciplined and calculated approach.
Conclusion
Mastering the Mid-Structure Pivot, Upper Structure Rotation, and Lower Structure Support simplifies your NQ trading process. These three structural levels help answer the key question every trader faces: Is the market accepting or rejecting this level? Without these, you’re essentially trading without direction.
As Justin Trading puts it, understanding market structure boils down to interpreting price action through its highs, lows, and ranges. By aligning your entries with these structural levels, you’re effectively syncing your trades with institutional activity.
For funded traders, this approach is a game-changer. Prop firms prioritize consistency and discipline, and this framework naturally encourages both. When your decisions are rooted in objective structural analysis rather than emotional impulses, you’re better equipped to meet the strict risk guidelines set by these firms. Placing stop-losses beyond key swing points helps you stay within daily loss limits, while waiting for confirmation at critical zones minimizes impulsive trades that could jeopardize your account.
FAQs
What are the best tools for spotting the Mid-Structure Pivot in real-time?
To spot the Mid-Structure Pivot in real-time, you’ll need a mix of effective tools and straightforward techniques:
- Real-time charting platforms: Platforms like NinjaTrader or TradingView equipped with pivot detection scripts can mark critical points as they emerge, giving you immediate visual feedback.
- Order flow and volume tools: Tools such as depth-of-market displays or volume heatmaps help verify if buying or selling pressure is supporting the pivot.
- Momentum indicators: Indicators like Bollinger Bands or RSI add another layer of confirmation, signaling when the market is ready for a potential pivot.
By leveraging these tools together, you can quickly identify pivots and make well-informed trading decisions tailored to your approach.
How can traders manage risk effectively during an Upper Structure Rotation?
To navigate risk during an Upper Structure Rotation, it’s crucial to align trades with the current market structure and stick to a disciplined risk management plan. Begin by pinpointing the new swing high that marks the upper structure. Set your stop-loss just below the most recent swing low or the nearest structural support zone, ensuring your risk is tied to a logical price level.
Keep your risk per trade minimal – many traders adhere to the "3-5-7" rule: risk no more than 3% of your account balance on a single trade, limit total exposure across all trades to 5%, and aim for at least a 7% return on winning trades. This combination of structure-based stop-loss placement and strict risk limits helps you stay within prop-firm drawdown requirements while optimizing your profit potential.
What are the best strategies for trading around Lower Structure Support in Nasdaq futures?
Trading around Lower Structure Support means treating this area as a potential "price floor" where buyers might step in to counter selling pressure. To begin, pinpoint a clear support level – this could be a flat swing low or a series of higher lows where the market has previously shown resilience against declines. When the price revisits this zone, look for confirmation signals like bullish candlestick patterns (e.g., pin bars or engulfing candles) and signs of buying interest, such as an uptick in volume.
Here’s a straightforward approach to refine your trade selection:
- Market Sentiment: Check for signs of seller fatigue, such as an RSI dipping below 30 or price pushing beyond Bollinger Bands.
- Structure: Confirm that the price is interacting closely with the identified support level.
- Momentum Shift: Look for reduced selling pressure or early signs of buying strength before committing to the trade.
When setting your stop-loss, position it just below the support level. Aim for a reward-to-risk ratio of at least 2:1 by targeting the next resistance zone or a significant midpoint within the previous range. Another promising setup to watch for is the Failed Breakdown – this occurs when the price briefly dips below support but quickly rebounds, forming a higher low. When paired with confirming order flow signals, this can offer a compelling entry point.