Understanding Volume Nodes and Value Areas is key for futures traders aiming to refine their strategies. Both tools analyze trading volume but serve different purposes:
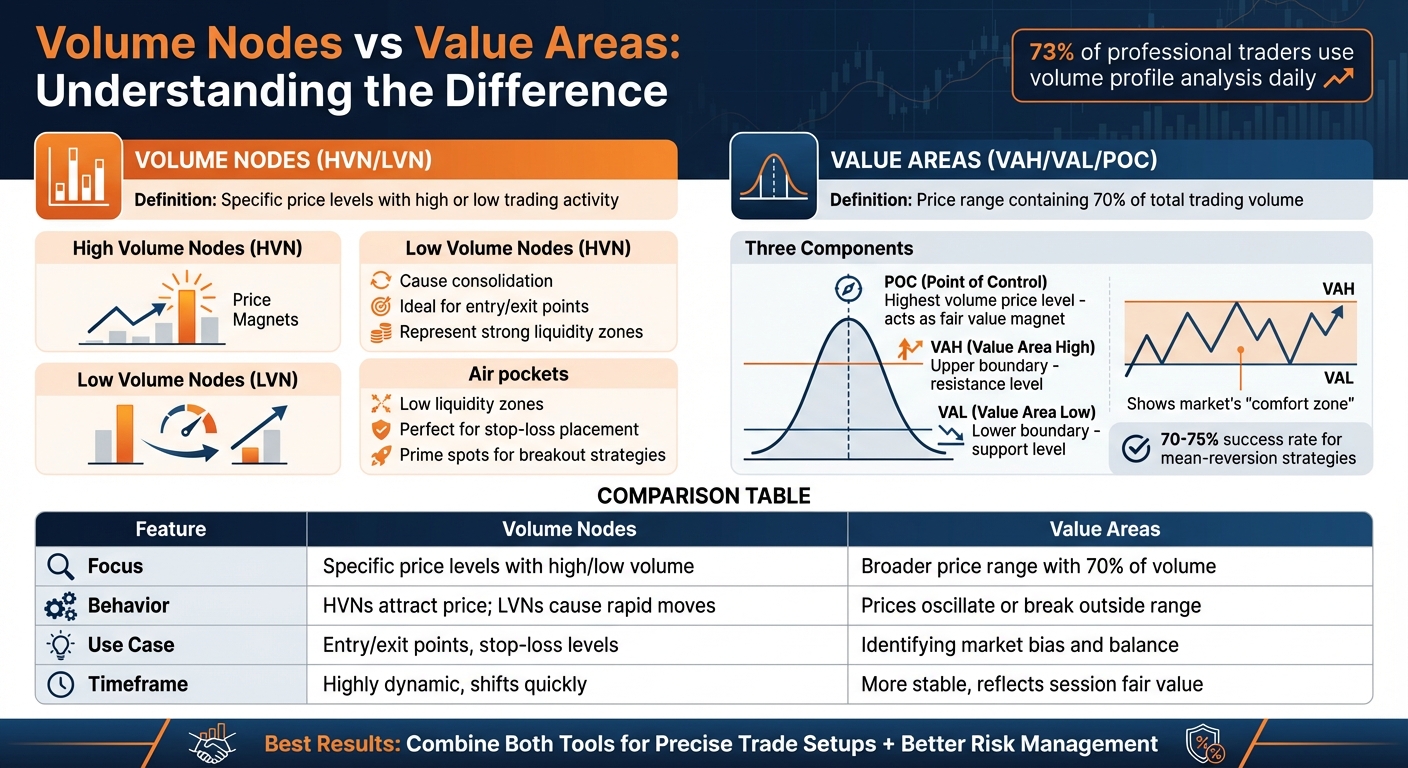
- Volume Nodes focus on specific price levels with high (HVN) or low (LVN) trading activity. HVNs act as price magnets, while LVNs highlight areas where prices move quickly due to low liquidity.
- Value Areas represent the price range (70% of total trading volume) where the market sees fair value. Key levels include the Point of Control (POC), Value Area High (VAH), and Value Area Low (VAL), which help identify support, resistance, and market balance.
Key Takeaways:
- HVNs are ideal for entry/exit points, while LVNs are useful for spotting breakout zones.
- Value Areas provide a broader market view, showing where most trading occurs.
- Combining both tools offers precise trade setups and better risk management.
Quick Comparison:
| Feature | Volume Nodes (HVN/LVN) | Value Areas (VAH/VAL) |
|---|---|---|
| Focus | Specific price levels with high/low volume | Broader price range with 70% of volume |
| Behavior | HVNs attract price; LVNs cause rapid moves | Prices oscillate or break outside range |
| Use | Entry/exit points, stop-loss levels | Identifying market bias and balance |
Using these tools together can help you navigate market trends, avoid false breakouts, and optimize trade timing. These techniques are fundamental for consistent day trading success. Platforms like NinjaTrader and TradingView provide built-in tools for volume analysis, making them essential for futures trading.
Volume Nodes vs Value Areas: Key Differences for Futures Traders
VOLUME PROFILE: The Ultimate Day Trading Guide (Full Training – Chapters 1–10)
sbb-itb-46ae61d
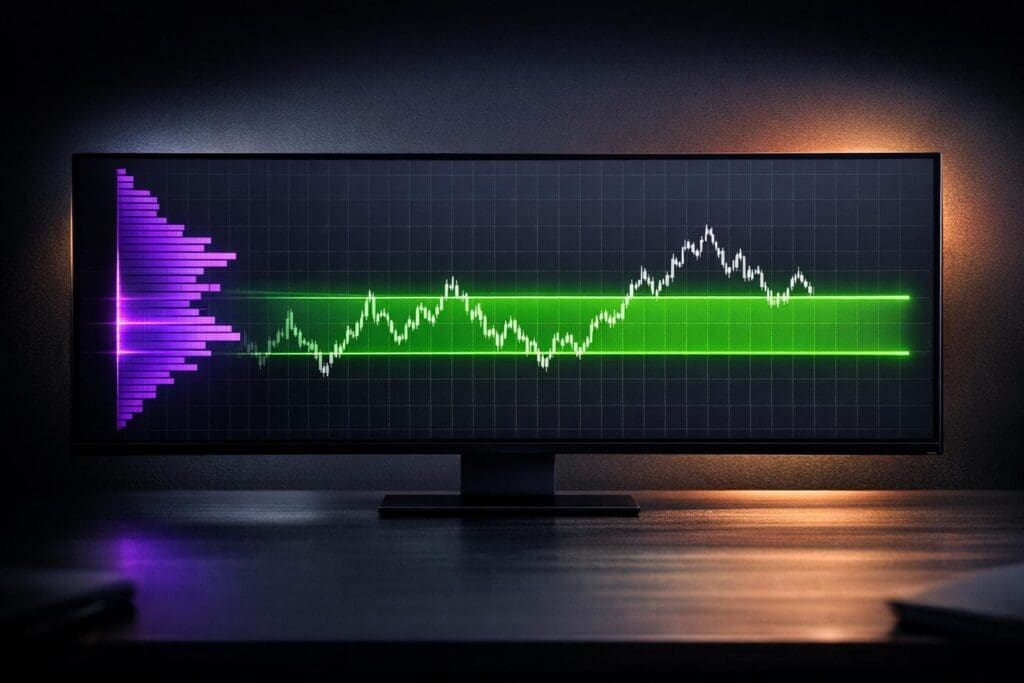
What Are Volume Nodes?
Volume Nodes are key price levels on a volume profile chart that show where trading activity was either concentrated or sparse. Think of them as horizontal bars: the longer the bar, the higher the trading volume at that price level. These nodes essentially reveal where the market’s attention has been focused.
A volume profile itself is a horizontal histogram that highlights price levels with the most and least trading activity. As Deepvue explains:
"Volume Profile maps the votes. Not the loud ones (price spikes), but the meaningful ones – volume stacked at price".
This data-driven approach makes volume nodes more reliable than subjective support and resistance lines.
Interestingly, 73% of professional traders use volume profile analysis in their trading strategies. Understanding volume nodes is critical, as they are divided into two main types: High Volume Nodes (HVNs) and Low Volume Nodes (LVNs), each reflecting different market dynamics.
High Volume Nodes (HVNs)
High Volume Nodes, or HVNs, are price levels where significant trading has occurred. These appear as peaks on the volume profile chart, representing areas of strong liquidity and market agreement on value. Essentially, HVNs are zones where buyers and sellers found common ground, leading to heavy trading activity.
HVNs often act as "price magnets." As Adam, Founder of Jumpstart Trading, explains:
"High volume nodes act like gravity. They tend to attract price and try to hold it there".
Trading In Depth describes them as:
"brick walls – price needs serious momentum to break through".
This makes HVNs excellent for identifying exit points or profit targets, as they indicate levels where the market has historically shown significant interest.
Low Volume Nodes (LVNs)
Low Volume Nodes, or LVNs, are the opposite of HVNs. These are areas on the volume profile chart with little trading activity, appearing as short bars or even gaps. LVNs highlight price levels that the market has rejected, indicating zones with minimal liquidity.
What sets LVNs apart is the speed at which price moves through these areas. Price tends to "skip" or "rip" through LVNs, as there are fewer resting orders. Adam from Jumpstart Trading describes them as:
"Low volume nodes are zones of low liquidity where price tends to skip right over".
Elior Manier, Market Analyst at OANDA, refers to them as "air pockets". This rapid price movement makes LVNs particularly useful for traders. They are ideal for placing stop-loss orders, as price rarely lingers in these zones. Additionally, LVNs are prime spots for breakout strategies, as momentum often drives price quickly through an LVN toward the next HVN.
What Are Value Areas?
A Value Area represents the price range where 70% of the total trading volume took place during a specific trading session. Essentially, it highlights the "comfort zone" of the market – where most of the trading activity happens. As FTMO puts it:
"The Value Area shows where around 70% of all trading volume took place during a session – basically the market’s comfort zone."
This 70% threshold aligns with one standard deviation, offering a statistically reliable way to gauge market equilibrium. Unlike standard volume bars that show trading activity over time (e.g., volume at 10:00 AM), the Value Area focuses on trading volume at specific price levels (e.g., $5,800). This provides insights into where institutional investors at the best futures prop firms are most active.
To determine the Value Area, start by identifying the Point of Control (POC) – the price level with the highest volume. Then, include price levels above and below the POC until 70% of the total volume is accounted for. The upper limit becomes the Value Area High (VAH), and the lower limit is the Value Area Low (VAL).
Parts of the Value Area
The Value Area has three main components:
| Component | Definition | Market Role |
|---|---|---|
| Point of Control (POC) | The price level with the highest trading volume during the session. | Serves as a "magnet" for prices, reflecting the consensus on fair value. |
| Value Area High (VAH) | The top boundary of the 70% volume range. | Acts as a resistance level; prices above this are seen as overvalued. |
| Value Area Low (VAL) | The bottom boundary of the 70% volume range. | Acts as a support level; prices below this are seen as undervalued. |
The POC reflects the strongest agreement on fair value. As FuturesHive explains:
"POC represents fair value where buyers and sellers agreed most."
This makes the POC a critical target for mean-reversion strategies, which reportedly achieve a 70–75% success rate in trending markets. Meanwhile, the VAH and VAL act as flexible boundaries – prices above the VAH suggest overvaluation, while those below the VAL indicate undervaluation.
Together, these components define the market’s fair value zone, creating a framework for understanding price dynamics.
How Value Areas Show Market Agreement
Value Areas help filter out short-term price fluctuations to reveal where the market finds balance. Prices within the Value Area suggest consensus, while moves outside this range indicate the market is searching for a new equilibrium.
Lee Yang, a Market Analyst at Alchemy Markets, highlights the institutional importance of these levels:
"When we see high volume at a specific price, it often reflects institutional interest, and that makes those levels far more meaningful than a line drawn by eye."
This perspective is supported by the BIS Triennial FX Survey, which shows that financial institutions drive over 93% of global FX turnover. This underscores how Value Areas often reflect the activity of "smart money".
Adding to this, the 80% Rule demonstrates the predictive power of Value Areas. If prices open outside the previous session’s Value Area but later re-enter and stay within it for two consecutive 30-minute periods, there’s an 80% chance they will move to the opposite boundary of the Value Area.
Main Differences Between Volume Nodes and Value Areas
Volume nodes and value areas, while both rooted in volume data, serve different roles in futures trading. Volume nodes pinpoint specific price levels where trading activity either surged or dipped dramatically. On the other hand, value areas represent a broader price range, typically encompassing around 70% of the total traded volume during a session. Understanding these distinctions is key to leveraging them effectively in trade decisions.
Jean Folger, Co-founder of PowerZone Trading, offers an insightful analogy about high-volume nodes:
"High-volume nodes (which have shown a lot of trading activity already) have a strong pull, much like gravity. Traders tend to gravitate toward these areas over and over."
This gravitational pull contrasts with the behavior of low-volume nodes, which often act as zones where prices move quickly due to minimal historical interest.
Comparison Table: Volume Nodes vs Value Areas
| Feature | Volume Nodes (HVN/LVN) | Value Areas (VAH/VAL) |
|---|---|---|
| Definition | Specific price peaks or valleys in volume | Price range containing ~70% of total traded volume |
| Price Behavior | HVNs cause consolidation; LVNs facilitate rapid price moves | Price oscillates within the area or breaks out when imbalance occurs |
| Volume Focus | Focuses on the intensity of trading at specific price points | Shows how volume spreads across prices |
| Primary Use | helps pinpoint precise entry/exit points and stop-loss levels for top futures prop firms | Identifies market bias and distinguishes between range-bound and trending conditions |
| Timeframe Sensitivity | Highly dynamic; nodes shift quickly during active sessions | More stable; reflects the market’s "fair value" for the session |
Why Traders Should Know Both
By combining these tools, traders gain a more complete understanding of market behavior. Value areas reveal the broader market equilibrium and overall bias, while volume nodes highlight specific price levels where trading activity has historically been concentrated. This mix of a macro view with precise, actionable details can significantly improve trading strategies.
For example, if the price is below the point of control but still within the value area, it suggests a balanced market. In such cases, a low-volume node might present an opportunity for entry, anticipating a quick price move toward a nearby high-volume node. Using both tools together can help traders avoid common pitfalls like false breakouts or entering trades too early.
How to Use Volume Nodes and Value Areas in Futures Trading
Using Volume Nodes for Entry and Exit Timing
Now that you know what High Volume Nodes (HVNs) and Low Volume Nodes (LVNs) are, let’s talk about how to use them for entry and exit strategies. HVNs are particularly useful when trading in the direction of the trend. For example, in an uptrend, wait for the price to pull back to an HVN – this represents a price level where the market previously found balance. Once there, look for confirmation signals like a hammer or an engulfing candle before entering your trade.
When it comes to exits, focus on the next major HVN or the Point of Control (POC). These levels often act as natural price magnets since they represent areas of high participation. However, avoid setting profit targets within LVNs, as price tends to move quickly through these zones. If you’re trading a breakout through an LVN, consider reducing your position size because wider stops are generally needed.
Using Value Areas for Range and Trend Trading
In range-bound markets, the Value Area High (VAH) and Value Area Low (VAL) act as key boundaries for trading. If the price moves outside these levels but then closes back inside, it can signal a fade opportunity. In this case, your target could be the POC or the opposite boundary of the value area.
One important concept to keep in mind is the 80% Rule. If the price opens outside the previous day’s value area but then moves back into it, there’s an 80% chance it will fill the entire value area. For trend trading, look for a breakout from the Value Area accompanied by a volume spike. For instance, if the price closes above the VAH on high volume, it indicates "Value Area Acceptance", which often signals a continuation of the trend.
Combining Both for Better Trade Setups
When you combine the granular insights of volume nodes with the broader perspective provided by value areas, you can create more precise trade setups. For example, in an E-mini S&P 500 (ES) futures trade, the market opened at 5,820 and rallied to 5,860. The session established a VAL at 5,800 and a POC at 5,825. Later, the price dipped to 5,798 – just below the VAL – and formed a bullish hammer on triple the normal volume before closing back inside the Value Area at 5,802. This setup offered a strong opportunity. A trader entering long at 5,803 with a stop at 5,793 could have targeted the POC at 5,825 for a 22-point gain, and then the VAH at 5,850 for a 47-point gain.
Confluence is key. For instance, if an HVN aligns with a Fibonacci retracement level like 61.8% or the previous day’s POC, the likelihood of that level acting as strong support or resistance can exceed 80%. To protect your trade, place your stop-loss beyond an HVN cluster or outside the Value Area boundary to confirm invalidation of your setup.
Tools and Resources for Volume Analysis
Prop Firms That Support Volume Profile Tools
You don’t need to spend a fortune to access top-notch volume analysis tools. Many futures prop firms offer platforms and data feeds that allow traders to dive into volume nodes and value areas with precision.
Apex Trader Funding supports platforms like NinjaTrader, Tradovate, and TradingView, all of which come with built-in volume profile tools. NinjaTrader stands out, offering the Order Flow+ package for a one-time fee of about $1,500. This package includes advanced tools like footprint charts and cumulative delta indicators. Similarly, Topstep provides access to its proprietary TopstepX platform, which integrates volume profile tools and operates without commission fees. Take Profit Trader also grants access to NinjaTrader and Tradovate, making it easy to execute HVN and LVN strategies.
For traders seeking lightweight, efficient platforms, Elite Trader Funding offers a free NinjaTrader license for both evaluation and funded accounts, removing upfront costs. Meanwhile, FXIFY Futures provides TradingView charts with free, real-time CME data – a rare and valuable feature, as many firms charge up to $135 monthly for exchange data. If you’re serious about volume profile analysis, steer clear of MT4/MT5 platforms, as they lack the native tools required for this work. Instead, consider platforms like NinjaTrader, Sierra Chart (Level 5 package costs $36/month), or TradingView.
"Volume profile is like having x-ray vision into the market. While regular volume indicators show you when trades happened, volume profile shows you where the actual trading occurred." – Faisal, Founder, TRADEPRO Academy
These tools are essential for implementing strategies based on volume nodes and value areas. They provide the foundation for executing HVN and LVN approaches effectively, making them indispensable for traders aiming to refine their analysis and performance.
How DamnPropFirms Helps Traders

Once you’ve selected the right tools, the next step is finding a prop firm that aligns with your trading style and budget. DamnPropFirms simplifies this process by offering verified reviews, exclusive discount codes, and side-by-side comparisons of leading futures prop firms. The platform highlights firms like Apex Trader Funding, Take Profit Trader, FundedNext Futures, Topstep, and instant funding options such as Tradeify and Lucid Trading.
One standout feature of DamnPropFirms is the Consistency Rule Calculator, which helps traders navigate the often complex payout rules enforced by prop firms. Considering that around 73% of professional traders use volume profile tools daily, having the right platforms and understanding firm rules can directly impact your ability to secure steady payouts. DamnPropFirms also hosts a Discord community with over 3,000 traders, offering real-time support and strategy discussions. Whether you’re looking for a firm with high profit splits (like Apex’s 100% on the first $25,000) or one that guarantees 24-hour payouts (like FundedNext Futures), DamnPropFirms equips you with the information needed to make smart choices.
Conclusion
Volume nodes and value areas work hand in hand to enhance futures trading strategies. Value areas provide the bigger picture, showing the dominant volume zones and indicating whether the market is balanced or trending. On the other hand, volume nodes focus on specific price levels, offering actionable insights for trade execution. High volume nodes (HVNs) often act as price magnets, creating consolidation zones, while low volume nodes (LVNs) highlight areas where price moves quickly due to limited liquidity.
When used together, these tools give traders a sharper edge in timing the market. Value areas show where the market deems prices fair, while volume nodes pinpoint precisely where to enter, exit, or set stops. For example, if the price starts outside the previous day’s value area and re-enters, the 80% Rule suggests it may fill the entire range. Using HVNs and LVNs can help refine those entry and exit points.
"Volume Profile is reactive. It doesn’t guess. It shows where interest already happened. You’re reading footprints, not fortune-telling." – Deepvue
To effectively apply these strategies, access to advanced volume profile tools is crucial, and understanding how futures prop firms work is the first step to using them. Platforms like DamnPropFirms connect traders with leading futures prop firms such as Apex Trader Funding, Take Profit Trader, and Topstep. These firms provide platforms like NinjaTrader and Tradovate, which come equipped with built-in volume analysis tools. Alongside these resources, the platform offers exclusive discounts, verified reviews, and tools like the Consistency Rule Calculator, helping traders meet payout requirements and improve their trading outcomes.
FAQs
Should I build volume nodes and value areas from RTH or the full session?
When it comes to futures trading, using data from the full trading session – rather than limiting yourself to Regular Trading Hours (RTH) – is often the smarter choice. Full-session data reflects all market activity and liquidity, giving you a clearer picture of crucial support and resistance levels. By analyzing trading volume patterns from the entire session, you get a more complete and accurate understanding of the market dynamics.
How do I confirm a real breakout at an LVN or outside the value area?
To identify a genuine breakout at a Low Volume Node (LVN) or outside the value area, pay attention to two key indicators: increased trading volume and consistent price movement beyond the level. These signals reflect market confidence and can help you distinguish between a real breakout and a false alarm.
Where should my stop go relative to HVNs, LVNs, and the VAH/VAL?
In futures trading, aligning your stop-loss levels with volume profile areas can help you manage risk effectively:
- HVNs (High Volume Nodes): Set your stops just beyond these high-volume areas. This helps you avoid getting caught by typical market noise, as these zones often act as strong support or resistance.
- LVNs (Low Volume Nodes): Be cautious here. Stops can be placed within or beyond these low-volume zones since they often signal potential break points where price movement can accelerate.
- VAH (Value Area High) and VAL (Value Area Low): For long positions, position your stops just below the VAL. For shorts, place them just above the VAH. This strategy minimizes the chances of being stopped out prematurely while staying aligned with key market levels.