Spoofing in futures markets involves placing large orders with no intention of execution, creating false market signals to manipulate prices. This tactic can lead to poor trading decisions, financial losses, and market instability. Key strategies to detect spoofing include:
- Use Heatmaps and Level 2 Data: Tools like Bookmap highlight unusual order behavior, such as large orders that vanish quickly.
- Monitor Cancellation Rates: A cancellation-to-execution ratio (CER) over 90-95% often signals spoofing.
- Identify Patterns: Look for repetitive placement and cancellation of large orders, especially near price levels.
- Analyze Price Impact: Watch for price movements influenced by large orders that are canceled immediately after.
- Leverage AI Tools: Advanced systems can detect spoofing patterns using machine learning and anomaly detection.
Spoofing disrupts market dynamics and can harm traders, especially during prop firm evaluations. By combining visual tools, statistical metrics, and AI-driven strategies, traders can better identify and avoid manipulative practices. For those looking to trade in a professional environment, check out our futures prop firm reviews to find the right platform.
Spoofing & Layering EXPOSED – How Algorithms Trick Futures Traders (Bund Futures Price Ladder Guide)
sbb-itb-46ae61d
Tools for Detecting Spoofing
Detecting spoofing requires specialized tools that can visualize the full depth of an order book and monitor liquidity changes over time. These tools help differentiate between legitimate orders and manipulative tactics.
Order Flow and Market Depth Analysis Tools
Liquidity heatmaps are a key tool for spotting spoof orders. They transform Level 2 data into a visual snapshot, highlighting areas of high order concentration with contrasting colors. This makes it easier to identify abnormal order behavior. For example, Bookmap is a well-regarded platform in this space, boasting a TrustScore of 4.6/5 on Trustpilot from 591 reviews.
"A heatmap acts as DOM with memory – a visual integration of historical context that static ladders lack".
One common spoofing tactic involves placing a large sell order that disappears just before the price reaches it. Heatmaps can help you spot these patterns, as genuine liquidity tends to stay in place, execute, and even refresh. Bookmap enhances this analysis with volume bubbles, which overlay executed market orders on the heatmap. This feature helps confirm whether actual buying or selling pressure interacts with the displayed liquidity.
Bookmap offers a free digital plan for crypto trading with delayed data, while premium subscriptions provide real-time CME futures data for funded accounts through professional feeds like Rithmic or dxFeed. Its advanced features, such as Iceberg Trackers and Large Lot Trackers, are designed to identify hidden orders that refresh at specific price levels, making it easier to distinguish between legitimate institutional activity and spoofing. Additionally, its nanosecond-level zoom capability reveals intricate market microstructures, which are critical for spotting high-frequency spoofing.
Pair these visual tools with detailed Level 2 market data for a more refined approach to spoofing detection.
Level 2 Market Data and Heatmaps
Relying on standard Level 1 data (which only shows the best bid and ask prices) isn’t enough to detect spoofing. Full-depth Level 2 market data is essential, as it reveals all resting orders at every price level. This detailed data feeds into tools like heatmaps and depth-of-market displays, offering a clearer picture of order book dynamics.
To make your heatmap more effective, calibrate it to highlight the top 10–15% of order sizes, filtering out smaller, retail-level noise. You can also use software filters to exclude the bottom third of the order book, allowing you to focus on large orders that have the potential to influence market movements.
Keep an eye out for sudden imbalances in the order book – situations where large buy or sell orders appear and then vanish without being executed. These artificial imbalances are often created by spoofers to give the illusion of strong buying or selling pressure.
For traders looking for even more precision, platforms like Futures Analytica offer automated tools. Their CounterSpoof Scanner ($1,499.00) and L2Azimuth strategy ($2,499.00) use machine learning to analyze quoting activity, cancellation patterns, and execution probabilities. These tools generate unified scores to help classify different phases of manipulation. When combined with visual analysis, these algorithmic tools provide a powerful way to confirm what you see on the heatmap.
Step-by-Step Guide to Detecting Spoofing
Spoofing Detection Metrics and Thresholds for Futures Trading
Using the tools mentioned earlier, here’s how you can identify spoofing activity as it happens.
Monitor High Cancellation Rates
Start by calculating the cancellation-to-execution ratio (CER) for large orders within a rolling time frame. Spoofers often use massive orders to create a false sense of liquidity, so isolating these orders is critical.
When CER values exceed 90-95%, it’s a strong indicator of spoofing. In high-frequency trading, detection systems frequently flag activity when CER goes beyond 95% within a narrow 100-millisecond window near the best bid or offer.
Pay close attention to the Quote Life Span (QLS) – how long an order remains active. Genuine market participants at the top futures prop firms usually have longer QLS to earn rebates, whereas spoofers often cancel orders within milliseconds. Similarly, track the Order-to-Trade Ratio (OTR). A sudden spike in this ratio, especially when tied to price changes, often signals manipulative behavior.
Identify Large Orders Relative to Market Depth
Look for large orders that dominate the order book but disappear before execution. These orders distort the perception of liquidity. Use tools like heatmaps and Level 2 data to spot these patterns.
For example, in December 2025, a case involving E-mini S&P 500 futures showed a 500-lot bid wall placed just one tick below the market. This wall stalled downward momentum for three seconds, and after prices rose by two points, the wall disappeared and reappeared on the ask side four ticks higher. This confirmed manipulation.
Also, consider the distance from the spread. Spoofers often place large orders just outside the immediate bid-ask spread to influence market perception. If these orders constantly adjust to maintain a specific distance without being filled, they’re likely deceptive. Heatmap visualizations can help you distinguish between genuine liquidity (sustained density) and spoofing (brief, intense flashes that vanish quickly).
Detect Repetitive Placement-Cancellation Patterns
Watch for behaviors like layering and rapid cancellations. Layering involves placing multiple large orders at sequential price levels to create a false wall of liquidity. Rapid cancellation occurs when orders are placed and withdrawn within milliseconds, aiming to provoke reactions from other algorithms.
For instance, in January 2026, an algorithm flagged Stock ZYX (priced at $50.00) when 50,000 shares were layered between $49.80 and $49.95. As soon as the price hit $50.01, the entire block of orders vanished without a single execution.
Track how quickly liquidity changes across the top five price levels. Rapid repositioning of orders that maintain a specific distance from the spread – especially synchronized additions or withdrawals within milliseconds – suggests manipulation.
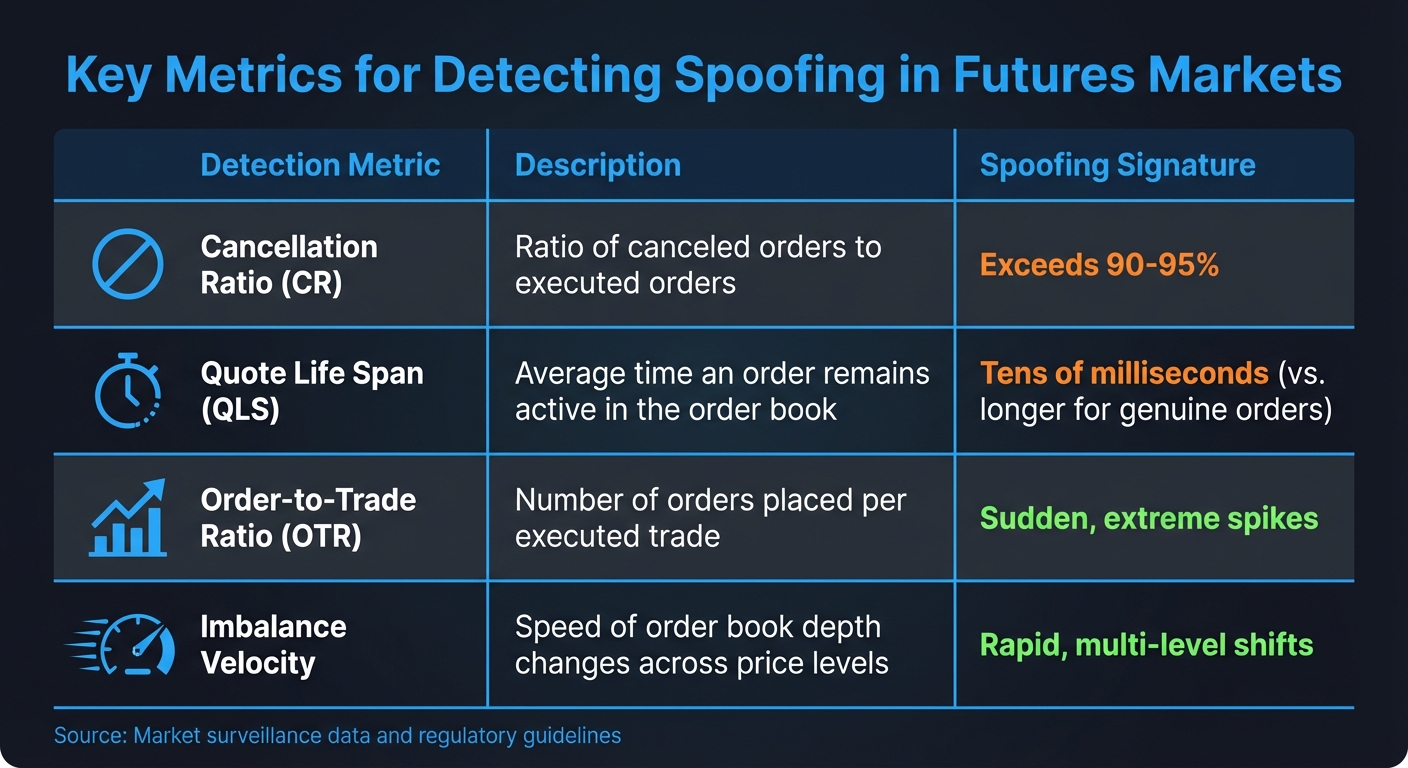
| Detection Metric | Description | Spoofing Signature |
|---|---|---|
| Cancellation Ratio (CR) | Ratio of canceled to executed orders | Exceeds 90-95% |
| Quote Life Span (QLS) | Average time an order stays active | Tens of milliseconds |
| Order-to-Trade Ratio (OTR) | Number of orders placed per executed trade | Sudden, extreme spikes |
| Imbalance Velocity | Speed of order book depth changes | Rapid, multi-level shifts |
Analyze Price Impact Without Execution
Check if large orders push prices in a specific direction, only to be canceled immediately after, followed by trades on the opposite side. This pattern reveals the spoofer’s intent: manipulating prices rather than executing trades.
"Spoofing creates temporary, psychological impact by manufacturing perceived support or resistance, often leading to rapid price reversals when the fake orders are pulled." – QuantStrategy.io Team
To avoid being misled by fake liquidity, calculate Real Depth Imbalance by excluding orders with short QLS or those from participants with historically high OTRs.
You can also test liquidity using small, high-priority “ping” orders. For example, if a large order appears as a wall, place a small order on the opposite side. If the large order vanishes immediately, it confirms manipulative intent.
Check Order Book Imbalances and Volatility Spikes
Keep an eye on sudden order book imbalances where large buy or sell orders show up and disappear without execution. These create an illusion of strong market pressure. Track the cancellation velocity, or how quickly large orders are withdrawn after being placed. Spoof orders are typically canceled milliseconds before they can be filled.
Use rolling time windows to calculate cancellation ratios and order-to-trade ratios, helping you spot sudden spikes in activity. Correlate these metrics with price movements to uncover manipulation patterns effectively.
Advanced Techniques for Spoofing Detection
Machine Learning and Anomaly Detection
AI-driven systems have transformed spoofing detection, enabling the analysis of vast datasets that go well beyond what humans can process in real time. Tools like Recurrent Neural Networks (RNNs), particularly Long Short-Term Memory (LSTMs), excel at analyzing sequential order book data to pinpoint deceptive patterns. Meanwhile, Convolutional Neural Networks (CNNs) focus on high-frequency snapshots, generating a "Spoof Probability" score to help distinguish artificial momentum. Advanced scanners even trigger reversal trades when this score surpasses 0.95. In scenarios lacking labeled historical data, unsupervised models like Isolation Forest or autoencoders step in, flagging statistically unusual activities that rule-based systems may overlook.
A critical element in these models is feature engineering – selecting the right metrics to analyze. Key metrics include Order Life Duration (time between order placement and cancellation), Volume Imbalance Change Rate, and Execution Slippage Proxies. Temporal Convolutional Networks (TCNs), configured with 128 filters and swish activation functions, have achieved an impressive 91% accuracy in predicting spoofing labels. These models can also integrate additional metrics, like cancellation rates and order book imbalances, to further sharpen detection.
"Leveraging AI to detect spoofing and iceberg orders is no longer a luxury – it is a mandatory component of competitive high-frequency futures trading." Many traders use these tools while working with the best prop firms with instant funding to capitalize on market inefficiencies without lengthy evaluation periods. – QuantStrategy.io Team
While these AI tools are highly effective within individual markets, spoofers often exploit correlations across multiple instruments, requiring a broader analytical approach.
Cross-Product Correlation Analysis
Spoofers don’t always manipulate the market they’re directly trading. Instead, they may engage in cross-product spoofing, where large deceptive orders are placed in one instrument to influence the price of a related product, often on a different exchange. For instance, spoofing in Treasury bonds might be used to benefit a genuine position in Treasury futures.
Consider two notable cases:
- In September 2018, the CFTC fined Victory Asset Inc. and trader Michael D. Franko $2.3 million for spoofing copper futures on COMEX to manipulate prices in correlated copper futures on the London Metal Exchange (LME).
- In November 2023, BofA Securities faced a $24 million fine from FINRA for 717 spoofing incidents. A supervisor placed non-bona fide orders for 30-year Treasury bonds – often valued at $50 million par – to trigger executions of genuine iceberg orders in correlated Ultra T-Bond futures. These deceptive orders were typically canceled in under a second after achieving favorable executions.
To combat such tactics, the "Composite Instrument" (CI) method has emerged as a powerful tool. This approach monitors overlapping activity across correlated markets by analyzing multiple Limit Order Books (LOBs) simultaneously. Using tools like Dual Market Ladder Replay, traders can visualize side-by-side activity in related markets. For example, large orders in one product that consistently appear before price shifts in a correlated product – and then vanish after favorable executions – can signal cross-product manipulation.
Integrating Spoofing Detection into Prop Trading
Using Detection Tools During Evaluations
At firms like Apex Trader Funding, maintaining discipline is non-negotiable due to strict rules and trailing drawdowns. For instance, a $50,000 evaluation account at Apex requires hitting a $3,000 profit target while staying within a $2,500 trailing drawdown limit. Falling for a spoof wall can lead to instant adverse selection, potentially breaching these limits in just seconds.
To navigate this, tools like Bookmap are invaluable. They help traders distinguish between genuine liquidity and spoof orders in real time. Spoofing often appears as quick flashes on a heatmap, while legitimate iceberg orders show up as sustained, dense coloring at specific price points.
"If the order disappears before it can be hit, it’s likely a spoof." – Bookmap Learning Center
Another key indicator is a cancellation ratio exceeding 95% for large orders, signaling that these orders are likely non-genuine and canceled before execution. By monitoring these metrics during evaluations at firms such as Take Profit Trader or Tradeify, traders can avoid the artificial market reversals and whipsaws that often lead to failed evaluations. Mastering these techniques during the evaluation phase sets the foundation for disciplined execution in a funded account.
Maximizing Payouts with Disciplined Trading
Once traders pass their evaluations, these detection tools remain critical for scaling accounts and managing risk effectively. Metrics like cancellation ratios and hidden absorption, which were vital during evaluations, continue to protect funded accounts from unnecessary losses.
Real-time heatmaps provide confirmation of genuine volume and liquidity before entering trades. This approach ensures entries are based on authentic market depth rather than manipulated order book activity, which can significantly improve win rates.
Spotting hidden absorption offers an additional advantage. When heavy volume prints occur at levels without visible large orders, it often signals institutional iceberg orders quietly absorbing trades. Recognizing these patterns allows traders to align with institutional flows instead of getting caught on the wrong side. This alignment leads to more stable equity curves, meeting the professional standards required by firms like Alpha Futures and Topstep.
Spoofing is designed to provoke emotional buying or selling, which traders must resist to maintain the discipline needed for funded accounts. By leveraging order flow visualization to separate genuine market moves from noise, traders safeguard their capital and build the consistency needed to scale accounts and achieve higher payout percentages.
Conclusion
This section brings together key methods for detecting spoofing, focusing on both quantitative metrics and visual tools. Among the most reliable indicators are a Cancellation Ratio above 95% for large orders, extremely short Quote Life Spans (measured in milliseconds), and high Order-to-Trade Ratios, which suggest heavy order placement with minimal executions. These metrics are invaluable for distinguishing genuine liquidity from deceptive market activity.
Visual tools like Order Book Heatmaps provide additional clarity by highlighting persistent institutional interest versus fleeting spoof orders that disappear as prices near them. When paired with Level 3 Market-by-Order data, traders gain access to unique Order IDs, enabling them to track individual order placements, modifications, and cancellations – granular details that aggregated Level 2 data simply cannot provide.
"Detecting spoofing and iceberg orders moves the analysis of the order book from a passive activity to an active forensic pursuit." – QuantStrategy.io Team
Using these tools can transform how traders interpret order book dynamics, which is critical for success in futures trading. By proactively monitoring order flow, traders can shield themselves from artificial market moves, preserve capital during prop firm evaluations, and better protect funded accounts.
Integrating these detection methods into daily routines helps traders avoid adverse selection and align with genuine market liquidity. For those pursuing futures prop trading opportunities, these strategies not only safeguard evaluations but also support long-term account growth. To dive deeper into futures prop trading, check out DamnPropFirms.
FAQs
How can I tell a spoof wall from real liquidity fast?
To identify a spoof wall, pay attention to how large orders in the order book react as the price gets closer to them. Spoof walls tend to disappear or reduce in size, which is a clear sign of manipulation. On the other hand, real liquidity remains steady even as the price approaches. Using tools like heatmaps and order book replay can provide a clearer picture, helping you determine whether the orders are genuine or fake in real-time.
What CER and quote-life thresholds should I use per market?
Detecting spoofing often involves analyzing market behavior to identify suspicious patterns. Spoofing orders tend to stand out because they are usually canceled very quickly – often within seconds, with an average of around 12 seconds – and are significantly larger than legitimate orders.
To identify spoofing effectively, focus on these key indicators:
- Rapid cancellations: Keep an eye on orders that are withdrawn almost immediately after being placed.
- Unusually large orders: Spoofing orders are often much larger than typical genuine orders.
By monitoring these patterns, you can set thresholds tailored to specific market behaviors. Pay close attention to cancellations that occur within seconds and order sizes that seem disproportionately large compared to normal activity.
Can spoofing signals be wrong during news or roll periods?
Spoofing signals can often lose accuracy during news events or roll periods due to the unpredictable nature of market conditions. In these scenarios, rapid order cancellations or fake orders might mimic the behavior of spoofing, making it more challenging to identify. This is particularly evident when market volatility spikes, causing trading patterns to become erratic and less predictable.