Order flow and market depth are two essential tools for managing risk when trading with the best futures prop firms. While order flow tracks executed trades to show actual market activity, market depth focuses on resting limit orders, revealing where liquidity is concentrated. Combining these tools provides a clearer picture of market dynamics, helping traders make better decisions about entries, exits, and risk management.
Key Takeaways:
- Order Flow: Shows completed trades, highlights momentum, and detects trends or reversals.
- Market Depth: Displays pending orders, identifies support/resistance levels, and estimates slippage.
- Best Use: Order flow is optimal for timing trades, while market depth is ideal for planning around liquidity.
Order Flow Basics: What Every Trader Must Understand!
sbb-itb-46ae61d
Order Flow: How It Works for Risk Control
Grasping order flow is key to sharpening risk control strategies in futures trading. By breaking down its components, traders gain a real-time view of market activity.
Components of Order Flow
Order flow analysis provides a live snapshot of market dynamics.
- Time and Sales (or "the tape") logs each trade’s price, size, and whether it was initiated by buyers or sellers. This highlights the speed and urgency behind market moves.
- Volume Delta tracks the difference between market buy and sell orders during a given period. A positive delta signals aggressive buying, while a negative delta points to aggressive selling. Cumulative Volume Delta (CVD) builds on this by keeping a running total, offering insights into sustained buying or selling trends that might not be obvious from price movements alone.
- Absorption happens when large limit orders block aggressive market orders at a specific price, halting further price movement. For instance, heavy buying that doesn’t push the price higher often reflects institutional defense. Footprint charts reveal the volume traded at each price level within a candlestick, exposing buyer-seller battles that traditional charts might miss.
These elements together lay the groundwork for effective risk management strategies.
Using Order Flow in Risk Management
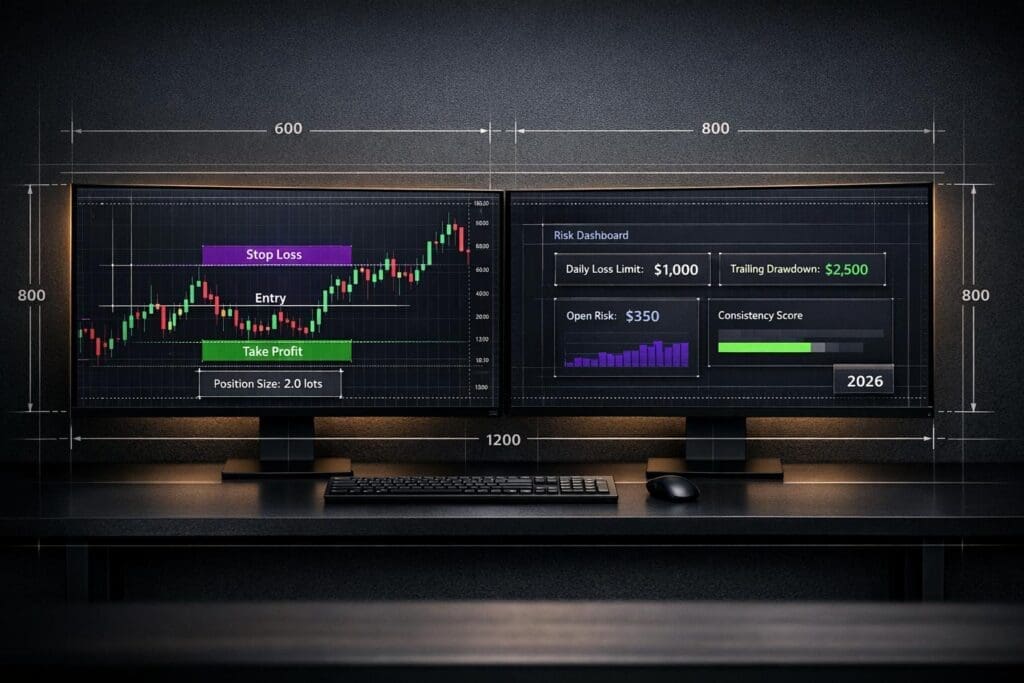
Order flow insights can fine-tune stop placement and position sizing. For example, traders often place stops behind high-volume nodes or clusters of limit orders, which act as natural barriers.
When aggressive volume increases but the price doesn’t move, it signals exhaustion, suggesting it’s time to exit before a reversal. Similarly, if the price hits a new high but the CVD doesn’t rise with it, it often means that buying pressure is fading.
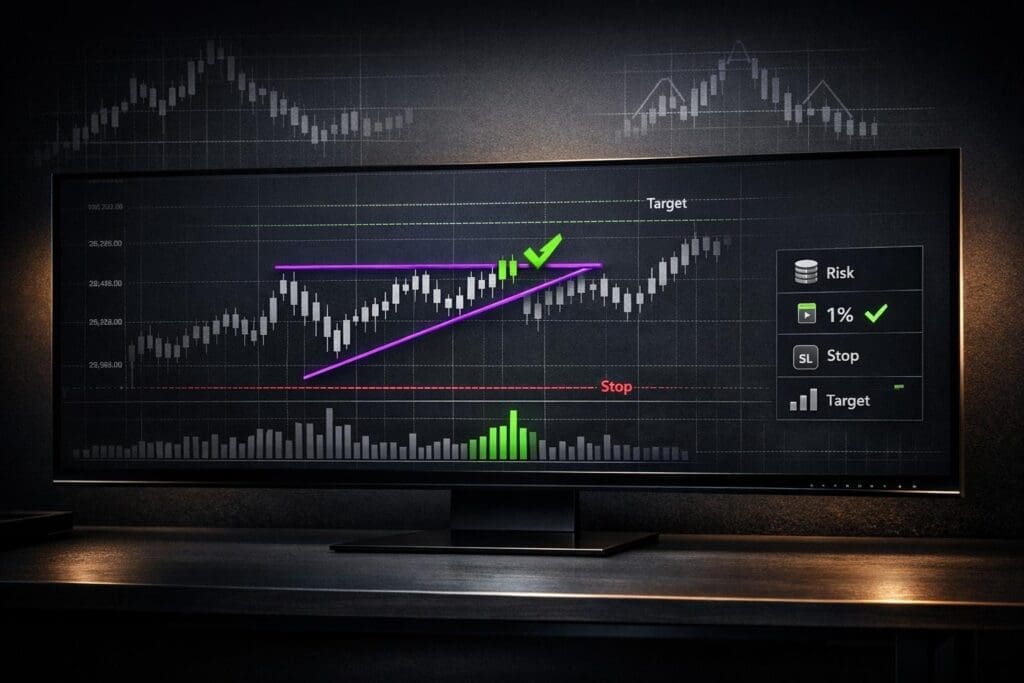
Order flow is also useful for confirming breakouts. Before jumping into a breakout trade, checking that the Volume Delta aligns with strong market participation can help avoid low-volume traps.
Iceberg orders – hidden institutional liquidity – can be spotted through repeated fills at the same price on the Time and Sales tape, offering traders a heads-up.
Order Flow Benefits for Prop Traders
For prop traders, these techniques do more than just protect positions – they also provide an edge. In volatile markets, traditional indicators based on historical data often lag, while order flow reveals the tug-of-war between buyers and sellers in real time.
Take December 2018 as an example. During this period, E-mini S&P 500 futures saw a 75% drop in order book depth compared to September 2018, even as trading volume surged by 65%. In such conditions, order flow helped traders gauge liquidity more accurately than relying on order book depth alone.
Order flow also helps prop traders with drawdown and loss limits make timely exits when trends lose momentum. For instance, on the NQ futures market, algorithmic bots shut off five minutes before an FOMC release, creating a "halo" effect on the heatmap. This hinted at an impending liquidity vacuum, prompting traders to adjust their positions.
"Reading order flow is like looking under the hood of the market to see how it actually functions."
Firms like Apex Trader Funding, Take Profit Trader, and Topstep rely on order flow to identify breakout opportunities backed by institutional volume rather than fleeting retail activity. This precision is especially valuable for managing multiple funded accounts or scaling positions effectively.
Market Depth: How It Works for Risk Control
Order flow gives a snapshot of current trades, but market depth paints a broader picture by showing the stacked limit orders that can either absorb or resist price changes.
Understanding the Depth of Market (DOM)
The Depth of Market (DOM) tool displays pending limit orders at various price levels beyond the current best bid and ask prices. On one side, bid quantities suggest potential support, while ask quantities on the other side indicate potential resistance. Large groupings of orders, often referred to as liquidity walls, form at critical price points and shift as traders adjust their positions. A "deep" market has plenty of orders on both sides, which prevents a single large trade from causing significant price swings. On the flip side, areas with sparse volume, known as liquidity gaps, can lead to rapid price movements during periods of volatility.
The DOM is also a useful tool for spotting manipulation tactics, such as spoofing (placing fake orders) or iceberg orders (hidden large orders), especially when cross-referenced with Time and Sales data.
Using Market Depth in Risk Management
Market depth complements order flow by offering insights into potential price barriers and the risk of slippage. This liquidity overview is crucial for making tactical trading decisions. For example, traders use the DOM to avoid "walking the book", where a large market order exhausts the best available prices and continues executing at progressively worse levels. To avoid this, compare your order size to the cumulative volume at nearby price levels. If your order exceeds about 10% of the available volume, switching to a limit order can help reduce execution costs.
Market depth also identifies key price levels where significant clusters of limit orders act as barriers. Recognizing these levels allows traders to fine-tune their risk management strategies.
Take the April 2025 "tariff-palooza" event as an example. During this period, E-mini S&P 500 futures saw a 68% drop in order book depth by April 7. Even so, the market absorbed large volumes with minimal price disruption. The 90th percentile fill quality widened by just 6.7 ticks compared to calmer periods, showcasing how high quote refresh rates can maintain execution quality even when visible depth appears thin.
"A low level of resting volume at the top of the order book does not necessarily indicate a lack of liquidity. A high quote refresh rate can allow incoming buy and sell orders to be filled without a significant price change."
Market Depth Benefits for Prop Traders
For proprietary traders working under strict drawdown limits, the DOM is a vital tool for assessing risk before entering a trade. In fast-moving or thinly traded markets, knowing how much liquidity is available can help traders size their positions appropriately. For instance, if the DOM shows only 50 contracts at the best bid and a trader plans to sell 200 contracts, this signals that a market order could lead to substantial slippage.
The DOM is also invaluable for scaling positions. Traders at firms like Apex Trader Funding and Take Profit Trader often manage multiple funded accounts. By monitoring cumulative depth across price levels, they can estimate the real cost of executing larger trades and adjust their strategies accordingly.
During periods of low liquidity or major news events, the DOM acts as an early warning system. A sudden withdrawal of liquidity from the order book often signals that automated risk controls are kicking in. This gives traders a chance to tighten their own risk measures before the market moves against them. By leveraging these insights, traders can improve their risk management and navigate volatile markets more effectively.
Order Flow vs. Market Depth: Strengths and Weaknesses
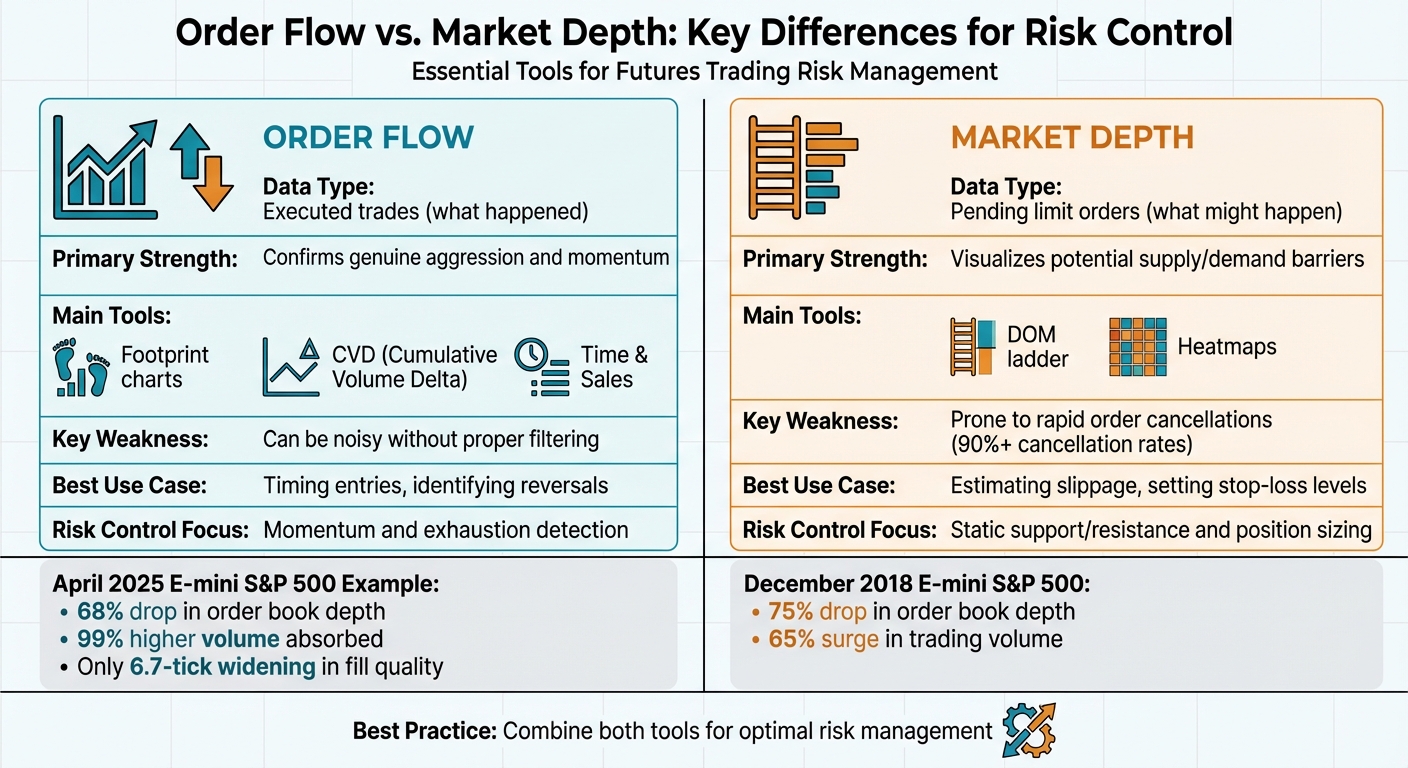
Order Flow vs Market Depth: Key Differences for Futures Trading Risk Management
After exploring the basics of risk control through order flow and market depth, it’s time to dive into how these two approaches stack up against each other. Each has its own advantages and limitations, and knowing when and how to use them can make all the difference in your trading strategy.
Strengths of Order Flow
Order flow focuses on executed trades, giving you a clear picture of actual market activity. This makes it incredibly useful for cutting through the noise of market depth, where limit orders can be placed and canceled in the blink of an eye. Tools like Cumulative Volume Delta (CVD) and footprint charts shine here, as they reveal whether buyers or sellers are driving price movements with conviction.
Another key advantage of order flow is its ability to detect absorption. This happens when large limit orders prevent a price from moving further, even in the face of aggressive buying or selling. Such moments often signal possible reversals. Additionally, order flow can spot "toxic flow", where market makers are being adversely selected, highlighting high-risk conditions for liquidity providers. It’s also great for identifying momentum exhaustion and unfinished auctions – areas where price is likely to revisit due to unmet buying or selling pressure.
Strengths of Market Depth
Market depth, on the other hand, gives you a forward-looking perspective by showing where large clusters of limit orders are placed. These areas often act as support or resistance zones, providing a structural framework for traders to work with. The DOM (Depth of Market) tool is especially helpful for estimating slippage and market impact when executing large orders. This can prevent traders from "walking the book" and ending up with worse fill prices.
For traders managing strict risk limits and consistency rules, market depth offers a static way to place stop-loss orders behind liquidity blocks. A great example of this was during the April 2025 volatility event, where E-mini S&P 500 futures experienced a 68% drop in order book depth. Despite this, the market absorbed 99% higher volume with only a 6.7-tick widening in fill quality at the 90th percentile.
"A low level of resting volume at the top of the order book does not necessarily indicate a lack of liquidity. A high quote refresh rate can allow incoming buy and sell orders to be filled without a significant price change."
- CME Group
These strengths highlight how each tool excels in different areas, setting the stage for a direct comparison.
Comparison Table: Order Flow vs. Market Depth
| Feature | Order Flow | Market Depth |
|---|---|---|
| Data Type | Executed trades (what happened) | Pending limit orders (what might happen) |
| Primary Strength | Confirms genuine aggression and momentum | Visualizes potential supply/demand barriers |
| Main Tool | Footprint charts, CVD, Time & Sales | DOM ladder, heatmaps |
| Key Weakness | Can be noisy without proper filtering | Prone to rapid order cancellations |
| Best Use Case | Timing entries, identifying reversals | Estimating slippage, setting stop-loss levels |
| Risk Control Focus | Momentum and exhaustion detection | Static support/resistance and position sizing |
Order flow captures the market’s pulse by focusing on aggressive trading activity, while market depth highlights where capital is positioned to defend or resist price movements. High-frequency traders, with their massive order-to-trade ratios and cancellation rates exceeding 90%, can make raw market depth data unreliable. Order flow helps cut through this by concentrating on actual trades, though it can overwhelm traders with excessive detail if not processed correctly.
Meanwhile, market depth’s biggest challenge is its susceptibility to manipulation. Large orders can appear and vanish in milliseconds, making it tricky to rely on without context. Order flow addresses this by focusing on executed trades, but it can lag if data isn’t batched properly for your chosen timeframe. For futures prop traders at firms like Apex Trader Funding or Take Profit Trader, understanding these trade-offs is key to making informed risk management decisions.
Combining Order Flow and Market Depth for Better Risk Control
Combined Strategies for Risk Management
After examining order flow and market depth separately, let’s dive into how combining these tools can enhance risk control. A practical approach is to use market depth for identifying key support and resistance levels. These levels help pinpoint ideal entry points and stop placements. At the same time, order flow analysis – like tracking delta imbalances – can confirm the timing for entries and exits. For instance, focus on high-volume nodes in your Volume Profile. These are areas where about 70% of trades occur. Such levels often act as structural support or resistance, but don’t rush in blindly; wait for your footprint chart to reveal a clear delta imbalance, signaling aggressive market orders in your desired direction.
When placing stops, consider positioning them just beyond low-volume nodes (LVNs) or liquidity gaps visible in the market depth. If the price breaks through these zones, it usually invalidates the trade idea. Another useful signal is "absorption", where large limit orders in the DOM hold the price steady despite aggressive market orders. This can confirm low-risk reversal setups. Additionally, watch for disappearing sell walls on the DOM as the price nears a breakout point. Pairing this observation with aggressive buying imbalances on your footprint chart can help you avoid liquidity traps, where price movements appear strong but lack real institutional backing. This combined strategy sharpens entry and exit precision, aligning well with the needs of futures prop traders.
How Futures Prop Traders Use These Techniques
These integrated techniques are particularly valuable for futures prop traders, allowing for more precise risk management. Firms like Apex Trader Funding, Topstep, and Lucid Trading provide the advanced data feeds and platforms necessary for combining DOM and order flow analysis effectively. This access ensures traders can use institutional-grade tools without needing the large capital typically required for direct market access.
Some firms, such as Lucid Trading and Tradeify, even offer instant funding options. This allows traders to start applying these strategies right away, bypassing long evaluation periods. For those managing funded accounts at firms like Take Profit Trader or FundedNext Futures, spotting iceberg orders becomes crucial. Iceberg orders – large institutional orders broken into smaller pieces – can be identified by comparing the small visible orders in the DOM with the actual executions visible in Time & Sales. This helps traders align with institutional activity, avoiding the pitfalls of trading against it.
Tools for Combining Techniques
Several trading platforms make it easier to merge market depth and order flow analysis. NinjaTrader‘s Order Flow+ combines DOM functionality with footprint charts and cumulative delta indicators, all in one interface. Sierra Chart (priced between $26–$52 monthly) offers detailed historical depth data for backtesting, while ATAS (€19.95–€49.95 monthly) is known for its excellent visualization of complex order flow patterns. Bookmap ($16–$99 monthly) stands out with its visual heatmaps, which display real-time limit order density.
For these strategies to work effectively, low-latency data feeds are essential. Even a millisecond delay can disrupt bid/ask signals, particularly in high-volume markets like the E-mini S&P 500, which sees over 1 million contracts traded daily. Platforms such as TradeLocker, which integrates with TradingView, allow you to work with volume profile and order flow indicators seamlessly within one interface. Finally, keeping a trade journal is a valuable habit. Recording behaviors like "stop-hunting" or "absorption" can help you better differentiate genuine institutional moves from algorithmic noise, continually refining your approach.
Conclusion: Order Flow and Market Depth for Risk Control
Order flow and market depth work together to provide a powerful approach to managing risk. Think of market depth as your map, highlighting where liquidity resides through resting limit orders, while order flow serves as the story, showing how that liquidity is being consumed in real time. Take April 7, 2025, for example: despite a massive volume surge – over 99% above the Q1 average – visible order book depth in E-mini S&P 500 futures dropped by 68%. While market depth revealed limited visible liquidity, order flow exposed aggressive institutional activity driving the market.
This combination is crucial for proprietary traders who have strict drawdown limits. For futures prop traders working with firms like Apex Trader Funding, Take Profit Trader, or FundedNext Futures, or Phidias Prop Firm, using both tools is a game-changer. Market depth helps traders anticipate slippage and spot key support or resistance levels, while order flow shows whether those levels are holding firm or being overrun by aggressive orders. Together, these tools help reduce tail risk – unexpected costs that can eat into profits or breach trading rules.
"Order books are the structural foundation of modern markets. Mastering the order book, market depth, and the operational landscape… gives traders a clear edge in execution quality and risk management." – Jack Williams, Moss.sh
Advancements in trading platforms have made it easier than ever to combine these insights. Tools like Sierra Chart ($26–$52 per month) and ATAS (€19.95–€49.95 per month) now provide retail traders with access to institutional-level features like footprint charts and depth visualization. Additionally, firms like Lucid Trading and Tradeify offer instant funding, enabling traders to put these strategies into action without lengthy evaluation periods.
FAQs
When should I rely on order flow vs. market depth?
Order flow offers a way to examine real-time activity by tracking what buyers and sellers are doing, how liquidity behaves, and the mood of the market in the short term. On the other hand, market depth provides insights into liquidity beyond the top of the order book, making it particularly useful when markets are stable. However, during periods of high volatility, relying solely on market depth might not give an accurate picture of actual liquidity. By using both order flow and market depth together, you can gain a clearer understanding and strengthen your approach to managing risks.
How do I place stops using DOM and order flow together?
Using the DOM (Depth of Market) and order flow can help you strategically place stops. The DOM reveals key support and resistance levels, areas with high liquidity, or order imbalances. To minimize the risk of stop hunts, position your stops just beyond major order clusters.
Pair this with order flow analysis – watch for trade imbalances or large order absorption – to pinpoint potential reversal zones. This approach ensures more accurate risk management and better decision-making.
How can I spot spoofing or iceberg orders in real time?
To spot spoofing or iceberg orders in real time, advanced order flow tools are your go-to. These tools help uncover hidden liquidity and provide insights into order book activity.
Iceberg orders – which involve concealed trade sizes – can often be identified using charts that reveal hidden portions of trades. On the other hand, spoofing is characterized by rapid placements and cancellations of orders. Key signs include imbalances in the order book, unusually high cancellation rates, and repetitive patterns in market depth.
Real-time footprint charts are particularly useful for visualizing these anomalies. Additionally, machine learning models can enhance detection by analyzing patterns and flagging suspicious activity as it happens.