Footprint charts give traders a deeper look into market activity by showing buy and sell volumes at each price level. But default settings can overwhelm with too much data, making it hard to identify key signals like large institutional orders, absorption, or order imbalances. Customization solves this by filtering out noise and highlighting critical patterns.
Key takeaways:
- Spot Institutional Activity: Tools like volume filters and big trade highlights pinpoint large orders.
- Reduce Noise: Adjust delta colors and filters to focus on meaningful data.
- Identify Order Imbalances: Automatically track imbalances and stacked levels for better trade timing.
- Platforms to Use at Best Futures Prop Firms: ATAS, Sierra Chart, Bookmap, NinjaTrader, and MultiCharts offer robust customization options.
Customizing footprint charts lets traders focus on institutional moves, improving decision-making and trade precision. Platforms like Sierra Chart (starting at $36/month) and ATAS (starting at $85/month) provide tools to tailor charts to your strategy.
Footprint Chart Settings & How to Use Them for Real-Time Trade Qualification
sbb-itb-46ae61d
Problems With Standard Footprint Charts
Footprint charts offer more detail than candlestick charts, but their default configurations can overwhelm traders with excessive data. Instead of providing clarity, they often obscure the institutional signals traders rely on. Without proper tools to sift through the noise, it becomes challenging to make informed decisions. This is why customizing these charts is so important – it helps filter out distractions and focus on identifying institutional activity.
Spotting Large Orders and Hidden Liquidity
A major issue with standard footprint charts is that they show every trade, regardless of size. For example, a single institutional order of 500 contracts looks the same as fifty smaller 10-lot retail trades. Without features like "Filtered Volume" or "Big Trade" highlights, traders are left scanning through endless data in search of real institutional activity.
Institutional players often use iceberg orders – large limit orders that only reveal a small portion on the visible order book. These hidden orders can absorb aggressive market activity, causing the price to stall even when volumes are high. Gleb Kabanov, Analyst and Managing Trader at LiteFinance, explains:
"Absorption occurs when a large volume of aggressive orders enters the market, but the price fails to move… because a large volume of sell limit orders is placed at the level".
Standard footprint charts, which only show executed trades, miss this key "effort without result" signal. Tools like heatmaps or Depth of Market (DOM) overlays are necessary to spot where institutional orders are positioned.
Separating Market Noise From Real Activity
Another challenge with standard footprint charts is the sheer amount of data they display. When every price tick and candle is given equal weight, traders may overanalyze minor fluctuations. For instance, a small delta difference during a quiet period can look as important as a significant move during a key session high. Without color-coded volume intensities or delta filters, traders are forced to manually interpret every number. On high-volatility instruments like the NASDAQ, a one-tick-per-row setting can create a flood of insignificant rows that bury meaningful activity. As TRADEPRO Academy notes:
"The darker delta colors suggest low difference in volume. It’s not really that important. We want to notice where the large differences are".
Standard charts don’t provide this distinction automatically, making it harder to focus on what matters.
Seeing Delta Changes and Order Imbalances
Identifying order imbalances – where buying or selling pressure dominates specific price levels – requires precision. These imbalances are calculated by comparing the ask volume at one price level to the bid volume at a nearby level, often looking for a ratio of 3:1 or higher. Manually tracking these across multiple levels is tedious and prone to mistakes. Professional traders often set a 300% threshold to detect significant imbalances. Even more critical are stacked imbalances, which occur when three or more consecutive price levels show heavy one-sided pressure. Spotting these manually is nearly impossible without automated tools.
Without features to highlight these imbalances, traders either drown in data or miss the key signals they need to time their trades effectively. These limitations highlight why tailored features are essential for identifying critical order flow signals.
How Customization Fixes These Problems
Customization directly tackles the challenges of hidden liquidity, market noise, and order imbalances mentioned earlier. These issues aren’t inherent to footprint charts – they often arise from default settings. Modern trading platforms offer a range of adjustments, from column layouts and delta colors to volume filters and visual overlays, transforming cluttered charts into precise tools for identifying institutional activity.
Adjusting Column Layouts and Price/Volume Settings
Switching between Bid-Ask, Volume, and Delta layouts can help traders highlight specific market signals. For example, the Bid-Ask layout is ideal for spotting imbalances through diagonal comparisons, while the Volume layout emphasizes the Point of Control (POC) – the price level with the highest traded liquidity. As FuturesHive explains:
"While traditional candlestick charts only show price movement, footprint charts reveal the actual battle happening at each price level: who’s buying aggressively, who’s selling, where institutions are absorbing orders, and which side is winning".
Traders can also set minimum volume thresholds – say 50 to 100 contracts – to filter out smaller retail trades. This "cleans up" the chart, focusing on significant institutional activity. On the S&P 500 E-mini (ES), absorption often occurs when 800–1,500+ contracts trade at a single price without a breakout. For the Nasdaq-100 (NQ), this threshold is typically 2,000–4,000+ contracts. These layout adjustments, combined with other customizations, make it easier to spot key imbalances.
Customizing Delta Colors and Filters
Adjusting delta colors with gradients makes it easier to gauge the intensity of buying and selling pressure. Bright colors like green or red highlight significant delta differences, while darker shades indicate low differences, often considered market noise. Many platforms also offer "Filtered Volume" features, which remove smaller trades below a set threshold, helping traders concentrate on institutional-sized transactions.
Delta filters take this a step further by isolating high-impact trades. For instance, a common setting identifies imbalances where one side’s volume is at least three times the other (300%). Traders can customize this ratio and adjust color intensity – such as brighter green for a 5:1 ratio – to pinpoint aggressive buyers or sellers overwhelming hidden limit orders. Large delta prints at price extremes that fail to move the price may indicate trapped traders, signaling potential reversals. These visual adjustments can also trigger automated alerts, ensuring traders don’t miss critical order flow changes.
Adding Volume Profiles and Heatmaps
Combining volume profiles and heatmaps with footprint charts provides a clearer view of market structure. Volume Profile shows the "where" by mapping Value Areas and the POC, while footprint charts reveal the "when" through real-time execution and imbalances. As GrandAlgo puts it:
"Volume Profile provides the map. Footprint provides the real-time confirmation".
Heatmaps further enhance this by visualizing resting limit orders, helping traders anticipate absorption before it appears as executed volume on footprint charts. This pairing identifies liquidity traps – areas where high delta or volume aligns with key resistance levels but fails to move the price, signaling absorption. For example, stacked imbalances (three or more consecutive price levels with 3:1+ buying/selling ratios) show a 75–80% win rate on ES/NQ futures when they occur at major Volume Profile levels like the Value Area High (VAH) or Low (VAL). Using these filters helps traders focus on imbalances that reflect institutional conviction.
Setting Up Filters and Alerts
Custom filters and alerts are invaluable for highlighting large orders and key market events. Tools like "Smart Tape" or "Big Trades" filter out minor transactions, showing only institutional-sized trades. Alerts can also be tailored to match chart visuals, reducing the need for constant screen monitoring. Traders should pay attention to the POC within a footprint bar, confirming whether the delta aligns with the bar’s sentiment. Advanced tools like Bookmap refresh liquidity heatmaps up to 40 times per second, capturing real-time shifts in the order book. Alerts can notify traders when large resting orders appear or vanish at critical levels. These features turn footprint charts into powerful tools for identifying institutional activity with precision.
Platforms With Advanced Customization Features
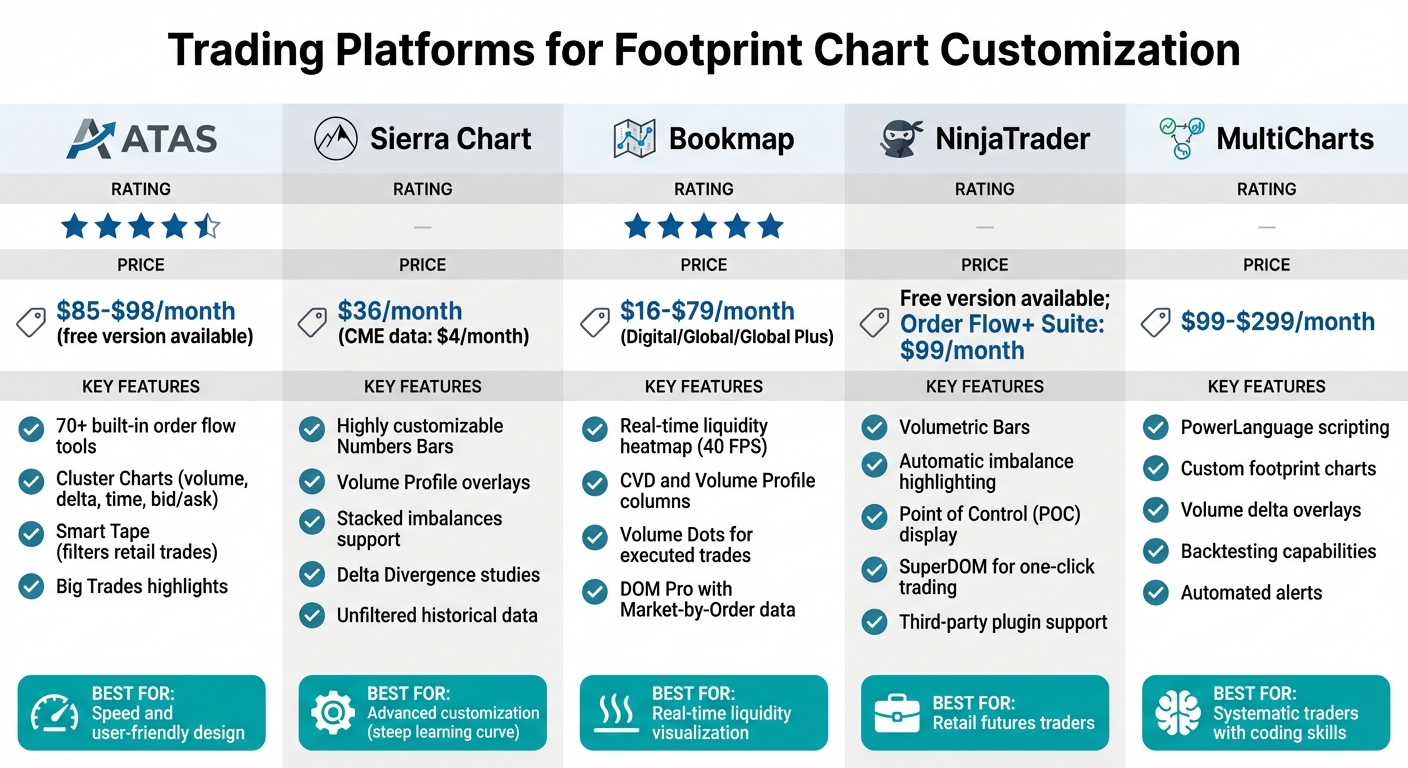
Trading Platform Comparison for Footprint Chart Customization
Trading platforms differ significantly in how much customization they allow for footprint charts. Some stick to basic setups, while others let traders dive deep with features like delta color adjustments and real-time liquidity heatmaps. Below are platforms that stand out for their ability to cater to various trading styles and technical needs, offering tools to tackle order flow challenges.
ATAS, Sierra Chart, and Bookmap
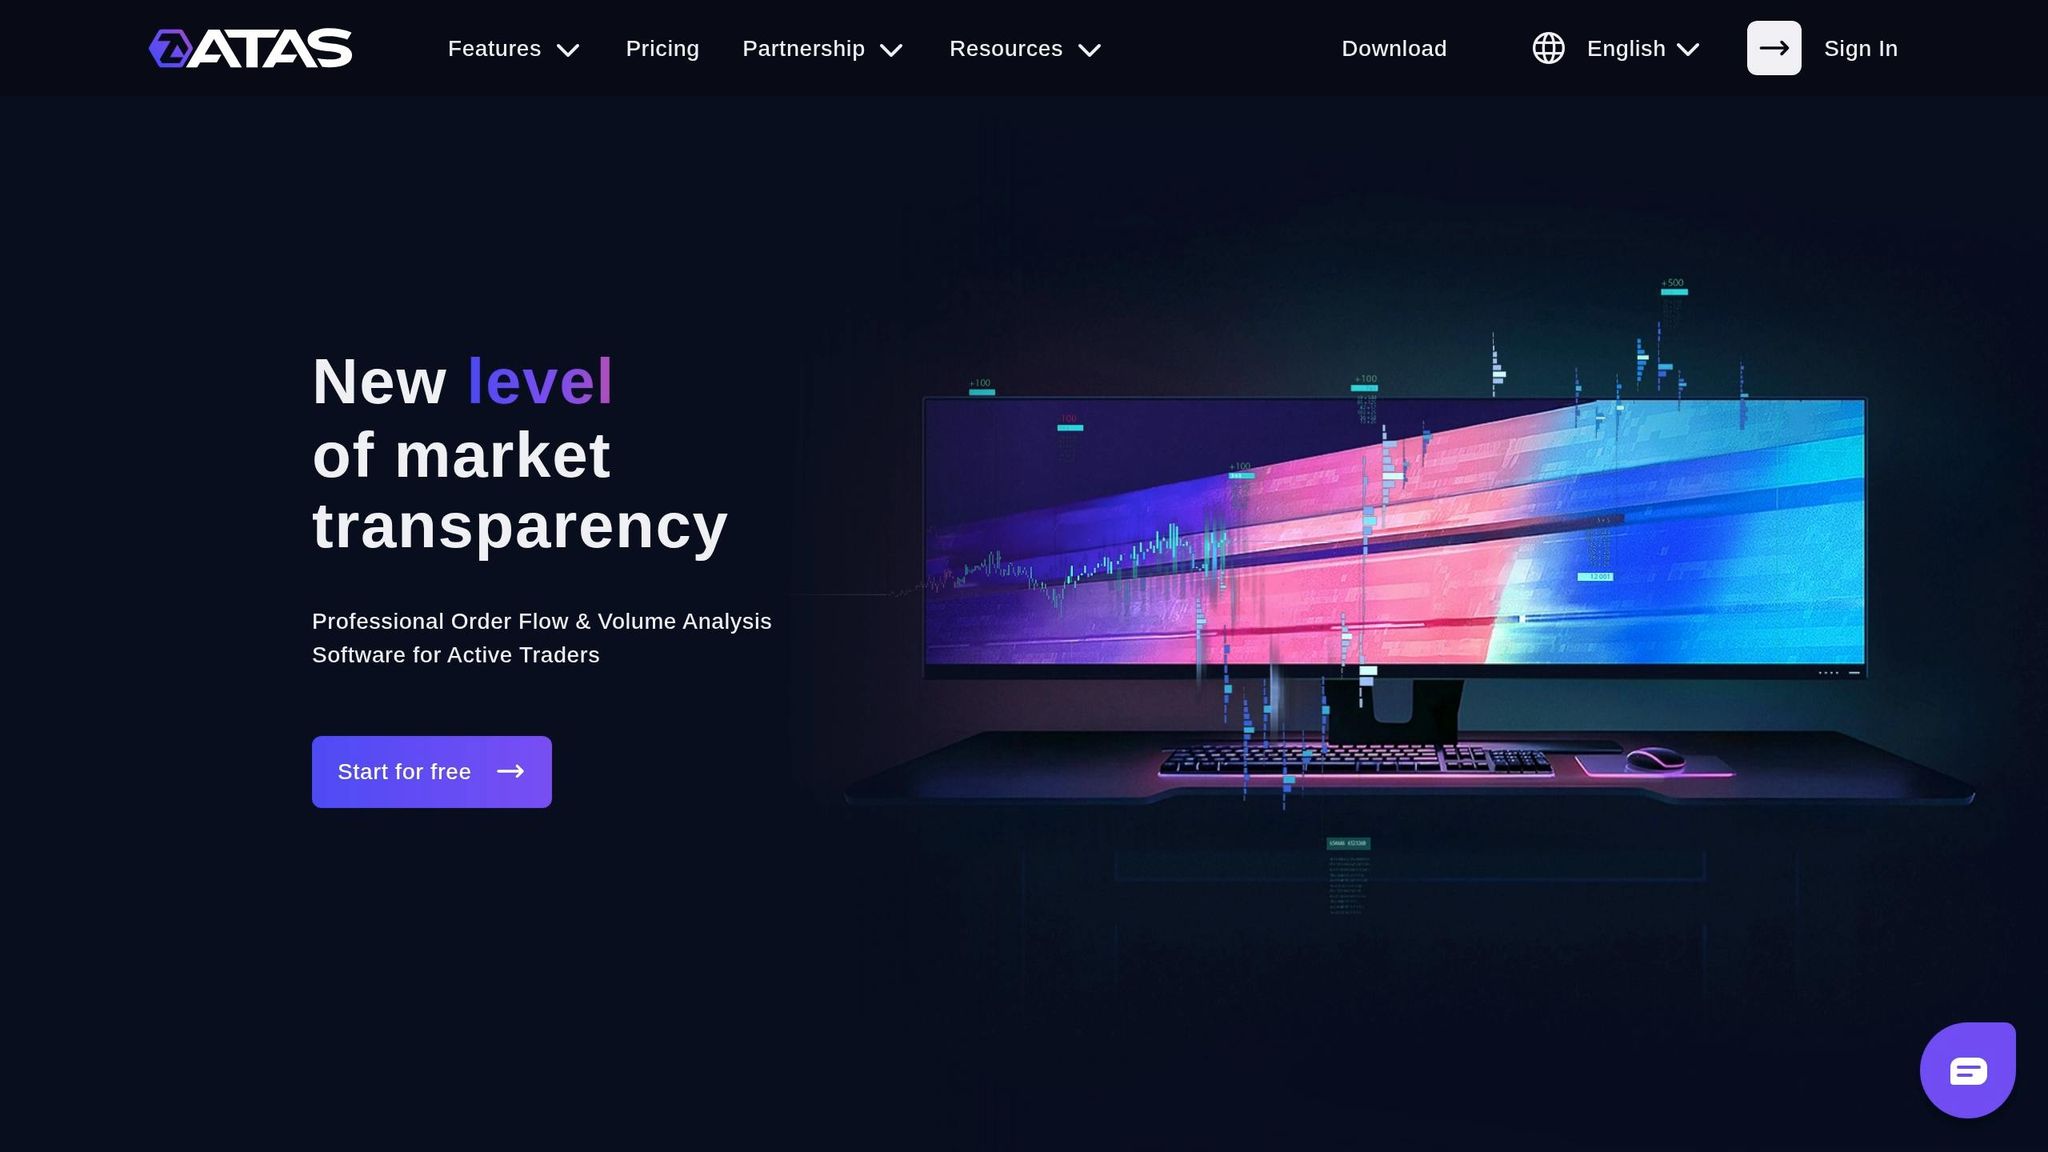
ATAS (Advanced Trading Analytical Software) is praised for its speed and user-friendly design, offering over 70 built-in order flow tools. Its Cluster Charts combine data like volume, delta, time, and bid/ask into customizable layouts, making institutional order flow easier to understand. Features like Smart Tape, which filters out smaller retail trades, and Big Trades, which highlights large institutional orders, add to its appeal. ATAS has a 4.5/5 rating and costs around $85–$98 per month, with a free version also available.
Sierra Chart stands out for its Numbers Bars, which are highly customizable for footprint analysis. Users can tweak background types, such as adding Volume Profile overlays or full background coloring, and set up coloring methods based on bid/ask volume percentages. Advanced studies like stacked imbalances and Delta Divergence are also supported. While Axia Futures notes that Sierra Chart’s interface can be overwhelming for beginners – especially for complex studies like the Footprint chart – Trader Dale highlights its strengths, saying, "The upside, however, is that they have really good, unfiltered historical data." Sierra Chart costs about $36 per month, with CME data available for as little as $4 per month through broker-funded plans.
Bookmap is all about real-time liquidity visualization. Its heatmap updates at an impressive 40 frames per second, and it incorporates tools like CVD, Volume Profile columns, and Volume Dots to display executed trades. The platform’s DOM Pro tool offers Market-by-Order (MBO) data, showing how prices interact with resting limit orders. According to Bookmap:
"Bookmap is built specifically to visualize order flow in real time. Unlike traditional charts or indicators, it reveals how price interacts with liquidity."
Pricing for Bookmap ranges from $16 to $79 per month, depending on the plan (Digital, Global, or Global Plus), and it boasts a 5/5 rating for its liquidity visualization tools.
NinjaTrader and MultiCharts

These platforms offer even more customization options, including scripting capabilities.
NinjaTrader features Volumetric Bars as part of its Order Flow + Suite. These bars can be customized to display delta at each price level, highlight imbalances automatically, and show the Point of Control (POC). The SuperDOM tool enables one-click trading and provides real-time views of resting orders. Additionally, NinjaTrader supports third-party plugins for enhanced visuals, making it a favorite among retail futures traders. A free version is available, but the full Order Flow + Suite costs $99 per month.
MultiCharts shines in its scripting abilities. Using PowerLanguage, traders can design fully customized footprint charts and volume delta overlays tailored to their strategies. This flexibility allows for precise automation and better insights into order flow. It’s a great choice for systematic traders interested in backtesting or setting up automated alerts. Pricing ranges from $99 to $299 per month, depending on the subscription tier. While it requires more technical expertise than plug-and-play platforms, MultiCharts offers unparalleled control for traders comfortable with coding.
Using Customized Footprint Charts in Your Trading
Footprint charts are incredibly effective when traders can interpret key signals at the right moments.
Scalping and Day Trading
For short-term traders, stacked imbalances are a crucial indicator of aggressive institutional activity. When three to five consecutive price levels show a volume imbalance of at least 300%, it signals strong directional pressure. Scalpers often aim for quick profits of 3–5 ticks while keeping stop losses tight at 1–3 ticks.
Another key signal is when aggressive volume fails to push the price further. This typically indicates absorption by a large passive participant defending that level. A delta flip – where delta at a key level switches from negative to positive at support (or the opposite at resistance) – shows that the aggressive side has given up. Exhaustion ratios above 10:1 at candle extremes are another sign that momentum might be fading. For high-volatility instruments like NQ or Gold, grouping ticks manually (e.g., 5–10 ticks per row) and using a 5-minute chart for directional bias along with a 1-minute chart for precise entries can sharpen trading decisions.
These strategies rely on understanding order flow, which is essential for identifying strong support and resistance zones.
Finding Support and Resistance Levels
Integrating Volume Profile overlays into footprint charts helps traders locate high-volume zones that naturally act as support and resistance. Key levels like the Value Area High (VAH), Value Area Low (VAL), and Point of Control (POC) provide structural context for interpreting order flow signals. Typically, the Value Area represents about 70% of the total volume traded.
By combining volume profiles with customized footprint chart signals, traders can identify potential market turning points more effectively. When price revisits these levels, absorption patterns can confirm high-probability reversals. Highlighting standard 3:1 imbalances and more extreme 5:1+ imbalances with bright, high-contrast colors makes it easier to spot aggressive market behavior.
Unfinished auctions – thin tails at price extremes with minimal volume – often act as magnets, suggesting that the market may return to complete the auction. Using tick-based charts, such as a 512-tick chart for ES, instead of time-based charts, helps normalize activity and makes patterns like absorption clearer. Additionally, applying volume filters (e.g., setting a minimum threshold of 50–100 contracts) focuses attention on significant institutional activity.
Managing Risk With Delta Divergence
While timing entries is critical, managing risk is equally important. Delta divergence is a key tool for identifying when aggressive buying or selling pressure is fading, even as price reaches new highs or lows. This indicator often signals that a trend is losing steam or a reversal is on the horizon. For example, if the price hits a new high but delta remains negative, it suggests the upward move lacks strength and could reverse soon.
In September 2025, NASDAQ futures opened with a bullish gap and initially moved higher. Footprint charts revealed large ask volume being absorbed at session highs, and delta shifted dramatically from +3,000 to -1,000 over two candles. This setup prompted a short trade, which led to a 60-point drop.
At major levels, delta divergence confirmed by footprint signals often results in win rates of 70–75%. As AlgoStorm explains:
"Footprints are not magic. They’re a microscope revealing order flow mechanics. The edge comes from interpreting them at critical junctures."
To manage risk, traders often place stops 4–6 ticks beyond the high-volume absorption zone or the extreme of the divergent bar. Customizing features like delta color gradients and filtered volume displays makes it easier to spot these critical zones. Waiting for a delta flip – like a shift from negative to positive at a support level – can confirm that buyers have taken control before entering a long trade. Aligning delta divergence with broader market structures, such as VWAP or previous day highs and lows, helps traders avoid acting on isolated signals.
Conclusion
Customized footprint charts address the shortcomings of standard candlestick setups by allowing traders to refine volume thresholds and imbalance ratios. This adjustment shifts the focus from retail activity to institutional movements, turning raw order flow data into actionable insights that clarify both the mechanics and motivations behind price changes.
The standout benefit? Faster decision-making. Footprint charts offer intracandle timing, revealing aggressive buying or selling as it unfolds – well before a candle closes. This enables traders to identify patterns like absorption, delta divergence, and trapped participants in real time, rather than relying on lagging indicators that confirm past events. These tools not only enhance market clarity but also integrate seamlessly with Volume Profile overlays and advanced tick-based analysis. Platforms such as Sierra Chart (around $36/month) and ATAS ($60–$99/month) make these powerful features available to dedicated traders.
When combined with Volume Profile and tick-based charts, customized footprints can achieve win rates of 70–75% at critical support and resistance levels. The trick lies in interpreting these signals at key moments – where institutional pressure meets liquidity traps – and placing precise stops 4–6 ticks beyond absorption zones.
As AlgoStorm aptly notes:
"The edge is not in the numbers themselves, but in how you interpret them at critical junctures".
FAQs
What footprint settings should I customize first?
To get a better grasp on order flow, start by fine-tuning the bid and ask volume settings and focusing on imbalances. These metrics reveal where the market is leaning. Pay close attention to noticeable imbalances – like ratios of 3:1 or higher – as they often signal strong buying or selling pressure. By tweaking these settings, you can better spot aggressive market participants and potential price reversals, giving you a sharper view of how the market is moving.
How do I spot absorption or iceberg orders on a footprint chart?
To spot iceberg orders, pay attention to liquidity that keeps reappearing at the same price, a slowdown in momentum during periods of heavy trading, or consistent fills at a single price level – these are telltale signs of large hidden orders. When it comes to absorption, look for areas with high trading volume but little price movement. This often indicates that large limit orders are absorbing aggressive market orders. Tools like footprint charts can be especially helpful, as they provide a clear visual representation of hidden liquidity and areas of absorption.
What imbalance threshold should I use for stacked imbalances?
In order flow analysis, a 3:1 or higher ratio is often used as a threshold for stacked imbalances. This indicates a notable difference between buying and selling volume at a specific price level. Traders use this ratio to pinpoint key areas of interest, helping them identify potential trading opportunities more effectively.