
Retail sales data is a key monthly report for futures prop firm traders, offering insights into consumer spending, which drives about two-thirds of the U.S. GDP. Released by the U.S. Census Bureau around the 13th of each month at 8:30 AM ET, this report influences treasury bonds, equity indices, and currency futures by signaling economic momentum or inflation risks.
Key takeaways:
- What to Watch: Focus on "headline", "core", and "control group" data for a clearer economic picture.
- Timing: Be prepared to act within 30 seconds of the release to capitalize on market movements.
- Preparation: Review prior reports, forecasts, and key metrics like the Consumer Price Index (CPI) to assess real consumer spending versus inflation.
- Execution: Use precise strategies, such as setting stop-losses and monitoring technical indicators, to manage volatility effectively.
Retail sales data is not inflation-adjusted, so cross-referencing with CPI is critical to understanding whether growth reflects real demand or price increases. By following a structured checklist, traders can navigate this high-impact event with confidence.
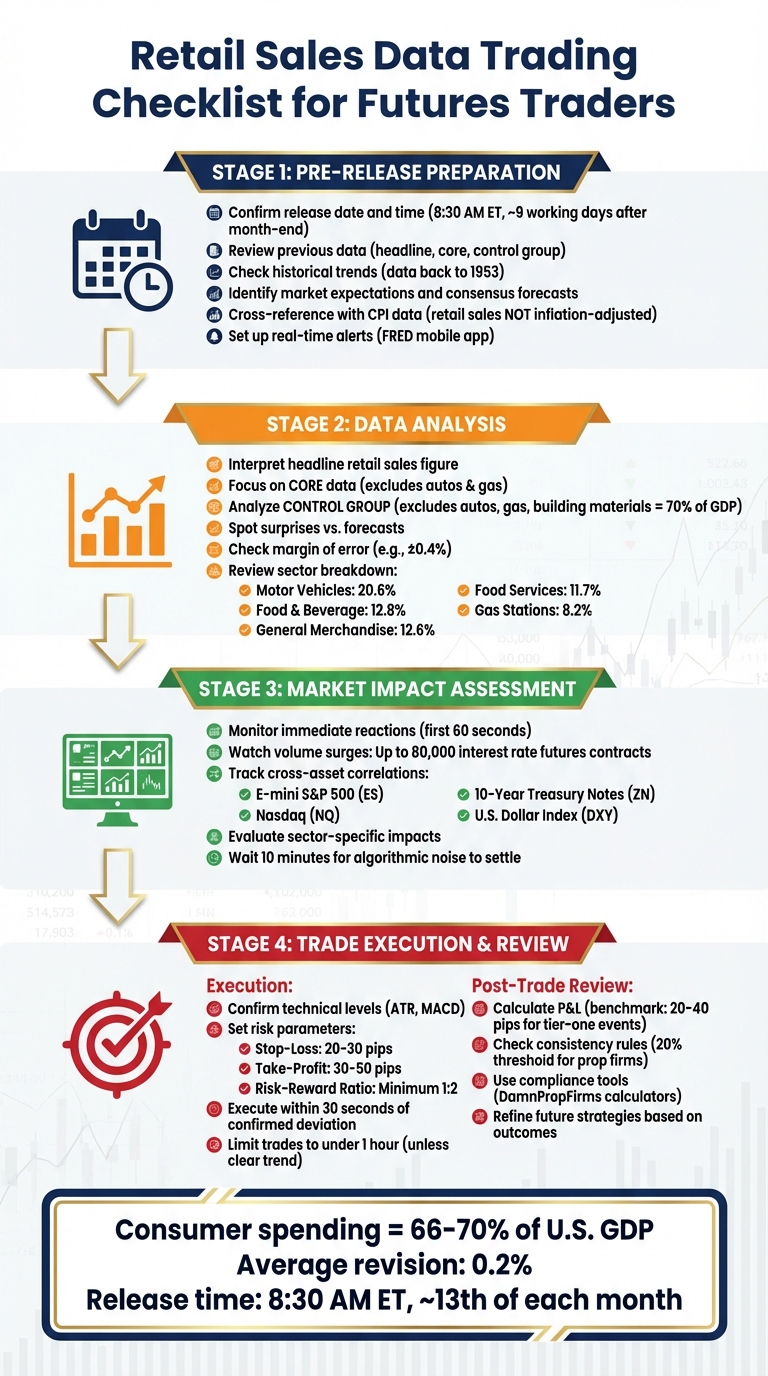
Retail Sales Data Trading Checklist: 4-Stage Process for Futures Traders
Retail Sales Explained
sbb-itb-46ae61d
Pre-Release Preparation Checklist
If you’re relying on retail sales data to shape your trading strategy, getting your pre-release preparation right is essential. Here’s how to set yourself up for success.
Confirm the Release Date and Time
Start by double-checking when the data will be published. The U.S. Census Bureau releases the Advance Monthly Sales for Retail and Food Services (MARTS) report at 8:30 AM ET, usually about nine working days after the end of the reference month. The Census Bureau’s Economic Indicator Calendar is your go-to resource for confirming these dates, available in both List and Quick View formats.
For 2026, some dates, especially mid-year, may still be marked as "TBD" until finalized. For example, the December 2025 data was published on February 10, 2026, while the April 2026 report is scheduled for May 14, 2026, at 8:30 AM ET. To avoid missing any last-minute updates, consider using tools like the FRED mobile app, which sends real-time alerts for key economic indicators.
"Advance Monthly Retail Sales reports are released about 9 working days after the close of the reference month. They contain the advance estimates for the reporting month and preliminary sales data for the previous month."
– U.S. Census Bureau
For traders who rely on precise timing, especially in futures markets, that 8:30 AM release is a critical moment for traders using firms like Topstep.
Review Previous Data and Forecasts
Before the new report drops, it’s smart to revisit last month’s numbers – specifically the headline, core, and control group data. Each new advance report from the Census Bureau includes updated preliminary sales data for the previous month, and these revisions can move markets just as much as the headline figures. On average, revisions are around 0.2%.
For a deeper dive, explore historical data going back to 1953 for MARTS. The Census Bureau provides "Retail and Food Services Sales" Excel files, which can help you spot long-term trends and seasonal patterns. Monthly sales, for instance, fluctuate between $358 billion and $469 billion depending on the time of year. Breaking this data down by categories – like nonstore retailers or food services – can help you pinpoint which sectors are driving the numbers. This analysis is especially useful for predicting the performance of retail-heavy equity indices or related commodities, a key skill covered in our futures prop firm guides.
Armed with historical data and forecasts, you’ll be better equipped to gauge market sentiment and anticipate surprises.
Identify Market Expectations
Market movements often depend on the "surprise factor" – how much the actual data deviates from consensus forecasts. The Census Bureau provides a margin of error for its advance estimates (e.g., ±0.4% for December 2025), which can help you determine if a change is statistically significant or just noise. Use this information to fine-tune your trading strategy for entries and exits immediately after the release.
Compare consensus forecasts from sources like Bloomberg or Reuters with the Census Bureau’s commentary. If the report describes figures as "virtually unchanged", it typically means the data falls within the statistical noise threshold. On the other hand, any significant deviation from trends can trigger strong market reactions.
"The Federal Reserve Board uses the estimates to anticipate economic trends. The Council of Economic Advisors uses the estimates for economic policy analysis."
– U.S. Census Bureau
It’s worth noting that retail sales data isn’t adjusted for inflation. To get a clearer picture, cross-reference these figures with recent Consumer Price Index (CPI) data. This can help you determine whether growth reflects increased sales volume or just higher prices – a key distinction when predicting Federal Reserve policy changes or shifts in treasury futures.
Data Analysis Checklist
When it comes to real-time data interpretation, preparation is key. Once the 8:30 AM ET retail sales report is released, you need to act quickly. This report is packed with layers of data, and knowing how to prioritize the right numbers can make or break your trading decisions, especially when using instant funding futures prop firms to capitalize on volatility.
Interpret Headline Retail Sales Data
The Advanced Retail Sales figure represents the total dollar value of sales across retail and food establishments. Markets react almost instantly to how this number compares to consensus forecasts. If retail sales exceed expectations, equity index futures often climb, reflecting optimism about company revenues and consumer confidence. On the flip side, falling short of forecasts can trigger a downturn.
However, the headline number isn’t the full story – it includes all sectors, which makes it susceptible to swings from more volatile categories. For example, motor vehicle and parts dealers contribute a hefty 20.6% to the report, while gas stations account for 8.2%. A surge in gas prices or a strong month for auto sales can skew the overall figure. That’s why digging into core and control group data is essential for a clearer picture.
Focus on Core and Control Group Data
While the headline figure grabs initial attention, core retail sales (which exclude autos and gas) and the control group are what seasoned traders focus on. The control group strips out receipts from sectors like auto dealers, gas stations, and building-materials retailers, offering a more accurate measure of consumer spending – an area that drives about 70% of U.S. GDP.
This metric can reveal underlying trends that the headline figure might obscure. For instance, strong control group data typically signals bullish momentum for equity index futures and bearish pressure on treasury futures, as it hints at the Federal Reserve maintaining higher rates for longer.
Take December 2025 as an example: while the headline figure showed no growth, nonstore retailers (e-commerce) surged 5.3% year-over-year. Such sub-sector trends can highlight shifts in consumer behavior. For instance, robust e-commerce growth may benefit tech-heavy indices like the Nasdaq (NQ), while declines in discretionary categories could raise red flags for broader markets.
One key point to remember: retail sales data isn’t adjusted for inflation. If the headline figure shows a 0.5% increase but the Consumer Price Index (CPI) for goods rose 0.6% in the same period, real consumer spending actually contracted. Pairing retail sales data with CPI figures helps determine whether growth reflects actual demand or just higher prices.
Once you’ve analyzed the core data, the next step is spotting market surprises.
Spot Surprises and Market Trends
The real trading opportunities often arise from surprises, which is why many traders utilize funded trading accounts to manage risk during high-impact news events. Markets generally bake in consensus expectations, so deviations from these projections can lead to sharp moves in equity index futures, treasury futures, and commodities.
To identify surprises, compare the Census Bureau’s official release with projections from tools like the Chicago Fed Advance Retail Trade Summary (CARTS). CARTS leverages high-frequency data from sources like Bloomberg Second Measure and SafeGraph to forecast retail sales a day before the official release. For example, on February 17, 2026, CARTS predicted a -0.1% drop in January 2026 retail and food services sales (excluding autos) on a seasonally adjusted basis. Any significant deviation from such projections can signal major market shifts.
Sector-specific surprises also matter. Even if the headline figure aligns with expectations, a notable deviation in a particular category can create trading opportunities. These trends can guide you in positioning trades in related equity sectors or commodities.
Keep in mind that the Census Bureau includes a margin of error in its advance estimates. For December 2025, this margin was ±0.4%. If the reported change falls within this range, it’s considered “virtually unchanged” and statistically insignificant. In such cases, dig deeper into sub-sectors and control group data to uncover meaningful insights.
| Retail Category | Weight in Report (%) | Volatility Drivers |
|---|---|---|
| Motor Vehicle & Parts Dealers | 20.6% | Seasonality, high unit cost |
| Food & Beverage Stores | 12.8% | Raw goods prices, seasonality |
| General Merchandise Stores | 12.6% | Consumer confidence, holidays |
| Food Services & Drinking Places | 11.7% | Disposable income, weather |
| Gas Stations | 8.2% | Global oil price fluctuations |
Source: CME Group
Market Impact Assessment Checklist
Building on earlier insights from control group and sub-sector data, the next step is to analyze how these signals influence market-wide reactions.
Monitor Immediate Market Reactions
Start by assessing real-time market responses. Look closely at immediate price movements and trading volume to determine if the data is sparking a lasting trend or just a short-lived spike.
Within the first 60 seconds after a release, a one standard deviation surprise can lead to trading surges of up to 80,000 additional interest rate futures contracts and 6,766 FX futures contracts.
"Traders, and their algorithmic tools, immediately compare the actual figures versus consensus market forecasts. The difference, often called the ‘surprise,’ can trigger volatility." – Erik Norland and Oliver Andrews, CME Group
Pay close attention to Time & Sales data, particularly for bid/ask imbalances in contracts like the E-mini S&P 500 (ES), Nasdaq (NQ), and 10-Year Treasury Notes (ZN). For instance, if the control group data exceeds expectations, ES and NQ often rise as traders respond to stronger consumer spending signals, while ZN may decline as bond yields increase due to tighter Fed policy expectations.
Many traders using top futures prop firms prioritize capital preservation during these volatile windows. However, resist the urge to trade too early. The first 10 minutes post-release typically feature high algorithmic activity, making it difficult to confirm market direction. Waiting for this initial noise to settle allows institutional traders’ actions to clarify whether the movement has momentum. Once the immediate reaction is understood, broaden your focus to examine cross-asset effects and the overall market impact.
Evaluate Sector and Global Correlations
Next, analyze how retail sales data influences other asset classes. Since consumer spending accounts for over 66% of U.S. economic activity, strong retail sales figures often support a bullish outlook for the U.S. Dollar Index (DXY) and interest rate futures, signaling economic strength and potential inflationary pressures.
Sector-specific effects also play a crucial role. For example, robust growth in nonstore retailers (e-commerce) tends to benefit tech-heavy indices like the Nasdaq. On the other hand, if gas station sales rise due to higher crude oil prices, check crude oil futures (CL) for correlation. Gas stations make up 8.2% of the retail sales report, and elevated oil prices can weigh on consumer confidence, reducing discretionary spending.
Here’s a quick reference table summarizing asset-specific impacts of retail sales data:
| Asset Class | Relative Impact of Retail Sales | Primary Driver of Volume |
|---|---|---|
| Interest Rate Futures | 2nd Highest | Employment (NFP) |
| FX Futures | 2nd Highest | Employment (NFP) |
| Equity Index Futures | Moderate | Inflation (CPI/Core CPI) |
Source: CME Group
It’s worth noting that equity index futures often react more strongly to inflation data, like CPI, than to retail sales. For instance, if retail sales show solid growth but CPI data suggests inflation is cooling, market reactions may be subdued. Cross-referencing retail sales data with recent employment and inflation reports can help identify whether the data aligns with broader economic trends or is just a short-term fluctuation.
Trade Execution Checklist
Once you’ve completed your pre-release analysis and evaluated the market impact, the next step is executing trades with precision. The aim is to take positions based on confirmed technical signals while keeping risk under tight control – especially during the volatile period following the 8:30 AM Eastern Time retail sales release.
Confirm Technical Levels and Indicators
Start by marking critical reference points on your 5-minute and 15-minute charts. These include key levels like the Day Open, Week Open, and previous highs and lows, which can act as support or resistance zones where price might stall or reverse.
Use the Average True Range (ATR) to gauge volatility. For example, if the Day Open is 4,500 and the ATR is 50 points, it suggests a trading range between 4,450 and 4,550. Also, monitor the MACD indicator – converging lines may signal that momentum is fading, while diverging lines suggest the trend is gaining strength.
"The retail sales number is a crucial data point in the United States and its release is one of the most market-moving events of the month."
– CME Group
Another approach is to set buy and sell stops just above and below the current price to execute a non-directional straddle strategy.
With technical levels identified, clearly define your risk parameters to ensure disciplined execution, a practice emphasized by firms like Take Profit Trader.
Set Risk and Reward Parameters
Before entering a trade, decide on your position size and risk-reward ratio. For trades related to retail sales data, aim for profits of 30–50 pips with stop-losses of 20–30 pips. This ensures a minimum risk-reward ratio of 1:2.
| Parameter | Conservative News Trade | Extended Trend Trade |
|---|---|---|
| Stop-Loss | 20–30 pips | 20–30 pips |
| Take-Profit | 30–50 pips | End of NY Session |
| Time Horizon | Under 1 hour | Full trading session |
| Strategy | Straddle / Scalp | Directional Bias |
Place your stop-loss just below the low of the initial spike candle. If the retail sales data triggers a strong trend, consider holding your position until the New York session ends, when volatility typically eases. As Larry Hite put it:
"Only you control how much of your limited supply of money you are willing to lose."
– Larry Hite
Stay flexible and adjust your approach as market conditions evolve.
Adapt to Market Volatility
Retail sales releases often cause sharp, unpredictable price swings – especially when the actual figures significantly exceed or fall short of institutional forecasts. To take advantage of these moves, execute trades within the first 30 seconds once a substantial deviation is confirmed.
Keep an eye on data revisions, as they can reverse market sentiment. For instance, a downward revision (e.g., December 2025’s $735.0 billion) might shift the market direction. Always verify revisions before committing to trades.
Adjust your strategy based on how the market reacts. Positive retail data often sparks "risk-on" sentiment, leading traders to sell the U.S. Dollar and buy equities or EUR/USD. Conversely, disappointing results usually drive safe-haven flows into the dollar. When trading futures like the E-mini S&P 500 (ES) or Nasdaq (NQ), aligning your trades with the prevailing market sentiment can improve your chances of success. Many traders use an Apex Trader Funding discount to access larger capital for these high-volatility setups.
Finally, limit news-driven trades to under an hour unless a clear, extended trend emerges.
Post-Trade Review Checklist
Closing a trade is just the beginning of the learning process. A thorough post-trade review helps you pinpoint what worked, what didn’t, and how to improve your strategy for the next retail sales release.
Calculate P&L and Review Trade Outcomes
Start by recording your profit and loss (P&L) in both dollars and pips. Compare your results to the standard 20–40 pip benchmark for tier-one economic events. If your performance fell short, dig deeper into the details.
Evaluate your entry timing and stop-loss placement. If your execution exceeded 30 seconds or your stop-loss triggered despite being below the initial spike, consider whether a market whipsaw or a misstep in your strategy played a role.
Pay special attention to the "surprise" factor. According to FinancialSource:
"Significant deviations from expectations can lead to immediate market reactions".
A true market shock happens when the data exceeds the high estimate or drops below the low estimate of institutional forecasts. Document the deviation and compare it to the market’s pip movement to gauge the impact of unexpected data.
Revisions also matter. For instance, the U.S. Census Bureau notes:
"The average absolute revision to the advance estimate is now two-tenths of one percent".
Take February 10, 2026, as an example: December 2025 sales hit $735.0 billion, while the October-to-November 2025 percent change stayed at 0.6%. If revisions contradicted the headline figure, they might have influenced your initial P&L.
| Analysis Factor | Professional Benchmark | Purpose |
|---|---|---|
| Execution Speed | Within 30 seconds | Capture initial volatility |
| Profit Target | 20–40 pips | Standard for tier-one events |
| Stop-Loss Placement | Below initial spike candle | Protect against whipsaws |
| Surprise Threshold | Outside high–low forecast range | Identify genuine market shocks |
Once you’ve quantified your trade’s performance, shift your focus to ensuring compliance with prop firm requirements.
Use DamnPropFirms Tools for Compliance

After evaluating your trade, it’s time to check compliance and consistency metrics. If you trade with a futures prop firm, meeting consistency rules is critical for payouts. Most firms enforce a 20% consistency threshold, meaning no single trading day can exceed 20% of your total profit target. For example, if your highest profit day was $1,200, your total account balance must be at least $6,000 to stay eligible.
Tools like the Futures Consistency Rule Calculator from DamnPropFirms can help verify your payout eligibility. If you’re using Tradeify, note that Lightning Accounts purchased after September 12, 2025, follow a gradual consistency rule: 20% for the first payout, 25% for the second, and 30% for subsequent payouts. Meanwhile, Alpha Futures enforces stricter rules – 50% during evaluation and 40% for qualified accounts.
For ongoing tracking, the TradeSyncer Copy Trader offers built-in analytics and a trading journal. This tool supports accounts like Apex Trader Funding and Tradeify. By monitoring consistency metrics in real time, you can avoid violations that might delay payouts. These steps are crucial for traders relying on platforms like DamnPropFirms to meet benchmarks and secure their earnings.
Refine Future Strategies
Now, use your performance review and compliance check to fine-tune your strategy. Analyze your trade journal for recurring patterns, compare market reactions to headline versus control group data, and factor in seasonal trends or macroeconomic indicators like unemployment rates and corporate earnings.
Look for connections between your trade outcomes and broader economic signals. For example, review how the market reacted to retail sales surprises and whether the headline figure or control group (excluding autos, gas, and building materials) drove price movements.
Keep an eye on major retailers’ performance to validate retail sales trends. If the Federal Reserve emphasized consumer spending during your trade, this could explain increased volatility and its impact on your P&L. Use tools like the City Economic Surprise Index or CFTC reports to confirm if you traded the most volatile contract for that release.
Lastly, account for seasonal influences. During holiday periods (Q4), analyst expectations often carry more uncertainty, which can lead to larger revisions and volatility spikes. Adjust your forecasts accordingly, and consider how sectors like gas and food respond to changes in weather or raw commodity prices. These reflections will help you improve your execution for future retail sales events.
Conclusion
Key Takeaways for Futures Traders
Successful retail sales trading hinges on disciplined preparation, accurate execution, and thorough post-trade analysis. The outlined checklists – from pre-release setup to post-trade evaluation – serve as the foundation for navigating these trades. With consumer spending making up a significant portion of GDP, US Retail Sales remains a crucial driver of market activity.
Start by determining if the Federal Reserve is currently prioritizing consumer spending data, as this can dramatically affect market volatility. Instead of relying solely on consensus forecasts, focus on high-low institutional ranges to identify true market shocks when reported figures stray significantly from expectations. Pay close attention to Core Retail Sales (excluding autos, gas, and building materials) and any recent revisions, as these provide a clearer picture of market trends.
When executing trades, speed is essential. Professional traders often act within 30 seconds of a major data surprise, aiming for profits of 20–40 pips during tier-one events. To manage risk, set stop-loss orders just below the initial price spike to guard against sudden reversals. Additionally, keep an eye on the Census Bureau’s 90% confidence interval to assess whether changes are statistically meaningful or merely negligible.
These steps, combined with the checklist’s structured approach, help traders respond effectively to market volatility.
Resources for Continued Improvement
Execution is just one part of the equation – continuous learning and the right tools are equally critical for long-term success. Platforms like DamnPropFirms offer valuable resources to refine your strategy and ensure compliance. For example, the Futures Consistency Rule Calculator helps traders meet payout eligibility requirements, especially when working with firms like Apex Trader Funding, Tradeify, or Alpha Futures.
These tools align seamlessly with the checklist framework, enabling traders to fine-tune their strategies while staying compliant. For those eager to dive into trading immediately, options like instant funding from Lucid Trading provide a quick start. Additionally, detailed guides on how prop firms work can help you identify platforms best suited for high-volatility trading approaches.
FAQs
Which retail sales number moves futures the most?
The month-over-month (MoM) retail sales figure holds significant sway over futures markets. It represents the total dollar amount of sales across retailers, without adjusting for inflation. Due to its tendency to fluctuate sharply, this metric is closely watched and often triggers notable market reactions.
How do I adjust retail sales for inflation using CPI?
To account for inflation in retail sales, you need to adjust nominal sales using the Consumer Price Index (CPI). The formula is:
Real Retail Sales = Nominal Retail Sales / (CPI / 100)
For instance, if nominal sales are $1,000 billion and the CPI stands at 326.588, the calculation would be:
$1,000 / (326.588 / 100) = $306.2 billion
This adjustment provides a clearer picture of sales by removing the effects of inflation.
What’s the safest way to trade the first minute after 8:30 AM ET?
Trading during volatile periods, especially around 8:30 AM ET when major economic data is often released, requires a careful and disciplined approach. Market movements can become unpredictable, so it’s smart to take a step back and observe how the market reacts before making any moves.
To manage risk effectively:
- Start with smaller position sizes to limit potential losses.
- Prioritize strict risk management strategies, like setting stop-loss orders.
- Wait for clear confirmation of the market’s direction before entering trades.
Patience during these moments can make all the difference, helping you navigate the volatility with more confidence.