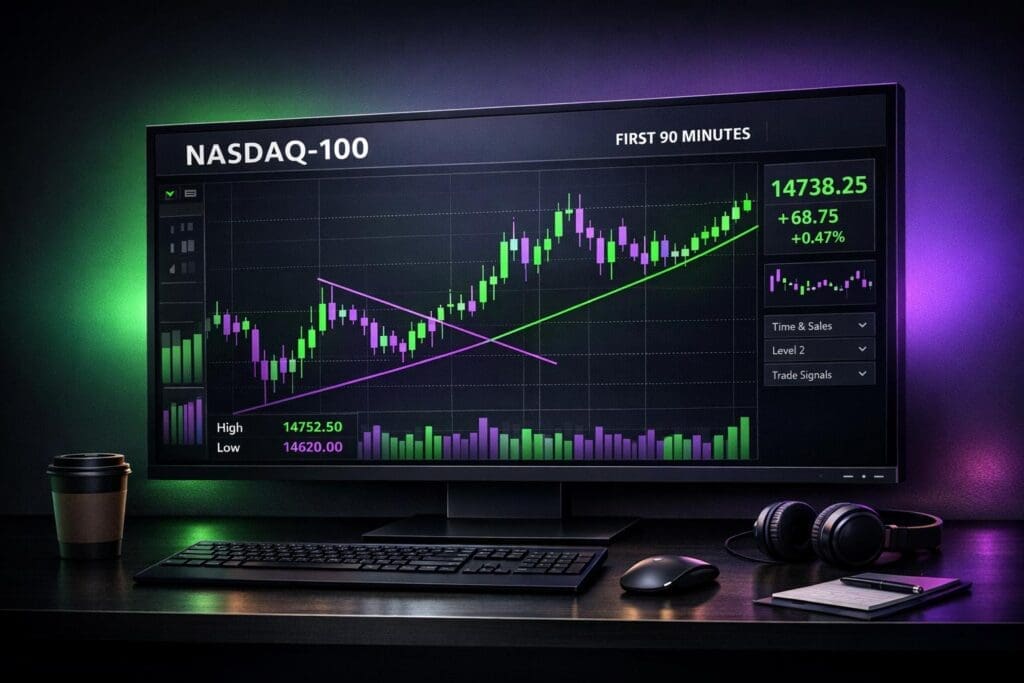
Navigating the first 90 minutes of Nasdaq-100 (NQ) trading can be highly rewarding but equally risky due to intense volatility, institutional orders, and rapid reversals. This guide breaks down how to approach this high-stakes window with a clear, disciplined strategy. Here’s what you’ll learn:
- Why this time matters: The 9:30–11:00 AM ET session sets the market’s tone, with institutions driving price action to create liquidity.
- Common pitfalls: False breakouts, stop runs, and overtrading are frequent traps for traders.
- Key strategies: Focus on identifying the opening range, spotting institutional liquidity hunts, and executing setups like the "Opening Rip" and "Morning Reversal."
- Risk management: Use strict position sizing, daily loss limits, and the "Three Losses" rule to protect your capital.
First 90 Minutes NQ Trading Strategy: Pre-Market to Exit Plan
Pre-Market Preparation: Getting Ready to Trade
Understanding the Pre-Market Window
Between 8:30 and 9:30 AM ET, it’s time to analyze the overnight highs, lows, and any key economic data releases. This helps you decide whether to take a more aggressive or cautious stance for the day. The Nasdaq-100 Pre-Market Indicator (PMI) provides a snapshot of market sentiment by using last sale prices from 8:15 AM to 9:30 AM ET. This tool can help you pinpoint key levels and avoid trades that might not align with your strategy before the high-volume New York open kicks in.
Once you’ve got a sense of timing and sentiment, the next step is to map out critical price levels on your chart.
Marking Key Price Levels on Your Chart
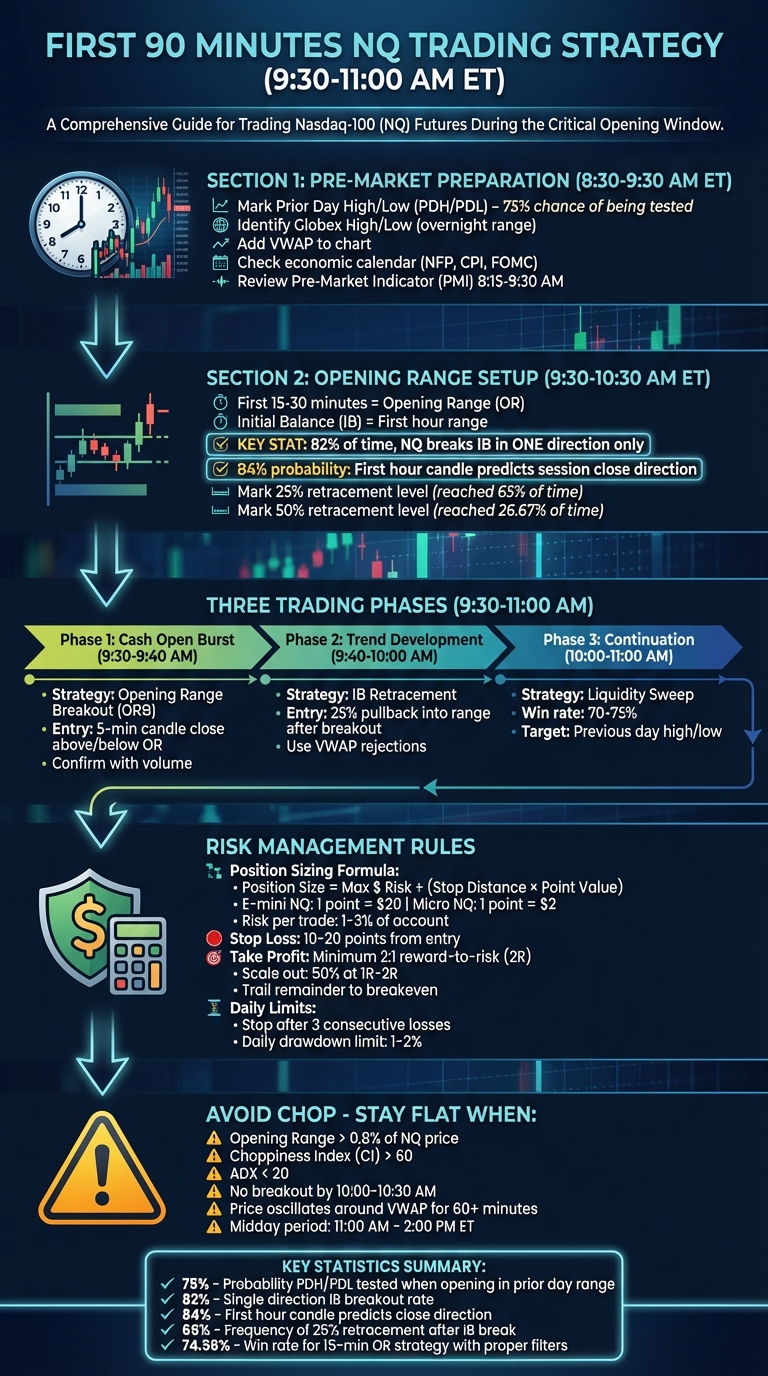
Start by identifying the Prior Day High (PDH) and Prior Day Low (PDL) – these are essential liquidity zones and often serve as profit targets. If the Nasdaq-100 (NQ) opens within the previous day’s range, there’s a roughly 75% chance that one of these levels will be tested during the session. Next, mark the overnight (Globex) high and low, which define the pre-market range. These levels frequently act as support or resistance, particularly during the first 90 minutes of trading.
Another key area to map is the Initial Balance (IB) – the price range formed during the first hour of trading (9:30–10:30 AM ET). Statistics show that 82% of the time, NQ breaks out of the IB range in just one direction, creating what’s called a "single break" day. After the first hour, calculate the 25% and 50% retracement levels within the IB range. The 25% retracement level is reached about 65% of the time following an IB breakout, making it a strong entry zone. Meanwhile, the 50% retracement level – hit only 26.67% of the time – can serve as a solid stop-loss benchmark based on historical data.
Finally, add the VWAP (Volume Weighted Average Price) to your chart. This institutional benchmark helps confirm trend direction and identify potential rejection points.
While technical levels are crucial, don’t overlook the importance of staying on top of economic news.
Checking Economic News and Events
The economic calendar plays a big role in shaping market movements. Pay close attention to major reports like Non-Farm Payroll (NFP), CPI (inflation data), and FOMC announcements. These events often influence Federal Reserve policy and can lead to significant swings in the index. During earnings season, it’s also critical to track the release dates for major companies like Apple, Microsoft, and NVIDIA, as their performance can heavily sway the Nasdaq-100. The key is to separate actionable catalysts from background noise and adjust your risk management accordingly.
"Know your scheduled econ data, central bank speeches, and potential tweet bombs." – TradersMastermind
For instance, on February 5, 2025, the NQ opened within the prior session’s range. By the end of the first hour, the market had closed green, signaling a bullish bias. At 11:05 AM, NQ broke above the Initial Balance high. A trader who entered at the 25% retracement level was able to capture nearly a 4R (reward-to-risk) trade all the way to the previous day’s high. This example underscores the importance of thorough pre-market analysis combined with a clear understanding of the economic landscape.
How to Trade the Opening Range
Setting Up the Opening Range
The opening range (OR) refers to the high and low prices established during a specific window right after the market opens at 9:30 AM ET. For Nasdaq futures (NQ) traders, this window is typically the first 15 or 30 minutes of trading. The 15-minute timeframe strikes a good balance, capturing early momentum while filtering out some of the initial market noise.
To set up the range, mark the highest and lowest prices within your chosen timeframe on your chart. A breakout is considered valid only when a 5-minute candle closes outside these levels – not just when the price briefly touches them.
Volume plays a key role in confirming breakouts. High volume during a breakout often signals strong institutional participation, while low volume suggests the move may lack follow-through and could reverse. To analyze this, you can use a Stochastic Volume Index to compare the current opening volume to the average volume of the last 10–20 days.
"The intraday opening range is most commonly defined as any timeframe within the first 10-minutes of the US Open."
- Faisal, TRADEPRO Academy
Be cautious when the opening range exceeds 0.8% of the NQ price. A range this wide often means the initial move has already run its course. Interestingly, about 35% of the time, the day’s high or low is established within the first 30 minutes of trading.
Once you’ve marked your opening range, the next step is to determine whether the market is trending or stuck in choppy conditions.
Spotting Trends vs. Choppy Markets
After defining the opening range, the next challenge is identifying whether the market is trending or moving sideways. This distinction often comes down to price structure and volume.
In a trending market, you’ll notice a clear pattern of higher highs and higher lows in an uptrend (or lower lows in a downtrend). The price generally stays above (or below) key indicators like the VWAP and the 50 EMA. On the other hand, if the price moves erratically and fails to respect these levels, it’s likely a choppy or range-bound market.
Bar overlap is another telltale sign of choppiness. If more than 20 bars move sideways with overlapping candles, it’s a strong indicator of a range-bound market. Additionally, the "80% Rule" suggests that most breakout attempts – around 80% – fail and reverse back into the range within five bars.
Volume patterns also help clarify market conditions. High or increasing volume during a breakout indicates strong commitment, while fading volume suggests the move lacks strength and might reverse. Market breadth is another useful tool. If the NQ price moves in one direction while advancing-declining issues tell a different story, it’s often a sign of a "Morning Reversal" rather than a sustained trend.
"High volume is an indication of high commitment to a position. The opposite is also true, if the price increases on low volume it indicates that the price is likely to retrace."
A backtested 15-minute opening range strategy for NQ showed a 74.56% win rate when using a 5-minute candle close as the entry trigger and limiting trades to one per day, aligned with the daily trend.
If the indicators point to market weakness, it’s often better to sit on the sidelines.
When to Stay Out of the Market
Sometimes, the smartest move is to avoid trading altogether. For instance, if the opening range exceeds the 0.8% threshold, it often signals an exhausted move. Similarly, if no breakout occurs by 10:00 or 10:30 AM ET, the market may be transitioning into a choppy phase.
Volume divergence during a breakout is another red flag. If volume doesn’t align with the price movement, the breakout is more likely to fail. Additionally, if the NQ price moves in one direction but advancing-declining issues suggest underlying weakness, it may indicate that institutions are distributing or accumulating rather than driving a trend.
Avoid trading around major economic events like CPI, NFP, or FOMC announcements. These events often lead to wider spreads and increased slippage, making trading riskier. It’s a good idea to step aside at least five minutes before and after such releases.
Lastly, stick to the "Rule of Three": after three losing trades in a row, stop trading for the day. This prevents emotional decision-making and helps protect your mental capital. Remember, trading isn’t about taking more trades – it’s about taking better ones.
Entry, Exit, and Risk Management Rules
Entry Methods for Different Market Phases
The first 90 minutes of the trading day can be divided into three distinct phases: the cash open burst (9:30–9:40 AM ET), the trend development phase (9:40–10:00 AM ET), and the continuation phase (10:00–11:00 AM ET). Each phase requires a specific approach to identify high-probability entry opportunities.
During the cash open burst (9:30–9:40 AM ET), institutional traders establish the day’s directional bias. Here, the Opening Range Breakout (ORB) strategy proves effective. Watch for a 5-minute candle to close above or below the high or low of the first 5 or 30 minutes, but only if the volume supports the move. The best trades occur when the breakout aligns with an unfilled Fair Value Gap (FVG). If the FVG fills immediately after the breakout, avoid the trade altogether.
From 9:40–10:00 AM ET, the trend development phase kicks in. Use the Initial Balance (IB) – the range formed between 9:30 and 10:30 AM ET – as your guide. Notably, there’s an 84% chance that the Nasdaq-100 (NQ) will close in the same direction as this first hour’s candle. When the IB high or low breaks, wait for a retracement of about 25% back into the range before entering. This retracement happens 65% of the time, making it a reliable entry signal. In trending markets, look for VWAP rejections paired with order flow confirmation, such as stacked imbalances on a footprint chart, for high-confidence trades.
The continuation phase (10:00–11:00 AM ET) often sees liquidity sweeps. Institutions may push prices beyond the previous day’s high or low to trigger stops before reversing. To capitalize, enter when the price reclaims the swept level with momentum – this setup boasts a 70–75% win rate. If NQ opens within the prior day’s range, there’s a ~75% likelihood it will test either the previous day’s high or low, offering clear directional targets.
Once you’ve identified a valid entry, managing risk becomes the next critical step to safeguard your capital.
Calculating Risk and Position Size
Given the rapid price movements in NQ, precise position sizing is essential. Use the following formula to calculate your position size:
Position size = Maximum dollar risk ÷ (Stop-loss distance in points × Point value)
For E-mini NQ, 1 point equals $20, while for Micro NQ (MNQ), 1 point equals $2. For instance, if you’re risking $200 on a trade with a 10-point stop, you could trade 1 E-mini contract ($200 ÷ (10 × $20) = 1 contract) or 10 Micro contracts to maintain the same risk.
Stick to risking only 1%–3% of your account per trade. At a 2% risk level, you could endure 50 consecutive losses before depleting your account, whereas risking 10% would leave you with only 10 losses. In high-volatility sessions, Micro contracts allow for more precise scaling, especially when the Opening Range is unusually wide.
Set your stop-loss 10–20 points away from the entry, adjusting for volatility. Always use bracket orders (stop-loss and take-profit) before entering a trade to avoid emotional decisions in fast-moving markets.
Proper position sizing lays the groundwork for effective exit strategies.
Managing Exits and Taking Profits
Exiting trades effectively is key to preserving gains and avoiding losses during reversals. Aim for a minimum reward-to-risk ratio of 2:1 (2R). This ensures profitability even with a win rate as low as 40%. A common approach is to scale out by closing half your position at 1R or 2R, then moving your stop-loss to breakeven and trailing the rest to capture larger moves.
Backtesting shows that disciplined execution of high reward-to-risk setups can yield profits of 3R to 4R consistently.
In choppy markets, fixed profit targets are more effective, while trailing stops work better during trending sessions. If the price doesn’t move within a set timeframe or if your setup signal (like an FVG) becomes invalidated, it’s better to exit flat. To protect your capital, set a daily loss limit – stop trading after three consecutive losses or when your account drawdown reaches 1%–2%. This prevents revenge trading and ensures you’re prepared for the next session.
"The goal is not to trade more. The goal is to trade better."
- Joshua Soriano, Quant Matter
How to Avoid Choppy Market Conditions
Using Indicators to Spot Chop
Recognizing choppy market conditions is just as important as mastering entry strategies and risk management. The Choppiness Index (CI) is a handy tool for determining whether the market is trending or stuck in a range. A CI value above 60 signals a range-bound market, while lower values suggest a trend might be forming. Similarly, the Average Directional Index (ADX) helps gauge market strength: readings below 20 indicate a weak or sideways market, whereas values above 25 confirm a strong trend.
Another useful metric is the Average True Range (ATR). When ATR hovers near its 5-day average, it often points to choppy conditions. Additionally, if the VWAP (Volume Weighted Average Price) acts like a magnet – where prices oscillate closely around it without directional momentum – it’s a clear sign the market is in a range-bound phase. Lastly, a Bollinger Band squeeze, where the bands contract tightly, signals low volatility, often preceding a breakout.
These indicators provide a solid foundation for further analysis using market profile techniques.
Applying Market Profile and Volume Profile
Volume Profile charts offer another layer of insight. High-volume nodes (HVN) represent price levels where significant trading has occurred. These areas often act as zones where prices stall and chop. On the other hand, genuine breakouts tend to move swiftly through low-volume areas (LVA).
The Value Area – the range where 70% of trading volume occurred during the previous session – can be especially helpful for spotting balance in the market. If the price opens outside this range but re-enters and holds for at least 30 minutes, there’s about an 80% chance it will move to the opposite side of the range. However, if the price keeps bouncing between the Value Area High (VAH) and Value Area Low (VAL) without breaking out, you’re likely dealing with a choppy market. It’s worth noting that markets spend roughly 80% of the time in sideways or range-bound patterns.
Once you’ve assessed indicators and profile metrics, set clear criteria to avoid trading in unfavorable conditions.
Rules for Staying Flat
To avoid unnecessary losses, apply a "Go/No-Go" filter before entering any trade. For example, if the NQ index is stuck oscillating tightly around the VWAP with no new session high or low for at least 60 minutes, treat the market as choppy and sit it out. If you experience three consecutive losing trades, step away from the session to avoid revenge trading.
Many seasoned traders avoid the midday period – typically from 11:00 AM to 2:00 PM ET – because it’s notorious for low-volume chop. Another essential rule: never increase your position size to recover losses during choppy conditions. Stick to a strict risk management plan, risking only 0.25%–0.5% of your account equity per trade. Finally, if you find yourself deviating from your defined setup based on intuition, you’re likely overtrading. When key indicators like CI, ADX, and ATR all point to chop, it’s best to pause and wait for clearer trends to emerge.
sbb-itb-46ae61d
Reviewing Your Trades and Improving Over Time
How to Review Your Trade Performance
Set aside 10–20 minutes after each trading session to evaluate your performance. Take screenshots of your charts, highlighting your entry points, exits, and stop-loss levels. These visuals can help you identify where you deviated from your plan. Alongside this, jot down notes about market conditions and your emotional state during trades – this can uncover patterns in your behavior over time.
To keep it simple, ask yourself these three questions after each session: Did I stick to my plan? Was the setup valid? How can I simplify my next trade? These reflections can guide you toward consistent improvement.
Once you’ve reviewed your trades, dive into the numbers to quantify your performance and better understand your trading edge.
Tracking the Right Metrics
Instead of obsessing over your win rate, focus on metrics that genuinely reveal your edge. For example, maintaining a 1:2 or 1:3 risk-to-reward ratio ensures profitability even if your win rate is below 50%. Another key metric is your Average R, which represents the average reward-to-risk multiple across all your trades. A consistent edge typically shows an Average R of at least 1.5R to 2R per trade.
Expectancy is another critical measure. It combines your win rate with the average size of your wins and losses, giving you the average dollar value earned per trade over a large sample size. Additionally, track your drawdown, which measures the largest drop in your account equity. Understanding this helps you gauge whether your strategy’s losing streaks are something you can handle both emotionally and financially.
Don’t forget to account for slippage and fees. These costs can eat into your profits, so it’s important to ensure your edge remains intact after factoring in commissions.
"You need at least 20 trades before you can really tell if your system works." – Richard Dennis
To get a clear picture of your strategy’s effectiveness, analyze your performance in batches of 20–50 trades. For instance, if you’re risking 0.5% per trade, you could endure 10 consecutive losses before hitting a typical 5% daily loss limit. On the other hand, risking 1% per trade allows for only 5 losses.
Using Data to Improve Your Strategy
Leverage the metrics you track to refine your strategy. Break down your trades by setup type – such as Opening Range Breakout or Morning Reversal – to identify patterns in what works and what doesn’t. This approach builds on the risk management and entry strategies previously discussed, helping you develop a comprehensive framework for trading during the first 90 minutes.
When reviewing your weekly performance, look for recurring mistakes. Only adjust your rules if the data consistently highlights a weakness; avoid making drastic changes after just one bad day. Keep a log of major events and adjust your strategy thoughtfully as you learn.
To stay organized, create a one-page playbook that outlines your go-to setups. Include details like market filters, entry triggers, and specific risk parameters. This keeps your trading process simple and focused.
Lastly, set process-oriented goals like "I will follow my plan 100% this week" rather than fixating on profit and loss. This helps build discipline and ensures you’re focused on execution. If your data reveals deviations from your setup, tighten your execution to stay on track.
15-Min ORB Strategy: Why Most Traders Lose (And How to Fix It)
Conclusion: Trading the First 90 Minutes Successfully
Mastering the first 90 minutes of trading requires a blend of careful preparation, disciplined execution, and effective risk management. By leveraging the 9:30–10:30 AM ET first-hour candle to establish a directional bias, you can base your trades on reliable data. This candle’s bias boasts an 84% probability of predicting the session’s close, providing a strong foundation for decision-making.
The strategies discussed here prioritize disciplined trading over impulsive moves. Limiting yourself to 1–3 well-validated setups per session helps protect your capital and enhances your trading edge – an approach especially critical when working within prop firm parameters.
"Smart trading is not just about chasing profits. It is about managing risk with discipline and consistency." – MetroTrade
DamnPropFirms offers tools and access to trusted prop firms, helping you adhere to strict drawdown limits while optimizing your trading edge. This structured, disciplined mindset ties all aspects of the strategy together.
To succeed, integrate preparation, patience, and a clear process into every trade. Mark key levels before the market opens, wait for confirmation, and execute your plan with unwavering focus. Regularly reviewing your trades will further refine your approach, giving you a solid framework to navigate one of the most dynamic periods of the trading day.
FAQs
Why is the opening range important in Nasdaq 100 (NQ) trading?
The opening range, which refers to the price movement during the first 10 minutes after the U.S. market opens at 9:30 AM ET, serves as an important guide for NQ traders. It creates defined boundaries that help pinpoint the market’s initial direction, offering insights into potential breakout scenarios.
By watching if the price breaks above the range’s high or drops below its low, traders can assess early momentum and decide whether to take long or short positions. This strategy helps reduce the chances of getting caught in the erratic price swings – often called "chop" – that are common during the market’s opening minutes.
How can I avoid getting caught in choppy market conditions during the first 90 minutes of trading the Nasdaq 100 (NQ)?
To steer clear of volatile market conditions during the first 90 minutes of trading the Nasdaq 100 (NQ), start by pinpointing clear trends. Tools like the daily VWAP and a 50- or 100-period EMA on a 1-minute chart can help you determine whether the market is trending or stuck in a range. If prices hover near these levels without a clear direction, it’s a sign that the session might be choppy.
Pay close attention to the opening range by marking the high and low of the first 1- or 5-minute candle. Tight ranges with low trading volume often indicate indecision, while wider ranges paired with strong volume suggest genuine momentum. Keep an eye out for liquidity candles – these are long wicks followed by rapid reversals – which often signal stop-hunting activity and potential market chop. If you notice repeated false breakouts or erratic price movements, it’s usually better to wait for a confirmed breakout supported by strong volume.
Lastly, prioritize disciplined risk management. Use tight stop-losses or skip trades altogether when conditions are uncertain. Protecting your capital during unpredictable periods ensures you’re ready to capitalize on higher-probability opportunities later in the session.
What are the best risk management strategies for trading Nasdaq-100 futures during volatile market conditions?
Trading Nasdaq-100 futures (NQ) in the first 90 minutes demands a solid plan for managing risk, especially given the market’s high volatility. A good starting point is to limit your risk on each trade to a small portion of your account – ideally no more than 1%. Adjust your position size based on market conditions, using tools like the average true range (ATR) of the opening range to guide your decisions.
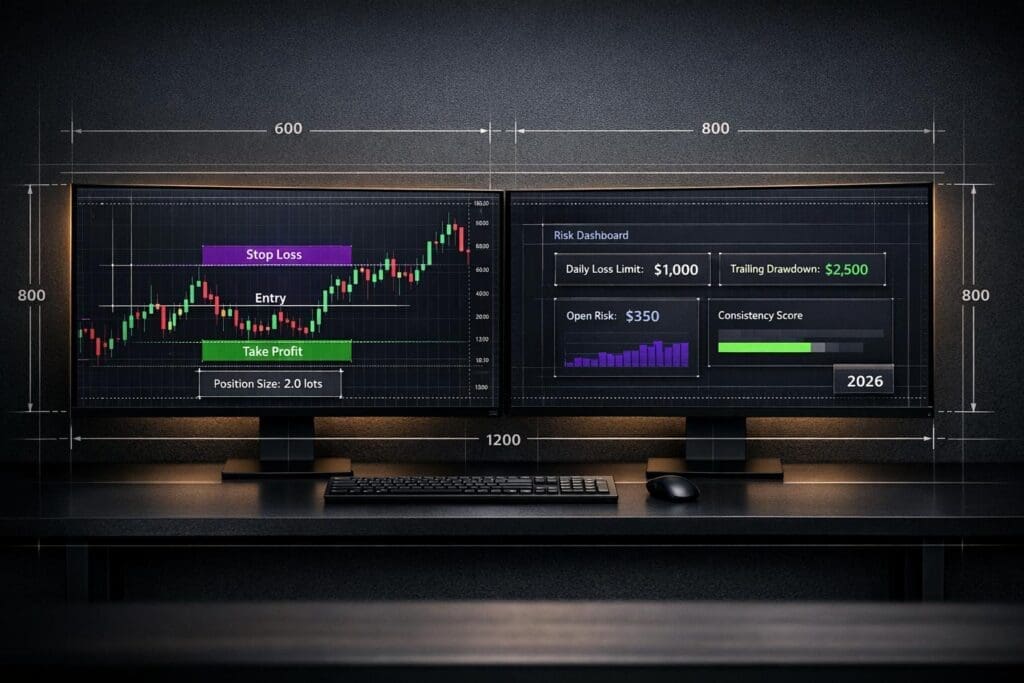
To protect yourself from unexpected losses, always set a hard stop-loss and stay mindful of your trading platform‘s rules, such as trailing drawdowns or daily loss limits. For instance, if your platform enforces a trailing drawdown, remember that open profits count toward your risk. Avoid exceeding the drawdown threshold by managing your trades carefully. Similarly, if you hit your daily loss limit, step away from trading for the day to prevent further damage during unpredictable market swings.
Timing is everything, so consider using volatility-based filters to refine your entry and exit points. Steer clear of trades during periods of weakening market breadth or when false breakouts occur. Once a trade starts moving in your favor, think about adjusting your stop-loss to break-even after capturing at least half of the anticipated move. You can also trail your stop-loss using a fraction of the ATR to secure profits while giving the market room to breathe. Strive for a risk-to-reward ratio of at least 1:2 – this ensures your gains outweigh your losses over the long term. Lastly, keep a detailed journal of your trades to spot patterns and improve your strategy for handling volatile markets.