Want to trade like a pro? Volume Profile can help you pinpoint where big players are trading, not just when. This tool maps out trading volume at specific price levels, revealing key areas of support, resistance, and market imbalances. Here’s how you can use it to improve your trading:
- Set up your chart: Use tools like NinjaTrader or TradingView and adjust settings for clear insights.
- Identify key levels: Focus on Point of Control (PoC), Value Area High (VAH), and Low (VAL) to spot balanced and imbalanced zones.
- Spot imbalance zones: Look for Low-Volume Nodes (LVNs) where price moves quickly, and High-Volume Nodes (HVNs) where it stabilizes.
- Confirm with price action and delta: Use patterns, volume delta, and rejection signals to validate zones.
- Plan trades and manage risk: Use these insights for precise entries, exits, and stop-loss placements.
Why it matters: Volume Profile is especially reliable in centralized futures markets like CME, where data is accurate. By focusing on structural levels, you can reduce guesswork and improve consistency – essential for futures prop traders.
Let’s break down each step in detail.
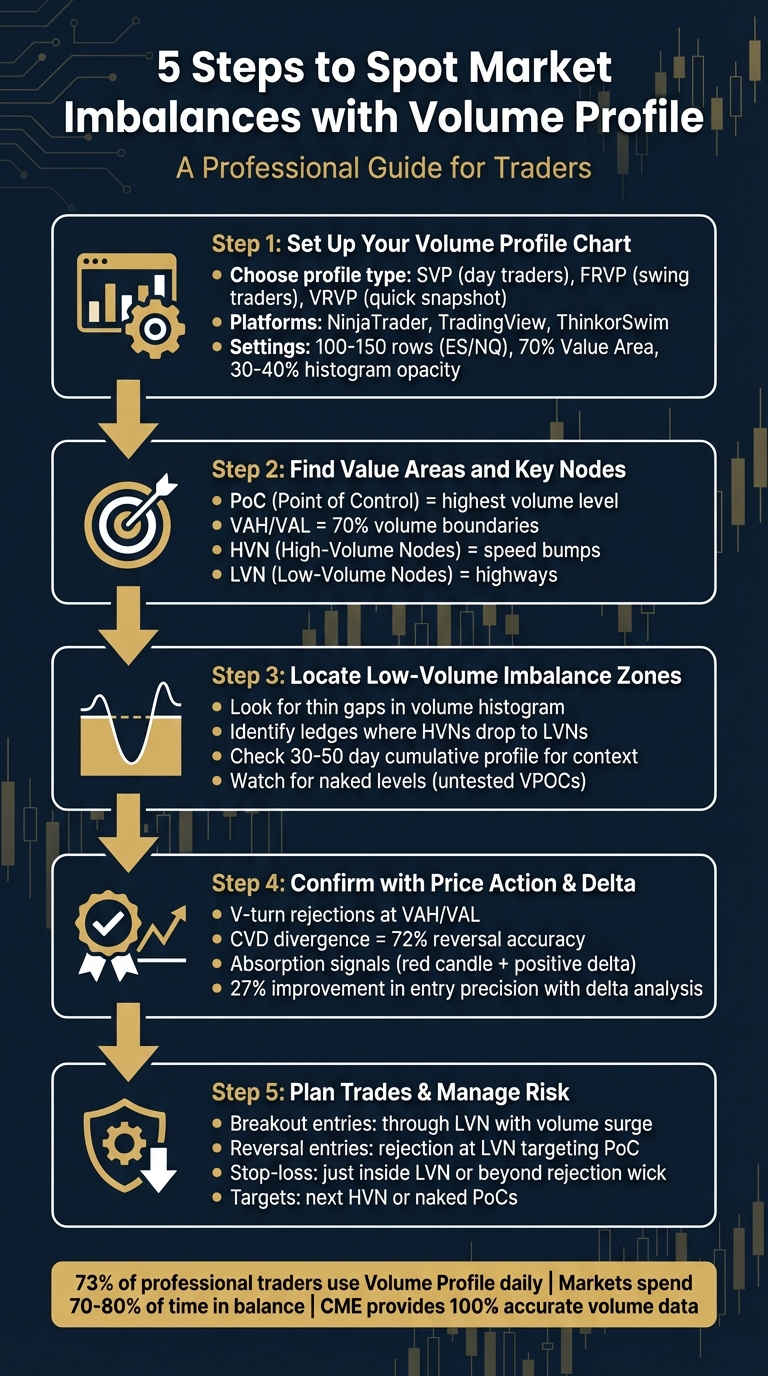
5-Step Process to Spot Market Imbalances Using Volume Profile Trading
VOLUME PROFILE: The Ultimate Day Trading Guide (Full Training – Chapters 1–10)
sbb-itb-46ae61d
Step 1: Set Up Your Volume Profile Chart
To get the most out of your Volume Profile analysis, start by configuring your charting platform correctly. Exchanges like CME, NYMEX, and Eurex offer centralized, fully accurate volume data, ensuring that your Volume Profile reflects genuine institutional trading activity.
For a more reliable analysis, use continuous contracts instead of individual expiries. This approach consolidates historical volume data, giving you a clearer and more comprehensive profile.
Pick the Right Volume Profile Tool
Choosing the right Volume Profile tool depends on your trading style and the timeframe you work with:
- Session Volume Profile (SVP): Ideal for day traders and scalpers looking to spot intraday patterns that repeat.
- Fixed Range Volume Profile (FRVP): Best for swing traders or when analyzing specific events like earnings reports or FOMC announcements.
- Visible Range Volume Profile (VRVP): Adjusts dynamically as you zoom or scroll, offering a quick snapshot of market structure.
Your trading platform also plays a key role. Here are some popular options:
- NinjaTrader: A professional-grade platform for futures trading, especially effective with the Order Flow+ package (available at $59 per month or a one-time fee of $1,500).
- ThinkorSwim: Comes with built-in VolumeProfile and TPO Profile studies.
- TradingView: Offers all three profile types with any paid subscription and is known for its intuitive interface.
- MT4/MT5: These platforms primarily use tick volume instead of actual transaction volume, making them less suitable for accurate Volume Profile analysis.
Adjust Chart Settings for Clear Analysis
Fine-tuning your chart settings is essential for precise insights:
- Volume Type: Use "Up/Down" or "Delta" instead of "Total." This highlights directional aggression at specific price levels.
- Row Size: Adjust based on the asset you’re analyzing:
- 100–150 rows for ES/NQ futures.
- Up to 200 rows for high-volatility assets like Crude Oil (CL).
- 50–75 rows for forex pairs.
- Value Area: Stick with the standard 70% setting, which captures where most trading occurs (one standard deviation from the mean).
- POC Settings: Enable the "Extend POC to the Right" feature to spot "Naked POCs." These untested levels from previous sessions often act as price magnets.
- Histogram Opacity: Set it to 30–40% for better clarity.
- Trading Hours: Differentiate between Regular Trading Hours (RTH) and Extended Trading Hours (ETH), as each reflects distinct participant behavior and institutional activity levels.
Step 2: Find Value Areas and Key Nodes
Once your chart is ready, the next step is to identify three critical levels: Point of Control (PoC), Value Area High (VAH), and Value Area Low (VAL). These levels help you distinguish between balanced and imbalanced trading zones.
The PoC represents the price level with the highest traded volume. It’s often referred to as the "fair value", where buyers and sellers reached the most agreement during the session. Surrounding this is the Value Area, which captures about 70% of the session’s total volume. The VAH marks the upper boundary of this range, while the VAL defines the lower boundary.
When prices trade within the Value Area, it suggests a balanced market with active competition between buyers and sellers. However, when prices move outside the Value Area – either above the VAH or below the VAL – it signals a shift toward imbalance, as one side begins to dominate. After identifying these levels, it’s essential to delve into the roles of High-Volume Nodes (HVNs) and Low-Volume Nodes (LVNs) to refine your understanding of market dynamics.
Read High-Volume Nodes (HVNs) and Low-Volume Nodes (LVNs)
HVNs and LVNs provide insight into areas of market support and rejection:
- High-Volume Nodes (HVNs) are visible as thick clusters in the volume profile, indicating price levels where trading activity was high. These zones often act as robust support or resistance, with the PoC being the most significant HVN.
- Low-Volume Nodes (LVNs) appear as thin gaps or valleys in the profile, reflecting areas where price moved quickly with minimal volume. These zones suggest rejection points where the market didn’t spend much time.
QuantCrawler described the dynamic between these nodes perfectly:
"LVN = highway, HVN = speed bump."
In other words, LVNs act as fast-moving channels, while HVNs serve as barriers where price tends to consolidate. Trading in the middle of an LVN can be risky since price often accelerates through these zones. Instead, focus on using LVNs as pathways that lead to HVNs, where price is more likely to stabilize.
Interpret Profile Shapes
The overall shape of the volume profile offers valuable clues about market sentiment and potential imbalances:
| Profile Shape | Appearance | Market Condition | Trading Implication |
|---|---|---|---|
| D-shaped | Bell curve with volume concentrated in the center | Balanced/Range-bound | Favor mean reversion; fade extremes near VAH/VAL |
| P-shaped | Bulge at the top with a thin lower tail | Bullish | Look for buying opportunities near HVN support on dips |
| b-shaped | Bulge at the bottom with a thin upper tail | Bearish | Watch for selling opportunities near HVN resistance on rallies |
A D-shaped profile indicates a balanced market where price oscillates near the fair value. On the other hand, P-shaped and b-shaped profiles suggest imbalances, with one side (buyers or sellers) dominating. These shapes can serve as a roadmap for planning trades in trending or imbalanced conditions with the best futures prop firms.
Lastly, keep an eye on Naked PoCs – PoCs from previous sessions that haven’t been revisited yet. These levels often act as price magnets, drawing the market back to test them.
Step 3: Locate Low-Volume Imbalance Zones
Building on the previous step, the next focus is identifying low-volume imbalance zones – areas where price tends to accelerate. These zones appear as thin gaps or valleys in the volume profile histogram, signaling areas with minimal trading activity. Unlike the high-volume nodes (HVNs) we discussed earlier, these thin zones lack the liquidity required to stabilize price movement.
Low-volume imbalance zones typically form when the market moves too fast for balanced trading to occur. This can happen during sharp breakouts, significant news events, or when price reaches levels deemed "unfair" by market participants – where buyers and sellers fail to agree on value. These conditions create a vacuum, driving prices quickly toward high-volume zones. As Kyle Maring from HighStrike explains:
"Low volume regions usually point to rapid price movements because of a lack of interest or liquidity".
Verify Thin Volume Areas
To confirm a low-volume imbalance zone, look for clear visual indicators on your chart. One of the most telling signs is a ledge – a point where high-volume nodes drop off sharply into low-volume areas. These ledges act as barriers, either rejecting price back into the previous value area or allowing it to break through and establish new trading ranges.
When price approaches a ledge, two key outcomes are likely:
- Rejection: Price bounces back into the earlier value area.
- Acceptance: Price breaks through, leading to new volume accumulation.
To verify a breakout, watch for two consecutive 5-minute closes beyond the low-volume node (LVN). If price holds beyond the LVN over several cycles, it indicates strong market commitment. On the other hand, a quick reversal after touching the zone suggests rejection – a potential opportunity for a fade trade, a common strategy used when trading with top futures prop firms.
Once these zones are visually identified, consider their historical significance to ensure they are meaningful.
Review Historical Data for Context
Adding historical context helps distinguish genuine imbalance zones from noise. Use a cumulative volume profile covering 30 to 50 days to pinpoint long-term distribution ledges. These structural levels often hold relevance for weeks or months, serving as critical support and resistance zones.
Pay particular attention to naked levels – such as VPOCs (Volume Point of Control), VVAHs (Volume Value Area Highs), or VVALs (Volume Value Area Lows) from previous sessions that haven’t been revisited. For example, in September 2023, the S&P 500 E-mini futures showed resistance between 4,361 and 4,370 at a naked level. When retested, this zone confirmed an imbalance before leading to a sharp drop.
Step 4: Confirm Imbalances with Price Action and Delta
Once you’ve spotted low-volume imbalance zones, the next critical step is to validate them using clear price action signals and cumulative volume delta (CVD). These tools help you filter out unreliable setups and focus on higher-probability trades.
Use Price Rejection and Breakout Patterns
When price nears a low-volume imbalance zone, pay close attention to its interaction with the Value Area High (VAH) and Value Area Low (VAL) – the upper and lower boundaries of the 68.2% volume distribution. Rejections at these levels often signal potential reversals.
A common rejection pattern is the V-turn. This happens when the price hits a low-volume node (LVN), gets blocked by passive orders, and is quickly pushed back into the value area by aggressive orders. On a candlestick chart, this appears as long wicks – evidence that the market tested a level and strongly rejected it. On the other hand, fast displacement occurs when price breaks aggressively through an LVN. This is marked by wide-range candles and a surge in volume, often driven by stop-loss triggers and momentum traders jumping in.
Before considering a breakout trade, check for signs of a finished auction. If volume decreases as price reaches an extreme, it indicates waning interest, confirming that the market has rejected that price level. In contrast, an unfinished auction – marked by a high-volume node (HVN) at the extreme – suggests the price is likely to revisit that level to complete the negotiation. As Rubén Villahermosa explains:
"The POC is an equilibrium zone where buyers and sellers are balanced. It is NOT a directional signal. Entering at the POC is like entering no man’s land without knowing who will win the battle".
Wait for clear confirmation before entering a trade. Look for breakout signals like engulfing or hammer patterns near imbalance edges. To refine your entries further, use the VWAP (Volume Weighted Average Price) as a filter: go long only when the price sits above VWAP and short when it’s below, aligning your trades with institutional sentiment, a key focus in Topstep’s coaching and community.
Now, let’s dive into how cumulative volume delta adds another layer of insight.
Read Cumulative Volume Delta
Cumulative volume delta (CVD) tracks the net difference between aggressive buying (hitting the ask) and aggressive selling (hitting the bid) over time. Unlike standard volume, which measures overall activity, CVD reveals the intent behind price movements.
One of the most powerful CVD signals is divergence. For example, if price reaches a new high without a matching high in CVD, it suggests buying pressure is fading, increasing the likelihood of a bearish reversal. Conversely, if price makes a lower low while CVD forms a higher low, it signals that selling pressure is running out, often preceding a bounce. A study of EUR/USD between 2018 and 2022 found that 72% of major reversals were preceded by delta divergences 3–4 candles before the actual turn. This makes CVD a valuable tool, offering a quantitative edge over purely visual price action analysis.
Absorption is another key signal, often pointing to smart money activity. For instance, a red candle with a positive delta or a green candle with a negative delta shows institutional traders absorbing aggressive orders at a specific price level, which often leads to reversals. A great example comes from March 2026, when a trader analyzed Tesla (TSLA) on a 4-hour chart. Price returned to a demand zone, showing aggressive seller imbalances on the volume footprint. However, the candle closed above these imbalances (indicating absorption), while CVD formed higher lows even as price made lower lows (divergence). Once an initiation candle confirmed the buyer imbalance, the trade successfully ran to previous structure highs.
To pinpoint institutional order flow, set delta filters at 2.5 standard deviations and volume filters at 1.5 times the average session volume. As Arif Chowdhury puts it:
"Price is what happened. Volume delta tells you WHY it happened".
Traders who integrate delta analysis into their strategy see an average 27% improvement in entry precision compared to those relying solely on price action. However, don’t act on absorption signals alone – wait for an initiation candle that closes in the expected reversal direction to confirm the shift in market control.
Step 5: Plan Trades and Manage Risk in Prop Trading
To succeed in prop trading, it’s crucial to turn your analysis of imbalances into a structured plan. This means focusing on precise trade entries, clear exit strategies, and disciplined risk management – all while meeting the requirements set by prop firms.
Enter Trades Using Imbalance Zones
Once you’ve identified imbalances, you can use them to make more precise trade entries. Low-Volume Nodes (LVNs) are particularly useful for this purpose, whether you’re trading breakouts or reversals.
- Breakout Trades: Enter when the price breaks through an LVN with a strong impulse candle and rising volume. A slight retest of the LVN boundary can also be a good entry point. If the price holds beyond the LVN for several rotations with increasing volume, this can signal a move toward the next major High-Volume Node (HVN).
- Reversal Trades: Look for opportunities when the price re-enters the Value Area from outside. In these cases, aim for the Point of Control (PoC) or the opposite boundary (Value Area High/Low, or VAH/VAL). If the price tests an LVN and gets rejected, this can be a signal to enter, targeting the PoC or the opposite boundary.
When setting stop-losses, use the volume structure as your guide. For breakout trades, place your stop just inside the LVN to keep it tight. For rejection trades, set your stop beyond the volume zone or the rejection wick.
"If a trader enters a long position near a high-volume node, they might place their stop-loss below a low-volume node, ensuring that the trade only gets stopped out if price breaks through a significant liquidity gap".
Your targets should focus on the next HVN or structural level. "Naked POCs" (untested Points of Control from prior sessions) are also excellent high-probability targets. During balanced market conditions, consider scaling out of positions at the PoC first, then at the opposite Value Area extreme.
Another tool to consider is the 80% Rule. If the price opens outside the previous day’s value area but moves back into it, there’s an 80% chance it will fill the entire value area to the opposite side. This statistical edge can be especially helpful for traders working to meet prop firm consistency requirements.
Apply Volume Profile in Futures Prop Trading
Volume profile strategies are particularly effective in highly liquid futures markets, like the E-mini S&P 500 (ES), Nasdaq 100 (NQ), Crude Oil (CL), and Gold (GC). These markets provide accurate volume data from centralized exchanges like the CME and Eurex, which is a significant advantage compared to fragmented Forex or crypto markets.
For prop traders, using volume-based strategies can help you maintain the consistency needed to pass evaluations. Many firms, such as Apex Trader Funding, have specific requirements, like trading day minimums and drawdown limits. Volume profile tools allow you to focus on high-probability structural levels rather than relying on unpredictable news-driven volatility.
Position sizing is another critical factor. Your trade size should align with your firm’s drawdown rules and market volatility. This helps ensure you don’t violate consistency or maximum loss thresholds.
If you’re eager to jump into trading without a lengthy evaluation period, firms like Lucid Trading offer instant funding options with discounts on accounts. This allows you to start applying volume-based strategies right away.
Traders who incorporate volume profile into their strategies often see improved entry precision and more consistent results – qualities that are highly valued by prop firms.
Conclusion
Volume Profile offers a unique perspective into market behavior by revealing where institutional money has been concentrated – not just the timing of trades. By following the outlined five steps – properly setting up your chart, identifying Value Areas and key nodes, spotting low-volume imbalance zones, confirming with price action and delta, and planning trades with discipline – you can focus on the structural levels that hold the most significance.
Here’s a compelling statistic: nearly 73% of professional traders rely on Volume Profile daily. Additionally, markets spend about 70% to 80% of their time in balance. The most lucrative opportunities often emerge when prices break through Low Volume Nodes, which act like "price vacuums", accelerating momentum. Conversely, High Volume Nodes function like gravitational forces, pulling prices back [2,10].
For futures prop traders, this level of precision is invaluable. Centralized exchanges like the CME deliver 100% accurate volume data, making Volume Profile especially dependable in futures markets. Whether you’re aiming to pass an evaluation at Apex Trader Funding or growing a funded account at Take Profit Trader, leveraging volume-based structural levels and studying futures prop firm reviews can enhance consistency and reduce reliance on arbitrary stop placements.
"Volume Profile tells you WHERE the auction is likely to react. Your order flow tools tell you WHEN to act." – AlgoStorm
FAQs
What timeframe should I use for Volume Profile?
When it comes to using Volume Profile, a 30-minute chart is often suggested. This timeframe is great for spotting key volume zones and identifying market imbalances with clarity. That said, Volume Profile isn’t limited to just one timeframe or trading instrument. Whether you’re trading stocks, futures, or forex, you can adapt it to suit your preferred style and goals. Tailor your approach to align with what works best for your strategy.
How do I confirm an LVN breakout vs a fakeout?
To distinguish a real LVN (Low Volume Node) breakout from a fakeout, keep a close eye on volume and order flow. A true breakout is typically backed by a noticeable rise in volume and a clear shift in order flow, with prices maintaining their position above or below the LVN after a retest. On the other hand, fakeouts often lack sufficient volume, show weak order flow, and struggle to hold the breakout level. Tools like footprint charts can be incredibly useful for identifying these imbalances with precision.
Can Volume Profile work on forex or crypto?
Yes, Volume Profile is effective in both forex and crypto markets. It provides a clear view of market order imbalances and trading activity at various price levels, giving traders key insights into market behavior and potential price movements.