Trend-following algorithms are systematic trading systems designed to profit from sustained price trends in futures markets. These systems rely on mathematical models and predefined rules, avoiding emotional decision-making. Key features include:
- Core Strategy: Buy at new highs and sell at new lows, with a focus on cutting losses quickly and letting winners run.
- Performance: Markets trend only 30% of the time, but disciplined systems can achieve profitability with win rates as low as 30–45%, thanks to favorable risk-reward ratios (3:1 to 10:1).
- Indicators: Moving averages, RSI, MACD, ADX, and breakout tools like Donchian Channels are commonly used to identify trends, momentum, and volatility.
- Risk Management: ATR-based stop-losses, trailing stops, and dynamic position sizing ensure consistent risk control across diverse futures contracts across various prop firms.
- Diversification: Trading across multiple uncorrelated futures (commodities, currencies, bonds, etc.) provides steady opportunities and reduces portfolio risk.
Trend-following strategies are particularly effective in futures markets due to their liquidity, diversity, and ability to perform well during market downturns. With proper backtesting, risk management, and adherence to rules, these systems can deliver consistent results over time. For those looking to apply these systems in a professional environment, exploring futures prop firm reviews can help identify the best platforms for funded trading.
Building Algorithmic Futures Strategies with Kyle Schultz – Trading Bot Sessions (EP 009)
sbb-itb-46ae61d
Technical Indicators Used in Trend-Following Algorithms
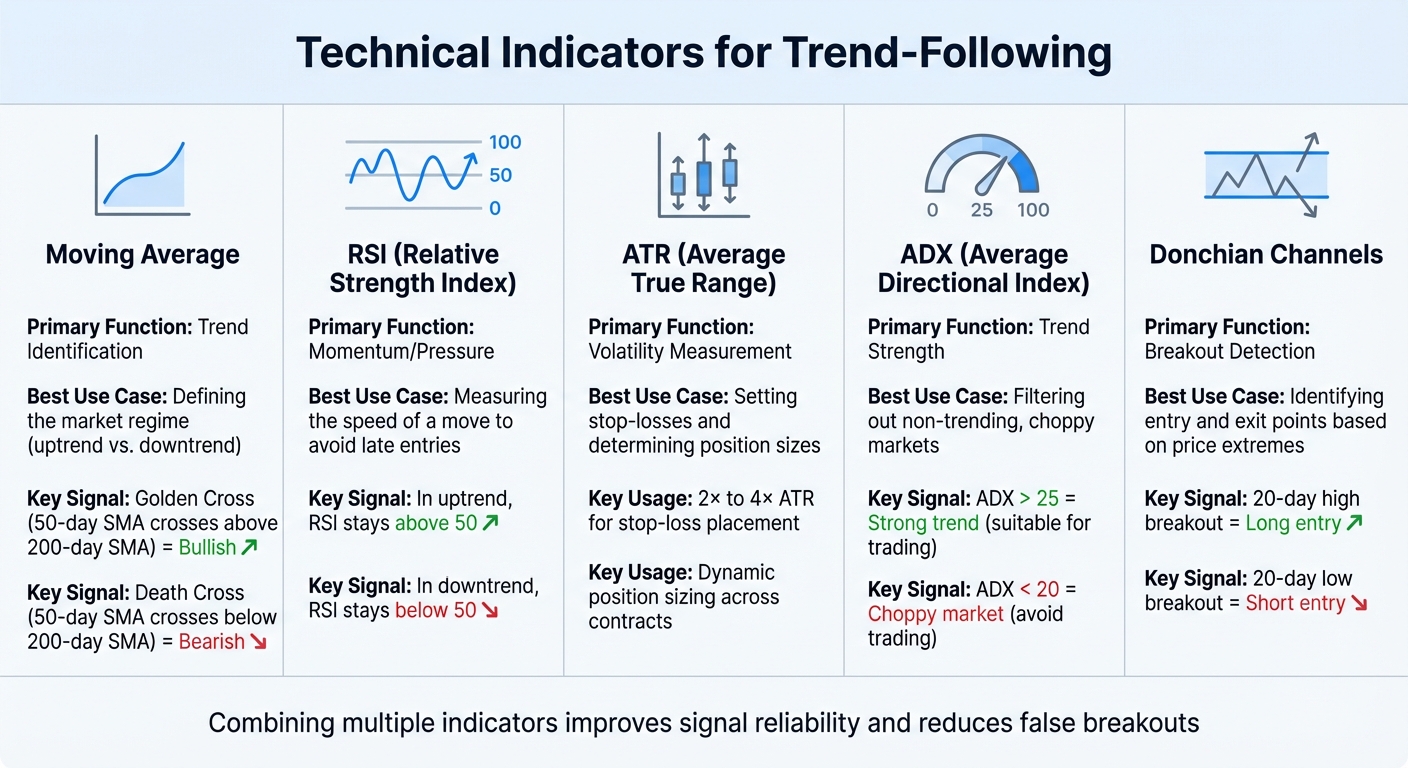
Technical Indicators Comparison for Trend-Following Algorithms
Moving Averages (Simple and Exponential)
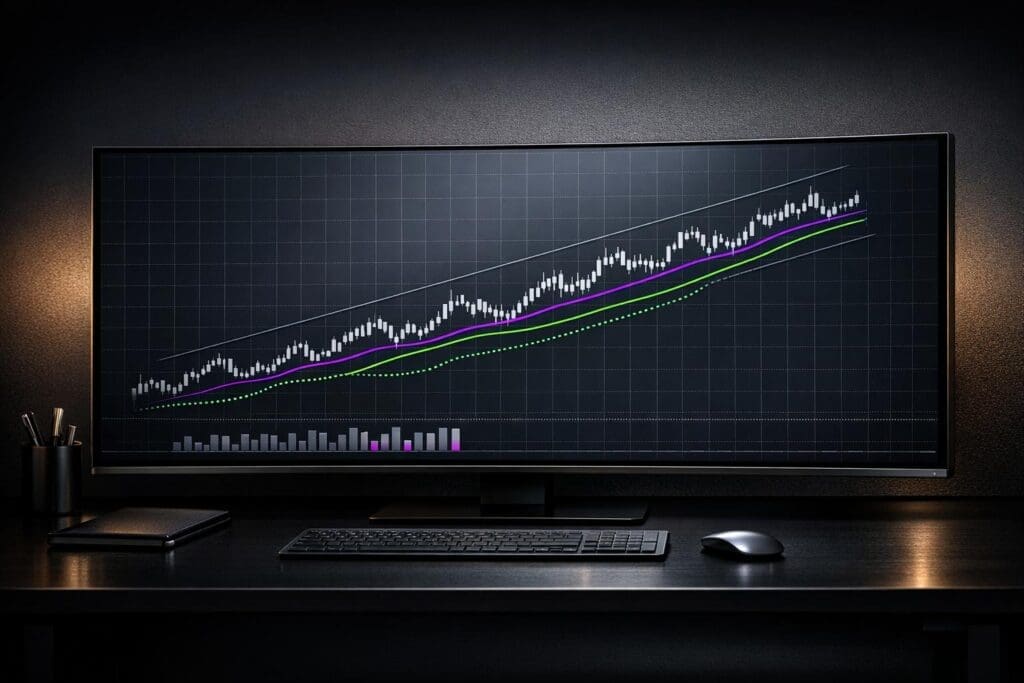
Moving averages are a cornerstone of trend-following strategies, smoothing out short-term price fluctuations to reveal the broader trend. They align well with the systematic, rule-based nature of these strategies. Simple Moving Averages (SMAs) calculate an equal-weighted average over a specific time frame (e.g., 50 or 200 days). In contrast, Exponential Moving Averages (EMAs) place more emphasis on recent prices, allowing them to react faster to market changes.
A price above a rising moving average typically signals a bullish trend, while a price below a falling moving average points to bearish conditions. Flat moving averages often indicate a sideways, range-bound market where trend-following systems tend to underperform. Key signals include the Golden Cross (when the 50-day SMA crosses above the 200-day SMA), which suggests long-term bullish momentum, and the Death Cross (50-day SMA crossing below the 200-day SMA), which signals bearish momentum.
For example, Derek Melchin of QuantConnect backtested a "Futures Fast Trend Following" strategy from July 1, 2020, to July 1, 2023, using an EMAC(16, 64) filter. This approach, based on a 16-day EMA crossing a 64-day EMA, was applied to S&P 500 E-mini and 10-year Treasury note futures. The algorithm executed 607 trades and achieved a Sharpe ratio of 0.294, outperforming a simple buy-and-hold strategy for the same contracts.
Momentum and Oscillator Tools
While moving averages help identify the direction of a trend, momentum indicators assess its strength and speed. The Relative Strength Index (RSI) is particularly useful for measuring price momentum. Instead of merely signaling overbought or oversold conditions, RSI can provide insight into the persistence of a trend. For instance, in an uptrend, RSI often stays above 50, while in a downtrend, it lingers below 50.
The Moving Average Convergence Divergence (MACD) indicator compares two EMAs – commonly the 12-day and 26-day EMAs. A cross of the MACD line above the signal line or the zero line confirms upward momentum, while a cross below signals downward momentum. The Average Directional Index (ADX) measures trend strength, regardless of direction. Readings above 25 indicate a strong trend suitable for trading, while values below 20 suggest a choppy market where trend-following systems may struggle.
"The edge isn’t in discovering new indicators. It’s in expressing market behavior clearly, validating it properly, and then combining ideas intelligently." – Josh Malizzi, Systematic Trader
Momentum indicators often work hand-in-hand with breakout and volatility measures to refine entry and exit points in trend-following strategies.
Breakout and Volatility Measures
Breakout systems like Donchian Channels identify the beginning of a trend by triggering entries when prices break above recent highs or below recent lows. For example, a 20-day high signals a potential long entry, while a 20-day low suggests a short entry. This approach confirms that buyers or sellers have overcome key resistance or support levels.
The Average True Range (ATR) is a popular tool for measuring market volatility, often used to set stop-loss levels and calculate position sizes. Instead of relying on fixed stop-losses that may get triggered by minor price movements, traders use ATR-based stops (commonly 2× to 4× the ATR) to account for normal price fluctuations within a trend. ATR also helps with dynamic position sizing. By determining the dollar value of one ATR move, traders can balance risk across contracts. For instance, this ensures that a volatile asset like Crude Oil doesn’t dominate the portfolio compared to a more stable asset like Treasury notes.
| Indicator | Primary Function | Best Use Case |
|---|---|---|
| Moving Average | Trend Identification | Defining the market regime (uptrend vs. downtrend) |
| RSI | Momentum/Pressure | Measuring the speed of a move to avoid late entries |
| ATR | Volatility Measurement | Setting stop-losses and determining position sizes |
| ADX | Trend Strength | Filtering out non-trending, choppy markets |
| Donchian Channels | Breakout Detection | Identifying entry and exit points based on price extremes |
Trend-Following Strategies for Futures Markets
Moving Average Crossover Strategies
These strategies use the relationship between two moving averages – one fast (short-term) and one slow (long-term) – to identify trends and generate trading signals. A bullish signal occurs when the fast average moves above the slow average, while a bearish signal is triggered when the fast average drops below the slow one.
Different day trading and swing specialists tailor their moving average combinations to suit their trading style. For example:
- Institutional traders often prefer a 16-day and 64-day EMA crossover for a balance between sensitivity and noise reduction.
- Swing traders favor the faster 21/50 combination for quicker entries.
- Position traders rely on the 50/200 setup, commonly known as the Golden Cross (bullish) or Death Cross (bearish).
Professional Commodity Trading Advisors (CTAs) often run these systems across multiple timeframes – short-term (10/20-day), medium-term (50/100-day), and long-term (100/200-day) – to capture trends across different cycles and smooth out returns during volatile periods.
Volatility-Based Approaches
Volatility-based strategies adjust position sizes and stops according to market conditions. The Average True Range (ATR) is a popular tool for standardizing risk across various futures contracts. For instance:
- In high-volatility markets like Crude Oil futures, traders reduce position sizes to limit dollar risk.
- In lower-volatility markets, such as 10-year Treasury notes, larger positions are taken to maintain consistent risk levels.
A common rule might set a 1-ATR move to equal $1,000 in risk, regardless of the contract. Traders also use ATR-based trailing stops – typically set at 2–4× ATR – to allow trends to run their course without being disrupted by normal price fluctuations. This approach reflects a key observation: about 80% of annual returns in trend-following strategies come from just 20% of trades.
Once volatility-adjusted risk controls are in place, breakout systems provide another effective way to capitalize on trend momentum.
Breakout Systems
Breakout strategies focus on entering trades when prices break through defined support or resistance levels. One of the most well-known methods is the Donchian Channel system. This strategy involves:
- Entering a long position when the price exceeds the highest high of the last 20 days.
- Exiting when the price drops below the lowest low of the last 10 days.
This setup is designed to capture long trends while minimizing losses when momentum reverses. To reduce the impact of false breakouts in sideways markets, many traders use an Average Directional Index (ADX) filter. For example, trades are only triggered when the ADX value exceeds 25, signaling a strong trend.
In a simulated portfolio of 50 futures contracts (2014–2024), adding an ADX > 25 filter to a 50/200-day moving average crossover strategy improved the Sharpe ratio from 0.87 to 1.02 and reduced the maximum drawdown from 23% to 19%.
| Strategy Type | Best For | Typical Win Rate | Complexity |
|---|---|---|---|
| Donchian Breakout | Commodities, Volatile Markets | 35–40% | Simple |
| Dual MA Crossover | Equity Indices, ETFs | 40–50% | Simple |
| ADX-Filtered Breakout | Filtering out market "chop" | 30–40% | Moderate |
Although these strategies often have low win rates (30–45%), they compensate with high risk-reward ratios, ranging from 3:1 to 10:1. This balance ensures profitability over time, even if losses occur more frequently than wins.
Risk Management in Trend-Following Algorithms
Stop-Loss and Trailing Stop Strategies
Using strategies like ATR-based stops can help manage risk by adapting to market conditions. These stops widen during volatile periods and tighten when the market calms, avoiding unnecessary exits caused by regular market fluctuations. Another approach, the Chandelier Exit, sets the stop at the highest price since entry minus 3–5 times the ATR.
"A poorly placed stop-loss is often worse than no stop at all, as it results in the strategy being constantly ‘wicked out’ by normal market noise." – QuantStrategy.io Team
In August 2024, trader Carlos Mata introduced the "Loose Pants" strategy, combining a 6-month breakout entry with a 5-ATR Chandelier trailing stop. Simulations across about 100 futures markets showed that limiting the portfolio to 10–15 positions improved returns for accounts starting at $100,000. This approach outperformed more expansive institutional strategies. The ratchet mechanism used in this strategy ensures that stops only move in the trend’s direction, locking in gains as the market progresses. For example, the stop is calculated as stop = max(previous stop, current price - k * ATR), ensuring it never loosens once tightened.
Backtesting on E-mini S&P 500 futures illustrated how the ATR multiplier impacts performance. A 2.0 × ATR multiplier yielded a 40% win rate, while increasing it to 3.5 × ATR raised the win rate to 55%, though it reduced the average profit per trade. Some traders also combine fixed take-profit targets with trailing stops, such as closing half the position at a 1R (risk) profit and letting the rest trail with a Chandelier Exit.
These stop strategies are often paired with dynamic position sizing for enhanced risk control.
Dynamic Position Sizing
Dynamic position sizing adjusts trade sizes based on market volatility, ensuring consistent dollar risk across all instruments. The formula is straightforward: Position Size = Risk Per Trade / (ATR × Contract Multiplier). For instance, in a $100,000 account risking 2% per trade ($2,000), if an asset’s ATR is $3 and the contract multiplier is 1,000, the risk per contract would exceed the allowed risk, requiring adjustments like rounding or fractional positions.
In September 2023, QuantConnect recreated one of Robert Carver’s strategies, which traded S&P 500 E-mini and 10-year Treasury note futures. It utilized an exponential moving average crossover (EMAC 16, 64) with a 10% trading buffer, reducing trade frequency and transaction costs by only adjusting positions when changes exceeded a 10% threshold around the optimal size.
Risk parity is another key element, ensuring each market contributes equally to the portfolio’s dollar risk. This prevents high-volatility instruments from overshadowing others. Advanced systems also include drawdown deleveraging, where all positions are halved if the portfolio’s overall drawdown surpasses 15%.
These techniques support balanced risk allocation, which is crucial for diversification across futures contracts.
Diversification Across Futures Contracts
Professional trend-followers often track 50–100 futures contracts spanning commodities, currencies, fixed income, and equity indices. Diversification across markets has historically accounted for over 60% of the "edge" in Commodity Trading Advisor (CTA) programs. Since trends in different markets emerge at varying times, this approach amplifies the benefits of diversification.
"Trend following requires diversification and good risk management… you need to diversify into as many different trends as liquidity allows, which will rise, fall, or reverse at different points in time." – Pascal Chrobocinski, Senior Hedge Funds Analyst, BNP Paribas
The Barclay BTOP50 Index, which tracks trend-following strategies, has delivered an average annual return of 8.9% since 1986, with a maximum drawdown of -16%. This compares favorably to global stock markets, which averaged 8.3% annually but faced a -50% maximum drawdown in the same period. In 2022, when equities and bonds fell simultaneously, CTAs provided protection by maintaining short positions as long as the downtrend persisted.
For retail traders with smaller accounts, focusing on 10–15 uncorrelated positions can still capture the core benefits of trend-following strategies. While a $1,000,000 portfolio is often cited as the benchmark for diversified futures trading, studies show that retail traders can achieve effective diversification with as little as $100,000 by trading Micro futures contracts. Adding sector caps – such as limiting exposure to a single sector to no more than 30% of the portfolio – helps maintain balance and avoid over-concentration.
Building and Backtesting Trend-Following Systems
Developing a Rule-Based System
To build a trend-following algorithm, the first step is to import adjusted historical futures data. This data must account for contract rolls to avoid misleading signals caused by artificial price jumps. A popular method for this is the Backwards Panama Canal approach. Once the data is ready, traders can select their core indicators. Common choices include Moving Average Crossovers (EMAC), Donchian Channel breakouts, or Rolling Linear Models that track price movement trends.
The system should have clear trade triggers. For instance, a simple rule might dictate entering a long position when the price rises above a 50-day moving average and exiting when it drops below a 20-day moving average or hits a trailing ATR stop. To manage risk, position sizing can be calculated with the formula: Position Size = Risk Per Trade / (ATR × Contract Multiplier). Adding a 10% trading buffer around the optimal position size helps minimize overtrading and reduces transaction fees.
Trend-following strategies often result in a mix of small losses and occasional big wins, as markets trend only about 30% of the time. This makes it essential to design systems that can capitalize on those rare, high-impact moves. The most effective strategies aim for risk-reward ratios in the range of 3:1 to 10:1.
"Markets trend ~30% of the time. During those trends, massive profits are possible. The other 70% (choppy markets) will be breakeven or slightly negative." – HorizonAI
Once the rules are set, the next phase involves rigorous testing and fine-tuning of the system’s parameters.
Backtesting and Optimizing Parameters
Backtesting a strategy involves simulating real trading conditions while avoiding the use of future price data. For example, in September 2023, Derek Melchin from QuantConnect tested a "Fast Trend Following" strategy using EMAC (16, 64) on S&P 500 E-mini and 10-year Treasury note futures. The test period spanned from July 1, 2020, to July 1, 2023. This system executed 607 trades, incurred $4,724.53 in fees, and achieved a Sharpe ratio of 0.294. A version without the 10% trading buffer made 738 trades, with fees rising to $5,607.51.
When optimizing parameters, look for a broad range of profitable settings rather than a single "perfect" one. For instance, if 20-day, 40-day, and 60-day breakouts all deliver similar results, the strategy is likely reliable. However, if only a 37-day breakout works, it might be overfitted to historical noise. Always validate optimized settings using out-of-sample data. For example, test parameters optimized from 2010–2014 on data from 2015–2024 to ensure they perform well in different market conditions.
It’s essential to account for slippage and commission costs in backtests. Use slippage estimates between 0.5 to 2.0 ATR per trade to ensure the strategy’s edge isn’t eroded by execution costs. Monte Carlo simulations can also help by randomizing trade sequences to ensure the system remains effective under varying market scenarios. These steps are critical for refining risk controls and position sizing.
Evaluating Performance Metrics
Once the system is developed and tested, evaluating its performance metrics ensures it’s effective in real-world scenarios. The Sharpe ratio is a key indicator of risk-adjusted returns, with values between 0.8 and 1.8 typical for trend-following systems. However, a high win rate isn’t essential. A system can lose 70% of the time yet remain profitable if the winners significantly outweigh the losers. For example, seven losses at -1% each combined with three wins at +8% each result in a net gain of +17%.
Another critical metric is the maximum drawdown, which helps set realistic expectations. Trend-following systems often see drawdowns of 15% to 25% every couple of years. The profit factor (gross profits divided by gross losses) should ideally range from 1.5 to 2.8. Additionally, tracking the proportion of trades achieving 3R profit (three times the initial risk) helps confirm whether the system allows winners to run.
| Metric | Target Range | Purpose |
|---|---|---|
| Sharpe Ratio | 0.8 – 1.8 | Measures risk-adjusted returns |
| Profit Factor | 1.5 – 2.8 | Compares gross profits to gross losses |
| Win Rate | 30% – 45% | Percentage of profitable trades |
| Max Drawdown | 15% – 25% | Largest peak-to-trough loss |
Diversifying across 10–20 uncorrelated futures contracts can smooth equity curves and reduce the impact of volatile or choppy markets. Testing parameter stability and monitoring sensitivity to slippage are also essential to identify which markets are likely to stay profitable even under less-than-ideal conditions.
Scaling Futures Trading with Prop Firms
How Prop Firms Support Trend-Following Strategies
Using trend-following systems to scale through prop firms can significantly expand your trading reach by tapping into institutional capital. With a relatively small evaluation fee, traders can access funded accounts of up to $150,000. This additional capital is particularly useful for strategies that rely on larger positions to capitalize on extended market trends.
For trend-followers, the end-of-day (EOD) drawdown model offered by firms like Lucid Trading and Tradeify is a game-changer. Unlike intraday drawdowns that track every tick, EOD drawdowns only adjust at the market close, giving your system the breathing room it needs to capture those big directional moves without being disrupted by intraday volatility.
Many top-tier firms offer a 90/10 profit split, with some, like Apex Trader Funding, going a step further by allowing traders to keep 100% of the first $25,000 in profits per account. Tools like TradeSyncer make scaling even easier by allowing traders to copy their strategies across as many as 20 accounts simultaneously. This means you can multiply your capital allocation without adding extra manual effort.
Top Futures Prop Firms for Trend-Following Traders
Here’s a closer look at some standout prop firms for trend-following strategies:
Apex Trader Funding: Apex allows traders to manage up to 20 accounts and often runs promotions on evaluation fees, making it a budget-friendly option for scaling. They offer both EOD and intraday drawdown models, along with a 30% consistency rule that encourages spreading profits over multiple days.
Lucid Trading: Lucid provides three account types to suit different trading styles. For example, LucidDirect offers instant funding with a strict 20% consistency rule and EOD drawdown, while LucidFlex removes consistency rules entirely once funded. This flexibility is ideal for traders seeking to profit from major news events like FOMC or NFP announcements. Supported platforms include NinjaTrader, Tradovate, and TradingView.
Tradeify: Tradeify’s Lightning option offers instant funding with a tiered consistency rule that adjusts across payouts. Even if you exceed the consistency threshold, your account remains active – the only change is an increased profit target until the largest trading day fits within the allowed range.
Here’s how these firms stack up in a quick comparison:
| Feature | Lucid Trading | Apex Trader Funding | Tradeify |
|---|---|---|---|
| Drawdown | EOD | EOD or Intraday | EOD |
| Max Accounts | 5 Funded | 20 Accounts | Multiple pathways |
| Consistency | 20% (Direct) to None (Flex) | 30% | 20% → 25% → 30% (Lightning) |
| Profit Split | 90/10 | 100% of first $25k, then 90% | 100% of first $10k, then 90% |
Other options include FundedNext Futures, Alpha Futures, and Topstep, all offering account sizes ranging from $25,000 to $150,000.
Tools and Resources from DamnPropFirms
DamnPropFirms provides traders with tools and resources to navigate firm-specific rules and make the most of funded accounts. For example, the Consistency Rule Calculator is a must-have for trend-followers. By entering details like account size, profit target, and your largest trading day, you can ensure your trades comply with the firm’s consistency requirements. This prevents a single big win from unintentionally increasing your profit target.
Their monthly prop firm rankings break down firms by payout speeds, drawdown models, and active discounts. For instance, you can use promo code DGT to save on evaluations or get 20% off tools like Bookmap. Detailed guides explain everything from Tradeify’s tiered consistency rules to the differences between Lucid’s account types.
For traders scaling their operations, TradeSyncer is a key resource. It allows you to copy your strategies across multiple funded accounts and platforms, including Apex, Tradeify, Lucid, and FundedNext. Additionally, the Damn Good Traders (DGT) Discord community, with over 3,000 members, provides daily trade setups, P&L analysis, and troubleshooting support for platforms like Tradovate and NinjaTrader.
Conclusion: Mastering Trend-Following in Futures Trading
Trend-following strategies in futures trading offer a structured way to tap into asymmetric risk–reward setups. These systems excel at capturing "fat tail" events, where a small number of trades drive the bulk of returns. They also shine during market downturns, providing positive returns in periods like 2000–02, 2008, and 2020, when traditional portfolios often falter.
One key advantage of these strategies is their ability to remove emotional decision-making. By sticking to predefined rules, traders can sidestep common mistakes like cutting winners short, entering trends too late, or overtrading due to FOMO. Even with relatively low win rates of 30–45%, the outsized gains from successful trades typically outweigh the losses.
Access to scalable capital through proprietary trading firms adds another layer of opportunity. With evaluation fees ranging from $75 to $250 per month, traders can gain access to institutional-level funding – up to $300,000 – while keeping 70% to 95% of the profits. For instance, Apex Trader Funding has distributed over $378 million as of March 2026 and offers tools like copy trading for easier scaling.
To optimize your trend-following system, consider diversifying across 10–20 uncorrelated assets and using ATR-based stops (2–4× ATR) alongside trailing exits instead of fixed targets. Choosing firms with end-of-day trailing drawdown models, such as Tradeify, can help your strategy stay adaptable during volatile market conditions.
For traders looking to refine and expand their approach, resources like the Consistency Rule Calculator, monthly rankings of prop firms, and the Damn Good Traders Discord community – featuring over 3,000 members – offer valuable support. These tools are designed to help traders navigate firm-specific rules, enhance their strategies, and maximize payouts, aligning perfectly with the systematic and disciplined approach outlined in this guide.
FAQs
What’s the simplest trend-following rule set to start with in futures?
Trend-following in futures can be as straightforward as buying when prices go up and selling when they go down, guided by simple indicators like moving averages. For instance, you could go long when the price moves above a 20-day EMA (Exponential Moving Average) and close the position when it falls below. This method is ideal for beginners because it offers clear, easy-to-follow signals without adding layers of complexity.
How do I pick ATR stops and position size without overfitting?
To keep overfitting at bay when choosing ATR stops and determining position size, focus on volatility-based risk management. Here’s how:
- Set stop losses as a multiple of the ATR (Average True Range). This helps adjust for market volatility, ensuring your stops are neither too tight nor too loose.
- Calculate position size by dividing your intended risk amount (like 1% of your total capital) by the stop-loss distance based on ATR. This keeps your risk consistent across trades.
Additionally, avoid creating too many strategy variations. Use tools like walk-forward analysis to test strategies over time, and apply trend filters such as ADX to maintain effectiveness across varying market conditions. This approach ensures your strategy stays balanced and resilient.
How much capital do I need to run a diversified trend-following futures portfolio?
The amount of capital needed for a diversified trend-following futures portfolio varies based on your strategies, the asset classes you trade, and your approach to risk management. For retail traders, it’s crucial to have enough funds to avoid excessive leverage and ride out potential losing streaks. While some start with just a few thousand dollars, a portfolio size of $25,000–$50,000 or more is often suggested. This range allows for better diversification, improved risk control, and the ability to handle market swings effectively.