Mean reversion trading on E-mini S&P 500 (ES) futures can deliver high win rates (60%-90%) in range-bound markets but can fail disastrously in trending or volatile conditions. This strategy capitalizes on price deviations from a moving average, aiming for a "snap back" to the mean. However, it demands precise execution and risk management, especially when trading funded accounts under strict loss limits.
Key takeaways:
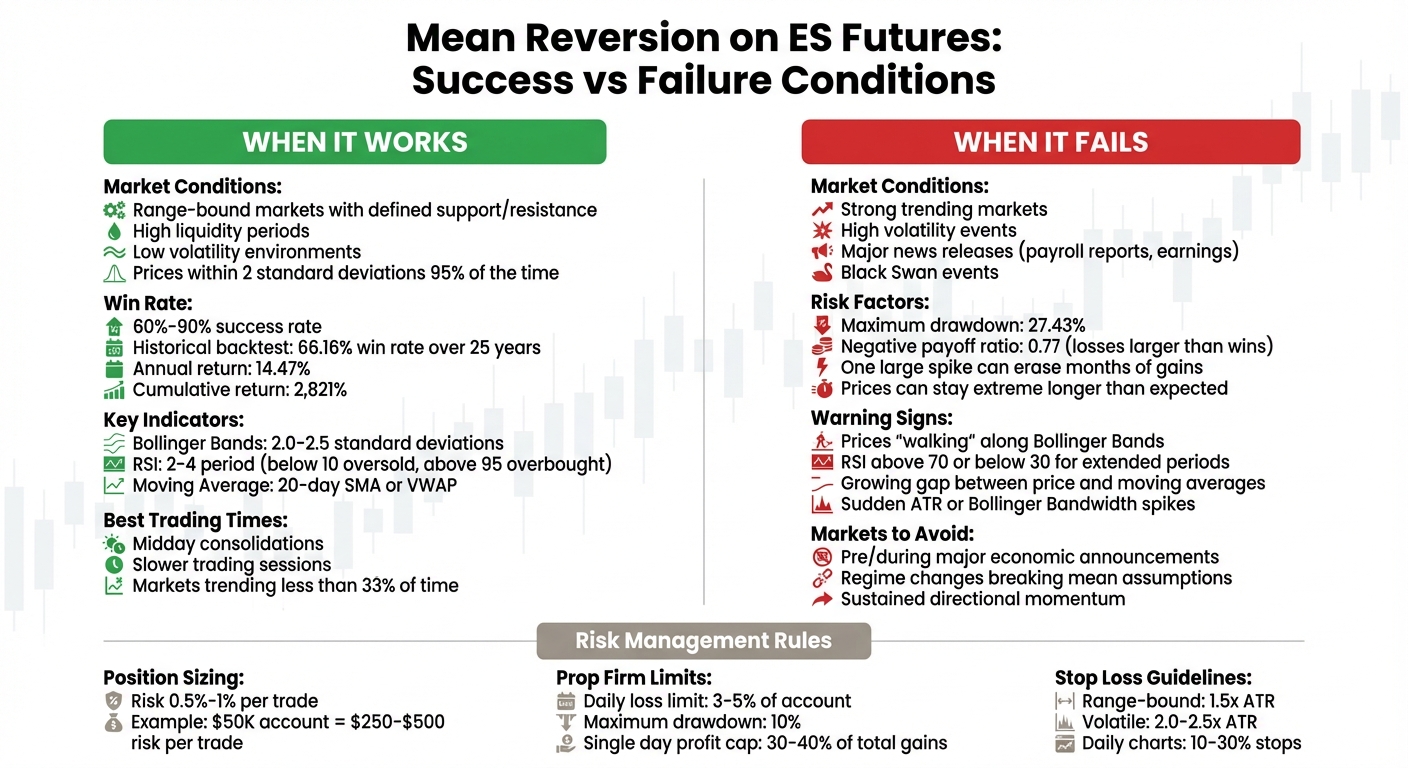
- When it works: Best in range-bound markets with high liquidity and low volatility. Tools like Bollinger Bands and RSI help identify overextensions.
- When it fails: Trending markets or high-volatility events can lead to prolonged deviations, eroding profitability.
- Risk management: Limit risk to 0.5%-1% per trade, use ATR-based stop-losses, and adhere to prop firm rules like daily loss limits and trailing drawdowns.
This article explores how to identify favorable conditions, use effective tools, and manage risks to trade mean reversion profitably on ES futures.
When Mean Reversion Works vs Fails on ES Futures Trading
What Is Mean Reversion in ES Futures
Mean Reversion Defined
Mean reversion is a financial concept that suggests asset prices, volatility, and returns tend to drift back to their historical averages after significant deviations. Think of it like a stretched elastic band – prices pulled too far in one direction often snap back.
"Mean reversion traders rely on the belief that market prices that deviate too far from average will eventually return to their historical levels because these price swings stem from emotional factors… rather than fundamental changes." – Kyle Maring, HighStrike
This strategy hinges on the idea that sharp price swings are often driven by emotional reactions or market inefficiencies, not underlying fundamentals. Traders in the ES futures market, for example, look for notable deviations from benchmarks like a 20-day moving average or VWAP to identify trade opportunities.
Reversion can happen in two ways: either prices directly return to the mean, or they pause long enough for the average to catch up. Interestingly, financial instruments trend less than 33% of the time, spending the other 67% to 70% in range-bound or congestion phases. This makes mean reversion setups more frequent than many traders might expect.
With these principles in mind, the ES futures market provides fertile ground for applying mean reversion strategies effectively.
Why ES Futures Work Well for Mean Reversion
The ES futures market is particularly suited for mean reversion strategies due to several key characteristics. First and foremost is high liquidity. The E-mini S&P 500 futures market ranks among the most liquid in the world. This is crucial because mean reversion strategies often rely on small profit margins per trade, meaning low slippage is essential for success.
Another advantage lies in volatility patterns. Price spikes are common in ES futures, often triggered by economic reports or geopolitical events. These short-term overextensions provide the perfect setup for mean reversion traders to act on. Since ES futures track large-cap stocks closely monitored by institutions and analysts, many of these price movements are temporary "noise" rather than fundamental changes. This makes the eventual normalization of prices a recurring phenomenon.
Finally, the market’s 24-hour trading sessions offer continuous price discovery. Overnight price dislocations caused by global events or economic data often correct quickly when the market reopens. This constant activity creates frequent opportunities for traders to capitalize on the "elastic band" effect, where prices snap back to their moving averages.
The combination of liquidity, volatility, and around-the-clock trading makes ES futures an ideal playground for mean reversion strategies.
Tools and Indicators for ES Mean Reversion
Bollinger Bands
Bollinger Bands create a price envelope around a moving average by using standard deviation. When ES prices move beyond these bands, it often indicates overbought or oversold conditions, signaling a potential return to the mean. Traders commonly use a 20-period setting with 2.0 or 2.5 standard deviations to frame their strategies.
For example, a backtested system using Bollinger Bands set at 2.5 standard deviations showed a win rate of 66.16% over a 25-year period (2000–2025). This resulted in an annual return of 14.47% and a cumulative return of 2,821%. However, the system had a payoff ratio of 0.77, meaning average losses were larger than average wins, though the high win rate compensated for this imbalance.
In October 2023, ES futures experienced a sharp rally following stronger-than-expected earnings from JPMorgan. Prices surged nearly two standard deviations above the 20-day moving average. When a bearish engulfing pattern appeared on the four-hour chart and prices re-entered the upper Bollinger Band, traders spotted a mean reversion opportunity. This setup successfully reverted toward the 20-day moving average.
Momentum tools like the RSI can also help pinpoint when rapid reversals are likely to occur.
Relative Strength Index (RSI)
The RSI measures the speed and magnitude of price changes, helping traders spot when momentum may be overextended. While the standard RSI uses a 14-period setting with thresholds at 70 (overbought) and 30 (oversold), many ES mean reversion traders prefer shorter periods, such as 2 or 3, to capture quicker reversals. For instance, a 4-period RSI below 10 signals extreme oversold conditions, while values above 95–96 indicate extreme overbought levels.
A notable example occurred between August 1 and August 6, 2024, when Kirby Corporation‘s stock dipped below its lower Bollinger Band, and its 2-day RSI signaled oversold conditions. The trade was closed when the 2-day RSI rose above 50, delivering a 2.5% profit in just four trading days.
"Everyone says you get killed trying to pick tops and bottoms and you make all your money by playing the trend in the middle. Well, for 12 years, I have been missing the meat in the middle, but I have made a lot of money at tops and bottoms."
- Paul Tudor Jones, Founder of Tudor Investment Corporation
Moving Averages
Moving averages provide a reference point for price equilibrium, complementing volatility and momentum tools. They act as the "mean" around which prices tend to oscillate. For short-term analysis, the 20-day simple moving average (SMA) is a popular choice to identify dips, while the 200-day SMA helps traders align with the broader trend. For intraday ES trading, the Volume Weighted Average Price (VWAP) often serves as a key focal point.
Simple moving averages are ideal for identifying long-term equilibrium, whereas exponential moving averages (EMA) respond more quickly to price changes, making them better suited for intraday reversals. The strategy revolves around waiting for prices to deviate significantly from the chosen average before anticipating a return.
| Indicator | Primary Use | Typical ES Settings |
|---|---|---|
| Bollinger Bands | Tracks volatility extremes | 2.0 or 2.5 Standard Deviations |
| RSI (Short-term) | Measures momentum exhaustion | 2–4 period RSI (e.g., below 10 or 15) |
| Moving Average | Identifies equilibrium price | 20-day SMA or 50-day SMA |
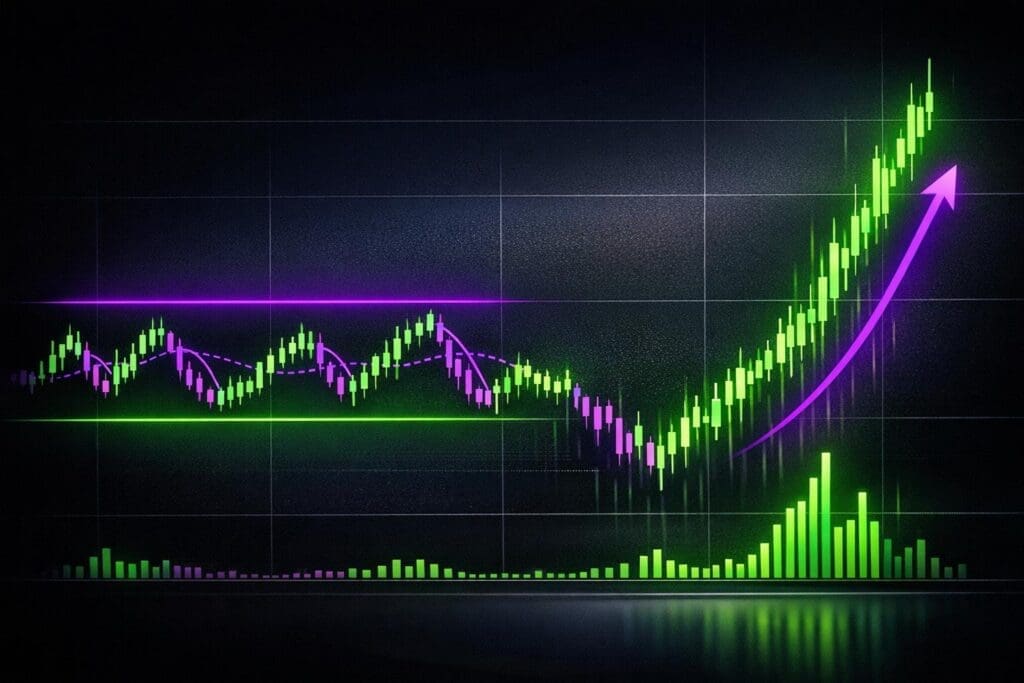
When Mean Reversion Works on ES
Range-Bound Markets
Mean reversion strategies shine when ES futures fluctuate between clearly defined support and resistance levels instead of moving in a consistent trend. In these scenarios, prices tend to hover around their average, creating opportunities to profit by fading extremes and anticipating a return to equilibrium.
"Mean reversion works best when prices move between defined support and resistance levels because they do not form consistent directional trends." – HighStrike
The trick lies in identifying when the market lacks clear momentum. A telltale sign is when prices repeatedly cross the moving average rather than pulling away in a sustained direction. This often happens during midday consolidations or slower trading sessions, where ES futures exhibit choppy, range-bound behavior – ideal conditions for mean reversion setups.
When prices spike beyond two standard deviations above their moving average, it often signals an overextension that’s unlikely to hold. Traders who spot these extremes, especially when confirmed by reversal patterns or a re-entry into Bollinger Bands, can take advantage of the subsequent normalization back toward the mean.
In addition to well-defined price ranges, the ES market’s inherent liquidity and predictable volatility further enhance the effectiveness of mean reversion strategies.
High Liquidity and Low Volatility Periods
ES futures rank among the most liquid contracts in the world, ensuring efficient price reversions. When prices hit statistical extremes, the high number of market participants helps drive a return to equilibrium. Moreover, low volatility keeps prices within two standard deviations of their mean approximately 95% of the time.
"The strategy works best in markets with high liquidity and established trading ranges, particularly in large-cap stocks, ETFs, and major forex pairs." – Trade with the Pros
Low volatility also allows for tighter stop-losses and improved risk-reward ratios. During calm markets, stops can be set around 1.5 times the Average True Range (ATR), whereas volatile conditions might require stops of 2.0 to 2.5 times ATR to avoid getting shaken out by market noise. The combination of high liquidity and low volatility minimizes slippage and transaction costs – critical factors when profit targets are relatively close to entry points.
| Market Condition | Mean Reversion Performance | Trend Following Performance |
|---|---|---|
| Range-bound / Sideways | Excellent (high win rate) | Poor (many false signals) |
| High liquidity + Low volatility | Optimal (predictable reversions) | Limited (small price extensions) |
| Trending / Directional | Poor (prices don’t revert) | Excellent (captures momentum) |
When Mean Reversion Fails on ES
Trending Markets
In ES futures, strong trends can pose serious challenges for mean reversion strategies. When markets trend aggressively, prices can remain at extreme levels far longer than expected. Even worse, the moving average itself can shift upward during the trend, technically fulfilling the "reversion" without any meaningful price correction. This leaves traders stuck in drawdowns, as what seemed like statistically extreme signals turn into costly missteps.
"Mean reversion strategies succeed best when combined with market awareness because traders become vulnerable to trends and regime changes that break the fundamental assumptions of the strategy." – Kyle Maring, HighStrike
To avoid falling into this trap, keep an eye out for red flags. These include prices steadily "walking" along the Bollinger Bands, an RSI lingering above 70 or below 30 for extended periods, and a growing gap between price and short-term moving averages. For example, when recent bank earnings drove ES futures far above the 20-day moving average, the sustained upward momentum made a mean reversion strategy ineffective. As Justin Bennett of Daily Price Action puts it:
"If the market strays too far from the moving averages, it’s generally best to wait for a pullback to the mean before looking to buy or sell."
The lesson here? Avoid fading a move just because it looks statistically extreme. Instead, wait for concrete reversal signals, such as a bearish engulfing candle or a close back inside the Bollinger Bands, before committing to a trade.
While trending markets can derail mean reversion strategies, sudden spikes in volatility bring their own set of challenges, which we’ll explore next.
High Volatility Events
Just as trends can undermine the reliability of the mean, sharp bursts of volatility can make traditional indicators unreliable. Major news events often cause prices to overshoot common technical thresholds, like Bollinger Bands or RSI levels. For instance, a strong U.S. payroll report once caused Dow futures to jump 300 points in a single session, blowing past typical reversion zones.
In these high-volatility scenarios, mean reversion strategies become riskier. While these strategies often boast a high win rate, their downside is a negative payoff ratio – meaning one large, uncorrected spike can wipe out months of gains. The 2008 Global Financial Crisis serves as a stark reminder of how unexpected "Black Swan" events can completely upend the usual dynamics of mean reversion.
To navigate these risks, consider using ATR-based stop-losses instead of fixed stops, as they adjust to changing market conditions. It’s also a good idea to steer clear of mean reversion trades right before or during major news events. Pay attention to indicators like ATR or Bollinger Bandwidth – if they suddenly spike, the market may have entered a new regime where traditional reversion strategies are less effective.
sbb-itb-46ae61d
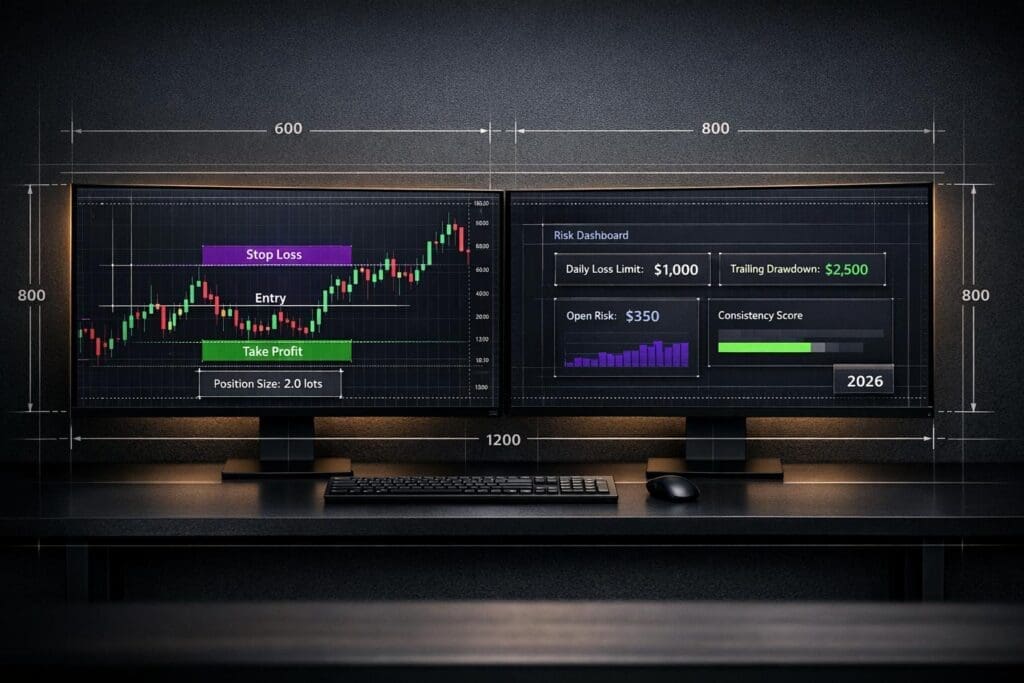
How to Set Up a Mean Reversion Trade on ES
Entry Rules
Start by using the 20-day Simple Moving Average (SMA) as your reference point. Look for price movements that extend two to 2.5 standard deviations away from this baseline. Tools like Bollinger Bands or Z-scores can help measure these deviations.
To confirm that the price is overextended, check momentum oscillators. Look for clear signs of exhaustion, such as a bearish engulfing candle on a 4-hour chart for short trades, or a price closing back within the upper Bollinger Band. For long trades, watch for a close below the lower Bollinger Band, followed by a reversal pattern.
"Mean reversion in futures trading doesn’t rely on long-term trends. Whether prices are rising or falling, this strategy focuses on short-term overextensions." – NinjaTrader Team
Add an extra layer of confirmation by filtering trades. For example, take long setups only when the ES is trading above its 200-day moving average. This approach has shown strong results in backtested systems. A practical example from October 2023 involved traders waiting for a bearish engulfing candle on a 4-hour chart after a two-standard-deviation price spike, which led to a successful reversion trade.
Use limit orders instead of market orders for better precision. For instance, in a long setup, you might place a limit order 3% below the signal price to take advantage of temporary price dips during volatile conditions.
Once you’re in a trade, shift your focus to a structured exit strategy to lock in profits and manage risks effectively.
Exit Strategies
After entering a trade, plan your exits to balance profit-taking and risk control.
Aim for the price to return to the 20-day SMA or VWAP. Exit the trade when the price reaches this dynamic average, or use the 2-period RSI as a guide – close long positions when the RSI crosses above 50, and close shorts when it dips below 50.
"The profit target (the average) is constantly moving, so traders may opt to update it with the completion of every price bar." – CMC Markets
Consider time-based exits to avoid holding positions too long. If the price hasn’t reverted within 1 to 5 trading days, close the trade to prevent losses from potential market shifts. Research has shown that mean reversion strategies using a 2-day RSI exit or a 10-day time limit achieved a 2,821% total return with a 67% win rate.
Protect your trades with stop losses. Place them just beyond recent swing points – above the swing high for shorts or below the swing low for longs. Mean reversion setups often require wider stops, ranging from 10% to 30% on daily charts, to allow time for the reversal to develop. You can also consider partial exits: close half of your position once the price hits the mean, and let the rest run to capture any additional overshoot in the opposite direction.
These entry and exit strategies provide a solid foundation for trading mean reversion on ES while maintaining disciplined risk management.
Risk Management for Mean Reversion on Funded Accounts
Position Sizing and Capital Allocation
When trading mean reversion strategies on a funded account, precision in position sizing is non-negotiable. A widely recommended guideline is to risk between 0.5% and 1% of your account equity on each trade [34, 36]. For instance, with a $50,000 account, this translates to risking $250 to $500 per trade setup.
Your position size should align with the stop-loss distance. Let’s say your stop-loss is 15 points on the ES (E-mini S&P 500), with each point worth $50. A single contract would risk $750, exceeding the $500 limit. In this case, trading a Micro E-mini (MES) contract, which has a smaller tick value, allows you to stay within your risk tolerance [9, 4].
Market volatility plays a big role in position sizing. During periods of higher volatility, tools like the Average True Range (ATR) can help you adjust your position size. This ensures that your dollar risk stays consistent, even if the stop-loss distance increases [34, 36]. If your account experiences a 5% drawdown, cutting your position size by half is a prudent step. A 25-year backtest revealed a win rate of 66.16%, but with a maximum drawdown of 27.43%, highlighting the importance of disciplined risk management.
Once you’ve nailed down your position sizing, it’s equally important to follow your proprietary trading firm’s strict risk rules to protect your capital.
Following Prop Firm Rules
Managing your trades isn’t just about personal risk control – it’s also about adhering to the rules set by your prop firm. Most firms impose daily loss limits between 3% and 5% of your account balance, with maximum drawdowns typically capped at 10%. Treat these limits as hard stops. If you hit your daily loss limit, stop trading immediately.
"Your primary job as a trader is not to maximize gains on every trade, but to stay in the game long enough to let your edge play out over time." – Prop Firm Plus
To add an extra layer of protection, consider setting your personal daily loss limit below the firm’s maximum, such as stopping at 3% even if the firm allows 5%. This buffer can help guard against slippage or emotional decision-making.
Consistency rules are another factor to watch. Some firms, like Lucid Trading, limit the profit you can make in a single day to 30–40% of your total gains. Exceeding this cap could impact your evaluation, even on a highly profitable day [37, 39].
Trailing drawdowns also require careful attention. Many firms use an "end-of-day" trailing drawdown that adjusts based on your highest closed balance. For example, if your balance grows from $50,000 to $52,000 with a $2,000 maximum loss limit, your liquidation threshold moves up from $48,000 to $50,000. Building a profit buffer before requesting payouts can prevent you from breaching this threshold immediately.
To reduce emotional decision-making, always use bracket orders. By pre-setting your stop-loss and take-profit levels before entering a trade, you remove the guesswork – an essential practice when trading fast-moving mean reversion strategies [38, 40].
Mean Reversion | How to Do Futures
Conclusion
Let’s wrap up the key points for executing mean reversion trades effectively on ES futures.
Mean reversion strategies thrive in range-bound markets, where ES futures often revert predictably after extreme price moves. Thanks to their liquidity and volatility, ES futures are well-suited for capturing these opportunities. Historical backtests reinforce the potential profitability of this approach.
However, these strategies can falter in trending markets or during periods of heightened volatility. As Kyle Maring highlights, markets don’t always revert as expected. Recognizing when conditions have shifted is critical – sometimes, stepping aside is the wisest move. This awareness is especially important for traders using funded accounts, where preserving capital is paramount.
If you’re trading with a funded account, focus on protecting your balance. Limit risk to 0.5%–1% per trade, use volatility-based stop-losses (like those tied to the Average True Range), and stay well within your prop firm’s daily loss limits – most firms cap losses at around 5%. Setting your own threshold slightly below this maximum can provide a safety net against sudden market swings.
To confirm trade setups, rely on tools such as Bollinger Bands, RSI, and moving averages. Pre-setting bracket orders can also help you avoid impulsive decisions during fast-moving markets.
Ultimately, mean reversion strategies excel when you respect market dynamics, manage risk with discipline, and follow your prop firm’s rules to the letter. Stick to these principles, and you’ll be well-positioned to achieve consistent returns on your funded account.
FAQs
What are the best tools for spotting mean reversion opportunities in E-mini S&P 500 (ES) futures?
The best way to spot mean reversion setups in ES futures is by using a combination of volatility bands, a trend-following moving average, and an oscillator to detect overbought or oversold conditions.
- Bollinger Bands: These highlight when the price moves significantly beyond its recent range, suggesting a possible pullback toward the average.
- 50-period exponential moving average (EMA): This acts as a dynamic mean line, where large price deviations often hint at a potential reversion.
- Relative Strength Index (RSI): This tool identifies overbought conditions (above 70) or oversold conditions (below 30), which often align with extreme price movements.
To identify high-probability mean reversion opportunities, look for a combination of these signals. For example, price touching a Bollinger Band, a wide gap from the 50-EMA, and an RSI reading in the extreme zone can indicate a strong setup.
What are the best ways to manage risk when using mean reversion strategies in volatile ES markets?
Managing risk in the unpredictable E-mini S&P 500 (ES) markets is a must for traders relying on mean reversion strategies. Price swings can last longer than anticipated, and the market’s "mean" can shift, leaving traders exposed to potentially large losses if their positions are too large or lack protection.
To navigate these challenges, it’s wise to keep position sizes small, ideally no more than 1% of your account balance per trade. Pair this with volatility-adjusted stop-losses, using tools like the Average True Range (ATR). This approach ensures your stop-loss levels reflect current market conditions rather than being set arbitrarily. To enhance accuracy, you can also use confirming indicators – such as RSI or moving averages – to confirm that the price is genuinely stretched and showing signs of a reversal before entering a trade.
It’s also smart to avoid trading during periods of high-impact news or at market open/close, as these times often bring unpredictable price swings. Set clear profit targets and consider using trailing stops to lock in gains as the price moves back toward the mean. By staying disciplined and cautious, you can take advantage of mean reversion opportunities while minimizing the risk of significant losses.
Why do mean reversion strategies struggle in trending markets, and how can traders identify these trends?
Mean reversion strategies operate on the belief that prices will eventually return to their average after moving away from it. But in trending markets, this approach often breaks down. Instead of reversing, prices may keep moving in the same direction, turning small, steady gains into significant losses as the trend persists.
To steer clear of these risks, keep an eye out for critical momentum indicators like higher highs and higher lows (or lower lows and lower highs), widening Bollinger Bands, and volume spikes showing increased activity. Tools that track order flow can also provide valuable insights, revealing strong market-order pressure and reduced passive absorption – both signs of a market transitioning into a trend. Pairing these signals with trend-following strategies, such as moving-average crossovers, can help traders sidestep mean reversion setups during strong trends, preserving their capital and avoiding unnecessary losses.