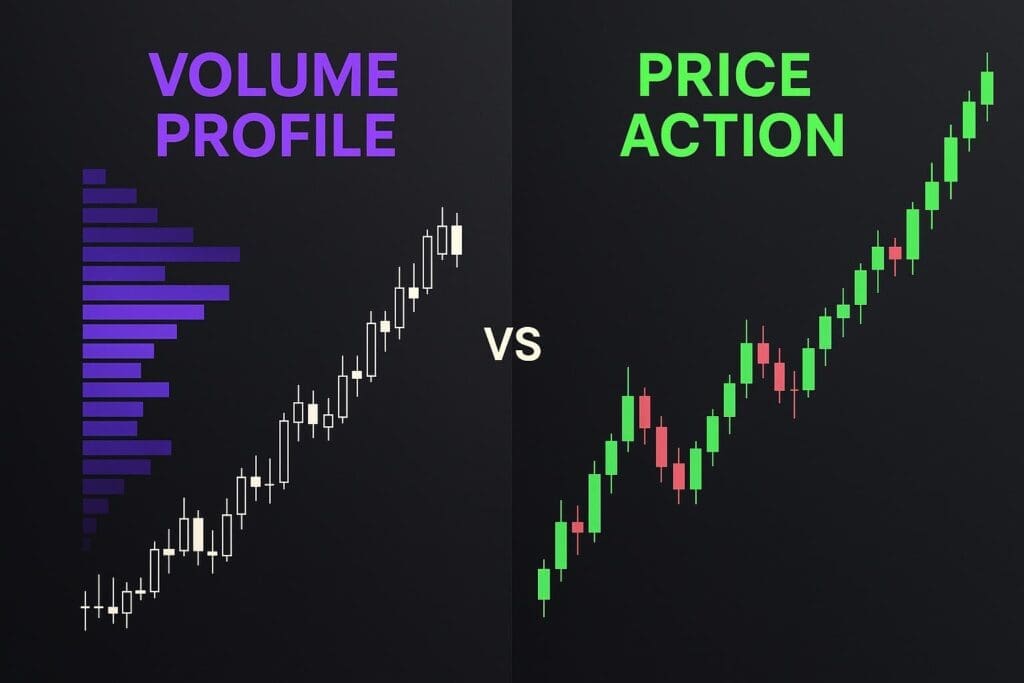
Volume Profile and Price Action are two popular trading methods that cater to different needs. Here’s the core idea:
- Volume Profile focuses on identifying price levels with the most trading activity. It uses volume data to highlight key areas like support, resistance, and fair value zones.
- Price Action relies on analyzing historical price movements, such as candlestick patterns, support/resistance levels, and market structure, to interpret market sentiment and trends.
Key Difference: Volume Profile is driven by volume data, showing where activity happens, while Price Action interprets how price behaves over time. Together, they can provide a balanced view of market dynamics.
Quick Comparison
| Aspect | Volume Profile | Price Action |
|---|---|---|
| Focus | Volume concentration | Price movement patterns |
| Data Used | Volume data | Price data only |
| Best For | Range-bound markets | Trending/volatile markets |
| Strength | Identifies key support/resistance | Tracks momentum and trends |
| Weakness | Lags in fast markets | Can be subjective |
📈 How to Improve Price Action Trading with Volume Profile
How Price Action Works
Price Action trading strips away indicators to focus entirely on the raw movement of price. Traders who use this approach analyze elements like candlestick patterns, market structure, and key price levels to guide their decisions. The idea is simple: price itself is the most reliable indicator because it reflects the collective decisions of all market participants.
Instead of relying on lagging indicators, Price Action traders interpret market behavior by observing visual patterns on the chart. For example, a strong bullish candle closing near its high signals that buyers were in control during that period. On the other hand, a candle with a long upper wick near a resistance level shows sellers stepping in to push prices lower.
Core Concepts of Price Action
Price Action trading relies on three main principles: candlestick patterns, support and resistance levels, and market structure. Each of these provides valuable insights into market dynamics and potential future price movements.
- Candlestick patterns: These are the foundation of Price Action analysis. The shape of a candlestick – determined by its open, high, low, and close – reveals market sentiment. For instance, a pin bar, with a small body and a long wick, often signals rejection and a possible reversal. Engulfing patterns, where a larger candle completely covers the range of the previous one, suggest a shift in momentum. Inside bars, where a candle’s range is contained within the previous one, often precede breakouts.
- Support and resistance levels: These are key price zones where the market has historically reacted. A level becomes more reliable the more times price has touched it. In futures markets like the E-mini S&P 500 or crude oil, these levels often align with areas where large institutional traders have placed significant orders.
- Market structure: This refers to the sequence of price movements, such as higher highs and higher lows in an uptrend or lower lows and lower highs in a downtrend. A break in the market structure – like a failure to make a higher high in an uptrend – can signal a potential trend reversal. Understanding market structure helps traders align their trades with the prevailing trend instead of working against it.
Common Tools for Price Action Traders
Price Action traders use several tools to identify high-probability trading opportunities.
- Trendlines: These are drawn by connecting a series of higher lows in an uptrend or lower highs in a downtrend. They help traders gauge the strength and direction of price movement. When price approaches a trendline, traders watch closely to see if it bounces or breaks through, signaling a potential reversal.
- Fibonacci retracements: These are used to identify potential pullback levels during trends, based on mathematical ratios like 23.6%, 38.2%, 50%, 61.8%, and 78.6%. For instance, after a strong rally in treasury bond futures, a trader might look for a pullback to the 61.8% Fibonacci level as a possible entry point for the next upward move.
- Candlestick formations: Patterns like pin bars, engulfing candles, or breakaway gaps are critical for decision-making. A strong trending candle that closes near its high or low indicates sustained momentum. These patterns are especially reliable when they form at significant support or resistance levels, where multiple factors align to increase the likelihood of a predicted move.
Strengths and Weaknesses of Price Action
Price Action trading has clear advantages that explain its popularity among professional traders. Its visual nature makes it straightforward to spot patterns directly on the chart without relying on complex indicators. This simplicity allows traders to quickly identify opportunities.
Another benefit is its versatility – it works across all timeframes, markets, and instruments. Whether you’re analyzing a 5-minute chart for E-mini S&P 500 contracts or a daily chart for crude oil, the principles remain the same. Additionally, Price Action requires minimal tools, keeping costs and technical complexity low. A clean chart with candlesticks and key levels is often all you need.
Perhaps the most valuable aspect of Price Action is its focus on understanding market psychology. Price patterns reveal the behavior of large traders and market makers, offering insights into how they move the market. This approach encourages traders to think critically about price movements rather than blindly following indicator signals.
However, Price Action does have its challenges. Its biggest drawback is subjectivity. Two traders might interpret the same price pattern differently, leading to inconsistent decisions. This reliance on experience and judgment makes it harder for beginners to apply consistently. It also complicates backtesting, as there are no strict quantitative rules to follow.
Another limitation is that Price Action ignores volume data, which can be crucial for confirming the strength of price movements. For example, a bullish pattern might appear strong on the chart, but declining volume could indicate weak conviction behind the move. Combining Price Action with tools like Volume Profile can help fill this gap.
Price Action is also prone to false signals in sideways or choppy markets. A pin bar at support might look promising, but if the market lacks direction, the pattern may fail to deliver the expected result. Mastering Price Action requires significant screen time to develop the pattern recognition skills needed to filter out low-quality setups.
Lastly, there’s the risk of over-trading. Watching price movements constantly can tempt traders to act on every pattern they see, even when the risk-reward ratio isn’t favorable. Discipline is essential to avoid taking unnecessary trades.
For traders, especially those in futures markets, understanding both the strengths and weaknesses of Price Action is key. While it can provide valuable insights into market behavior, combining it with other methods like Volume Profile can offer a more comprehensive approach. This foundational understanding of Price Action sets the stage for exploring its relationship with Volume Profile in future sections.
How Volume Profile Works
Volume Profile organizes trading volume by price level instead of time, creating a horizontal histogram that highlights key price zones. Longer bars in the histogram indicate higher trading activity at that price, while shorter bars show less activity. This layout makes it easy to spot the price levels where the market focused its buying and selling, offering a clear view of the most important areas for traders.
For example, if crude oil futures traded between $70 and $80, Volume Profile identifies the specific prices where the majority of contracts were exchanged. This is far more useful than simply knowing the total trading volume for the entire session.
How Volume Profile Displays Market Activity
Volume Profile’s structure breaks trading activity into key zones that provide meaningful insights:
- Point of Control (POC): This is the price level with the highest trading volume during the selected timeframe. Prices often return to the POC during retracements or periods of consolidation, making it a critical reference point for traders.
- High-Volume Nodes (HVN): These are price levels with significant trading activity. HVNs can act as support when the price is above them or resistance when it’s below. When the price revisits these levels, it’s common for buyers or sellers to step in.
- Low-Volume Nodes (LVN): These represent price levels with minimal trading activity. Prices tend to move quickly through LVNs, as the lack of volume offers little resistance, often signaling potential breakout opportunities.
In balanced or sideways markets, the price tends to cluster around the POC, forming a bell curve-like distribution. Heavy volume occurs near the midpoint, while lighter volume appears at the highs and lows, reflecting an equilibrium where buyers and sellers are evenly matched.
In trending markets, the volume distribution shifts. A P-shaped profile – wider at the top and narrower at the bottom – indicates increasing volume at higher prices, often signaling bullish sentiment. Conversely, a B-shaped profile – narrow at the top and wider at the bottom – shows more activity at lower prices, which could suggest bearish sentiment or the early stages of a bullish base-building phase.
Key Features of Volume Profile
When prices trade within the value area, it indicates a balanced market where participants perceive prices as fair. Prices often revisit this area during retracements, offering potential entry points.
Volume Profile identifies support and resistance zones based on actual trading activity rather than arbitrary levels. For example, in an uptrend, if the price retraces to an HVN, it may act as a support level, providing a potential buying opportunity.
Heavy trading volume reflects strong market conviction, while light volume suggests hesitation or uncertainty. By analyzing volume and price patterns, traders can find optimal entry and exit points where the market has shown clear commitment.
These insights help traders validate support and resistance levels while refining their strategies for entering and exiting trades.
Strengths and Weaknesses of Volume Profile
Volume Profile stands out for its ability to pinpoint critical price zones with precision. Unlike traditional support and resistance levels, which rely solely on price, Volume Profile highlights areas where real trading activity occurred. This makes these levels more reliable, as they’re based on objective data rather than subjective interpretation.
The tool is especially valuable in range-bound or consolidating markets, where prices fluctuate around a perceived fair value. Traders often use the Value Area and POC as benchmarks for mean reversion strategies, expecting prices to return to these zones after brief deviations.
Additionally, Volume Profile helps distinguish between consolidation and trending markets by analyzing volume distribution patterns. This allows traders to adjust their strategies – focusing on mean reversion in sideways markets and trend-following in directional markets.
However, Volume Profile has its limitations. In low-volume or inactive markets, the lack of trading activity can make it difficult to identify meaningful patterns, reducing its usefulness. During extreme market events, such as flash crashes or sudden price gaps, prices can move rapidly through LVNs with little resistance. For instance, during the 2010 flash crash, prices quickly passed through LVNs, defying typical expectations.
In highly volatile or choppy markets, where prices swing erratically without forming clear value areas, Volume Profile can produce misleading signals. The POC and Value Area may shift frequently, complicating the process of identifying stable reference points. Additionally, the tool’s effectiveness varies with the chosen timeframe. A 5-minute Volume Profile may show patterns that differ significantly from a daily one, so traders need to select timeframes that align with their trading style.
While Volume Profile offers valuable insights into trading activity, it works best when combined with other analytical tools. For traders working with futures like treasury bonds, crude oil, or E-mini contracts, understanding both the strengths and limitations of Volume Profile is crucial. Knowing when to rely on it – and when to be cautious – can make a significant difference in trading outcomes.
Volume Profile vs Price Action: Key Differences
Analytical Foundations Compared
Volume Profile and Price Action analyze the market from two distinct perspectives. Volume Profile is a volume-by-price indicator that reveals the total trading activity at different price levels over a set period. It creates a horizontal histogram, pinpointing price levels with the highest trading activity. This technique emphasizes where significant trading occurred, offering a map of market behavior based on actual transaction data.
On the other hand, Price Action focuses on how prices move over time. It examines candlestick patterns, support and resistance levels, and sequences of price movement, without relying on volume data. Price Action traders interpret market dynamics through the visual cues of price – such as the open, close, high, and low of each period. The core question becomes: "What patterns emerged from price movement?"
The difference between these approaches goes beyond data sources. Volume Profile provides reference points derived from trading data. For example, the Point of Control (POC) identifies the price level with the highest trading volume – a measurable fact. Similarly, High Volume Nodes (HVNs) and Low Volume Nodes (LVNs) highlight areas of significant or limited trading activity, offering clear zones of market interest.
In contrast, Price Action relies heavily on a trader’s experience and pattern recognition skills. Two traders might look at the same chart and interpret it differently. For instance, one might see a pin bar as a strong reversal signal, while another might find it less compelling. This subjectivity doesn’t diminish Price Action’s utility but does mean its effectiveness varies with the trader’s expertise.
Volume Profile excels at answering questions about market structure and fair value zones by identifying price levels with substantial trading activity. Price Action, meanwhile, delves into momentum shifts, trend direction, and behavioral patterns by analyzing price movement directly. Its insights emerge from real-time dynamics, making it highly responsive to immediate market changes.
These fundamental differences set the stage for evaluating the strengths, weaknesses, and best applications of each method.
Advantages and Disadvantages Comparison
The table below highlights the key strengths and limitations of Volume Profile and Price Action.
| Aspect | Volume Profile | Price Action |
|---|---|---|
| Primary Focus | Volume concentration | Price movement patterns |
| Data Requirements | Needs volume data | Relies solely on price data |
| Objectivity | Based on trading data | Relies on subjective interpretation |
| Best Market Conditions | Range-bound and consolidating markets | Trending and volatile markets |
| Key Tools | POC, Value Area, HVN, LVN | Support/resistance, trendlines, candlestick patterns |
| Real-Time Responsiveness | Less immediate, needs data accumulation | Highly responsive to price changes |
| Support/Resistance Basis | Derived from volume data | Based on historical price actions |
| Learning Curve | Moderate, requires volume analysis understanding | Steep, demands pattern recognition skills |
| Extreme Market Moves | Vulnerable in thin-volume zones | Prone to false breakouts |
| Fair Value Identification | Uses POC and Value Areas | Relies on price history and patterns |
Volume Profile shines when identifying critical support and resistance levels grounded in actual trading activity. For example, the POC often serves as a reliable fair value reference, guiding price corrections in range-bound markets. However, its reliance on historical data can be a drawback during sharp market moves or flash crashes, where price can cut through low-volume zones with minimal resistance. Additionally, in fast-moving markets, Volume Profile may lag behind real-time action.
Price Action’s strength lies in its adaptability and real-time analysis. It’s ideal for spotting trend shifts, breakouts, and reversals without relying on additional indicators. This makes it especially useful for traders looking to seize short-term opportunities. However, its subjective nature can lead to misinterpretation. Traders might incorrectly identify patterns or support/resistance levels, resulting in false signals – particularly when price breaks a level without volume confirmation. Ultimately, success with Price Action depends on the trader’s ability to filter meaningful patterns from market noise.
Best Use Cases for Each Method
Knowing when to apply each method can enhance a trader’s overall strategy in the futures market. Each approach thrives in specific market conditions.
Volume Profile is particularly effective for swing trading and long-term analysis. On daily or weekly charts, accumulated volume highlights clear value zones and POC levels, which are helpful for tracking multi-day trends. For example, when analyzing crude oil futures over a monthly timeframe, Volume Profile can reveal significant liquidity zones tied to hedging and speculative activity.
Price Action, by contrast, is ideal for intraday trading. Its ability to capture real-time momentum shifts makes it perfect for shorter timeframes like 5-minute or 15-minute charts. For instance, a day trader working with E-mini Nasdaq futures can use Price Action to spot breakouts or reversals as they occur, without waiting for volume data to accumulate.
Additionally, Price Action works across all timeframes, though pattern interpretation varies based on the chart scale. A head and shoulders formation on a 5-minute chart might indicate a short-term reversal, while the same pattern on a daily chart could signal a longer-term trend change. This flexibility makes Price Action a valuable tool for traders operating on various time horizons.
sbb-itb-46ae61d
Combining Volume Profile and Price Action
Pairing Volume Profile with Price Action provides traders with a more complete understanding of market behavior. While Price Action highlights when and how the market moves, Volume Profile identifies where the most trading activity has occurred. These two methods work together seamlessly – Price Action offers directional insight and timing, while Volume Profile confirms whether specific price levels hold actual market significance. When both align, the likelihood of a successful trade increases.
Using Price Action for Context and Volume Profile for Confirmation
Price Action defines market structure through elements like candlestick patterns, support and resistance levels, and trend direction. Once this context is established, Volume Profile steps in to confirm these levels by showing where actual trading activity has taken place.
For instance, if Price Action identifies a critical resistance level based on historical price rejections, and Volume Profile reveals a High Volume Node (HVN) at the same level, this resistance becomes much more reliable. The HVN indicates that significant trading occurred at that price, reinforcing its importance. Similarly, when price breaks through a Low Volume Node (LVN) with strong volume, it often moves quickly, as fewer traders are active at those levels.
The Point of Control (POC) is another powerful tool for confirmation. It marks the price level where the highest volume occurred, often reflecting the market’s "fair value" during a specific period. For example, if a reversal pattern like a hammer or double bottom forms near the POC, traders gain dual confirmation that the price is likely to bounce. Stop-loss orders can also be strategically placed just beyond significant volume nodes, such as above an HVN for short trades or below an LVN for long trades.
The Value Area, which typically represents about 70% of trading volume, adds another layer of insight. For example, in an uptrend identified by Price Action, if the price moves significantly above the Value Area High (VAH), it might indicate that the market is overextended and could be due for a pullback. Conversely, if Price Action signals a reversal near the Value Area Low (VAL), this zone may reflect strong historical buying interest.
Market conditions also influence how traders balance these methods. In trending markets where Price Action shows clear momentum, traders often rely on Volume Profile’s LVN breakout strategy. Here, the volume distribution may appear skewed – P-shaped for uptrends or b-shaped for downtrends – further confirming the trend’s strength. In consolidating markets, where the POC remains stable, traders might focus on a Value Area fade strategy, selling near the VAH and buying near the VAL with the expectation of a return to the POC.
Building a Combined Trading Strategy
To create a systematic trading plan that integrates these methods, use Price Action as the primary filter and Volume Profile as the secondary confirmation tool.
The first step is identifying potential setups with Price Action. Look for patterns like bullish engulfing candles, trendline breaks, or support retests that align with your trading style and timeframe.
Next, overlay Volume Profile to confirm these setups. Check if the identified price level corresponds with an HVN for support/resistance trades or an LVN for breakout trades. This step helps filter out setups that lack volume backing.
Then, analyze the volume distribution’s shape. A P-shaped distribution (wider at the top) suggests bullish momentum, while a b-shaped distribution (wider at the bottom) indicates bearish momentum or consolidation.
For entries, Price Action can help with timing, while Volume Profile pinpoints optimal price levels. For example, if a bullish reversal pattern appears and the Volume Profile shows an HVN just below the current price, entering near that HVN could offer a solid setup.
Exits also benefit from this combined approach. If Price Action suggests a mean reversion trade, targeting the POC makes sense since price often returns to this level after a strong move. In trending markets, the upper boundary of the Value Area (VAH) can serve as a profit target in bullish moves, while the lower boundary (VAL) works for bearish trades.
Volume Profile also helps with scaling out of positions and avoiding false breakouts. For instance, traders might take partial profits at LVNs, as price tends to accelerate through these low-volume areas. A true breakout is often accompanied by a surge in volume through an LVN, confirming its validity. On the other hand, a breakout through an HVN with weak volume could signal a false move.
Swing traders can use the Value Area to gauge market conditions. If Price Action shows a strong uptrend but the price has moved significantly above the VAH, Volume Profile might suggest the market is overextended, increasing the likelihood of a pullback into the Value Area. This insight can guide profit targets or position adjustments as the price nears the VAH.
By integrating these methods, traders can adapt to different market conditions. In balanced markets with sideways movement, where both Price Action and Volume Profile show a stable POC, traders might avoid taking large positions until a breakout occurs. This approach minimizes exposure to low-probability trades.
Mastering this combination takes practice and careful observation, but the rewards can be worthwhile. Using both Price Action and Volume Profile together helps traders reduce false signals and make more precise, well-informed decisions.
Common Mistakes with Both Methods
Even experienced traders can stumble when using Volume Profile and Price Action. Missteps often arise from misunderstanding how these tools work or applying them in unsuitable market conditions. Spotting these errors early can save traders from unnecessary losses and help them develop more reliable strategies.
Misreading Price Action Signals
Price Action’s subjective nature means that two traders might interpret the same chart in completely different ways. This can lead to issues, especially when pattern recognition ignores the broader market context.
A frequent mistake is over-relying on candlestick patterns without additional confirmation. For instance, a trader might see a pin bar or bullish engulfing candle and assume a reversal is imminent, without considering whether there’s actual buying or selling conviction behind the move.
Take the example of a bullish engulfing candle forming at a support level. At first glance, it might seem promising. But if it occurs on low volume, it could simply reflect a few traders taking profits rather than a genuine influx of buyers. In such cases, the price could reverse sharply when real selling pressure kicks in. This is especially common during low-liquidity periods or off-hours trading, where patterns can be deceptive.
Another pitfall is ignoring the pattern’s placement within the overall market structure. A reversal pattern at a key support level holds much more weight than one forming in the middle of a range. Without volume confirmation, traders often act on patterns that lack meaningful market participation, leading to false breakouts or whipsaws.
Price Action becomes even trickier in choppy or consolidating markets, where patterns are less clear. Without objective data like volume to back up their decisions, traders may enter positions with poor risk-reward ratios or place stops in illogical spots based solely on their interpretation of price movement.
Misusing Volume Profile
Mistakes with Volume Profile often fall into a few key categories, each capable of causing significant losses. One of the most common errors is misinterpreting low-volume nodes (LVN) as guaranteed breakout zones. While low-volume areas may present less resistance, assuming that every price move through an LVN will lead to a breakout is a risky oversimplification. Price can easily slip through these zones, only to reverse sharply when it encounters the next major support or resistance level.
A good example is the 2010 Flash Crash, where prices sliced through low-volume zones with minimal resistance. These dramatic moves appeared to signal major trend reversals but were actually driven by a lack of liquidity rather than genuine market sentiment.
Another error involves using Volume Profile in thinly traded markets, where the volume data itself may not be reliable. In such cases, the histogram bars might not accurately reflect true market activity, leading to misleading signals about support and resistance levels. Volume Profile is most effective in trending or consolidating markets with adequate liquidity. In contrast, it often provides little value in choppy, range-bound conditions where volume patterns lose their significance.
Traders also frequently misinterpret the Value Area (the range where about 70% of session volume occurs). Many mistakenly treat the Value Area High (VAH) and Value Area Low (VAL) as rigid barriers. For example, if a stock opens at $100 with a Point of Control (POC) at $101 and then starts trending upward, a trader waiting to short at the POC might miss the entire move and get stopped out if the price never returns.
Lastly, traders often fail to adapt their Volume Profile strategies to different market conditions. In trending markets, the profile distribution skews – forming a P-shape (wider at the top) during uptrends or a b-shape (wider at the bottom) during downtrends. Traders accustomed to range-bound profiles may misread these distributions and apply the wrong strategies, leading to losses.
How Using Both Methods Reduces Errors
By combining Volume Profile with Price Action, traders can create a system that minimizes errors and reduces the likelihood of false signals. This approach helps organize trading data into a clearer structure, making it easier to identify opportunities while avoiding subjective misinterpretations.
Here’s how it works: when a trader spots a potential setup using Price Action – like a bullish engulfing candle at a support level – they can cross-check it with Volume Profile. If the support level aligns with a high-volume node or falls within the Value Area, it suggests that buyers have historically shown interest at that price level. This dual confirmation strengthens the trade setup.
On the flip side, if the Price Action signal appears at a low-volume node with no history of strong trading activity, the trader might skip the trade or wait for further confirmation. This step helps avoid trades based solely on subjective pattern recognition.
For breakout trades, combining both methods becomes even more valuable. A valid breakout typically shows conviction in both price movement and volume. For example, a breakout above resistance on low volume is more likely to fail compared to one accompanied by a surge in volume. Volume Profile can reveal whether the breakout is happening through a high-volume node (indicating strong resistance that requires significant conviction to overcome) or a low-volume node (suggesting the breakout may be easier but potentially less sustainable).
This combined approach also helps differentiate between genuine price moves and false signals caused by low liquidity or algorithmic trading. If a Price Action pattern forms but Volume Profile shows minimal trading activity at that level, the signal likely lacks real market participation. This insight can save traders from falling into traps that come with relying on just one method.
When to Use Each Method
This section dives into when to apply Price Action, Volume Profile, or a combination of both, depending on your trading style and timeframe.
Using Price Action for Intraday Trading
Price Action is ideal for intraday traders who need to make quick decisions within tight timeframes, ranging from a few minutes to several hours. It allows traders to respond swiftly to market movements without waiting for volume confirmation.
By analyzing candlestick patterns and support/resistance levels, Price Action reflects real-time market sentiment. For instance, on a 5-minute or 15-minute chart, spotting a bearish engulfing candle at resistance or a bullish pin bar at support provides immediate trading signals. This speed is critical for trades that open and close within the same day.
Take this example: If the ES approaches resistance at $4,500 and forms a bearish engulfing pattern on a 5-minute chart, you could enter a short position with a stop above the recent high and aim for the next support level. These patterns reveal market psychology in the moment, such as price rejection, momentum shifts, and breakouts – all crucial for intraday trading.
Price Action particularly shines in trending markets. When prices consistently form higher highs and higher lows in an uptrend, traders can identify pullbacks to support levels and use continuation patterns, like flags or pennants, to re-enter the trend. These setups provide precise entry points without relying on volume data, which may lag or be less effective over shorter timeframes.
While Price Action is perfect for short-term setups, swing traders often benefit from a different tool.
Using Volume Profile for Swing Trading
For swing traders holding positions over days or weeks, Volume Profile provides a solid framework that remains relevant across multiple sessions. Its key zones, such as the Point of Control (POC) and Value Area, offer consistent reference points for managing trades over extended periods.
The Value Area, which represents around 70% of trading volume, acts as a zone where prices often consolidate or revert. For example, if the POC is at $50 and the price rallies to $55, it’s likely to drift back toward the POC within a few days. This creates a high-probability swing trade setup with clear risk management levels.
Low-volume nodes (LVNs) are particularly useful for swing traders seeking breakout opportunities. These zones, characterized by minimal trading activity, allow prices to move quickly with little resistance. Identifying these areas helps traders anticipate where price acceleration might occur over several days.
Volume Profile also highlights institutional activity – areas where large traders have accumulated or distributed positions. These high-volume nodes often act as strong support or resistance zones that hold across multiple sessions. For instance, if crude oil futures show a POC at $75 per barrel over two weeks and the price dips to $72 (near the bottom of the Value Area), this low-volume zone could signal a buying opportunity. A swing trader might enter a long position, aiming for a price rebound toward the $75 POC, with a stop below the Value Area Low.
Using Both Methods Together
Combining Price Action and Volume Profile can enhance trade precision by aligning short-term signals with broader market structure. This dual approach reduces the risk of false signals and increases confidence in trade setups.
Use Price Action on shorter timeframes (like 5-minute or 15-minute charts) to pinpoint entry signals, while relying on Volume Profile on longer timeframes (hourly or daily charts) to ensure those signals align with key volume levels. This ensures trades are in sync with the larger market context.
For example, if a bullish Price Action pattern appears on a 5-minute chart, check the hourly Volume Profile to see if it aligns with a high-volume node within the Value Area. This combination of short-term timing and structural confirmation provides a stronger foundation for the trade.
Breakout trading also becomes more reliable when using both methods. If Price Action shows a breakout above resistance, Volume Profile can indicate whether that resistance corresponds to a high-volume node (indicating strong resistance) or a low-volume node (suggesting weaker resistance). A breakout through a high-volume node with strong Price Action momentum signals a more sustainable move compared to one through thin volume.
Consider this scenario: For the E-mini Nasdaq (NQ), identify an uptrend on the daily chart using Price Action – clear higher highs and higher lows. Overlay a 4-hour Volume Profile to locate the POC as support at $15,200. When the price pulls back to this level, switch to a 15-minute chart and look for Price Action confirmation, such as a bullish pin bar or a failed breakdown. The combination of a daily trend, 4-hour volume structure, and 15-minute entry signal creates a compelling setup.
This integrated approach also helps avoid false breakouts. If Price Action suggests a breakout but Volume Profile shows it’s happening through a low-volume zone, the move might lack conviction and could reverse quickly. This insight prevents entering trades based solely on patterns without considering market participation.
For traders dealing with highly liquid futures contracts like ES or NQ during regular market hours, both methods work effectively together. However, during low-volume periods – such as overnight sessions, holidays, or when trading less liquid instruments – Price Action becomes more reliable, as Volume Profile data may not generate meaningful insights in these conditions.
Conclusion
Volume Profile and Price Action work hand in hand, offering two distinct yet complementary views of the market. While Volume Profile highlights zones of concentrated trading activity, Price Action focuses on how prices behave and react at those crucial levels.
By combining these approaches, traders can improve both their entry timing and market confirmation. Volume Profile is particularly helpful for swing traders holding positions over several days or weeks, offering reliable reference points like the Point of Control (POC) and Value Area. On the other hand, Price Action is ideal for intraday traders who need quicker signals, such as candlestick patterns and momentum shifts. The real power lies in using them together: Price Action helps set the market context and identify potential setups, while Volume Profile confirms those setups. This integration not only balances out their individual limitations but also strengthens the overall trading strategy.
This combination also enhances risk management. For instance, stops can be placed below High Volume Nodes in long trades or above Low Volume Nodes in short trades. These levels are more logical and meaningful compared to arbitrary price points, reducing the chances of being stopped out unnecessarily while ensuring stops align with areas where the trade idea is no longer valid.
A multi-timeframe approach further amplifies the benefits. Price Action can pinpoint precise timing on shorter charts, like 5-minute or 15-minute intervals, while Volume Profile provides structural confirmation on longer timeframes, such as hourly or daily charts. In strong trending markets, Price Action signals when momentum is breaking through volume-based resistance. In contrast, during range-bound conditions, Volume Profile’s Value Area identifies profitable mean reversion opportunities.
When combined, Volume Profile and Price Action create a solid trading framework. This pairing sharpens trade timing, validates critical levels, and reduces analytical errors, offering a well-rounded approach to navigating the markets effectively.
FAQs
What’s the best way to combine Volume Profile and Price Action for more effective trading?
Combining Volume Profile with Price Action gives traders a deeper understanding of market dynamics, helping them make more informed decisions. While Volume Profile pinpoints key price levels with heavy trading activity, Price Action sheds light on how prices move and behave over time. Together, they provide insights into both the structure of the market and its momentum.
To put this into practice, begin by using Volume Profile to identify areas with high trading activity – these often act as support or resistance zones. Next, examine the Price Action around these levels to spot trends, potential reversals, or breakout scenarios. By aligning these two tools, you can better connect significant market levels with real-time price movements, adding precision to your trading strategy.
What are common mistakes traders make with Volume Profile and Price Action, and how can they avoid them?
Traders sometimes misuse Volume Profile by concentrating only on high-volume areas, ignoring the bigger picture of the market. This narrow focus can lead to poorly timed trade entries or exits. To sidestep this issue, pair Volume Profile with other tools like trend analysis or identifying key support and resistance levels. This broader approach helps create a clearer and more informed trading strategy.
When it comes to Price Action, a frequent error is overanalyzing minor price movements or trying to force patterns that don’t actually exist. This often leads to impulsive decisions that can hurt overall performance. Instead, aim to focus on well-defined trends and trustworthy patterns, steering clear of trades during unpredictable or choppy market conditions.
By thoughtfully combining these strategies and exercising patience, traders can minimize mistakes and make more confident, calculated decisions.
When is it better to use Volume Profile instead of Price Action, and vice versa?
Volume Profile shines in markets where knowing how trading volume is distributed across different price levels can reveal critical support and resistance zones. It’s particularly effective in range-bound or consolidating markets, as it helps traders pinpoint areas of intense activity or potential price reversals.
On the flip side, Price Action is ideal for trending markets or when focusing on short-term market behavior. This approach zeroes in on analyzing candlestick patterns, trendlines, and overall market momentum, allowing traders to make decisions based on recent price movements.
Each strategy offers distinct advantages, and combining them can provide a deeper understanding of market dynamics. For instance, you could use Volume Profile to locate key price zones and then apply Price Action techniques to confirm the best points for entering or exiting trades.