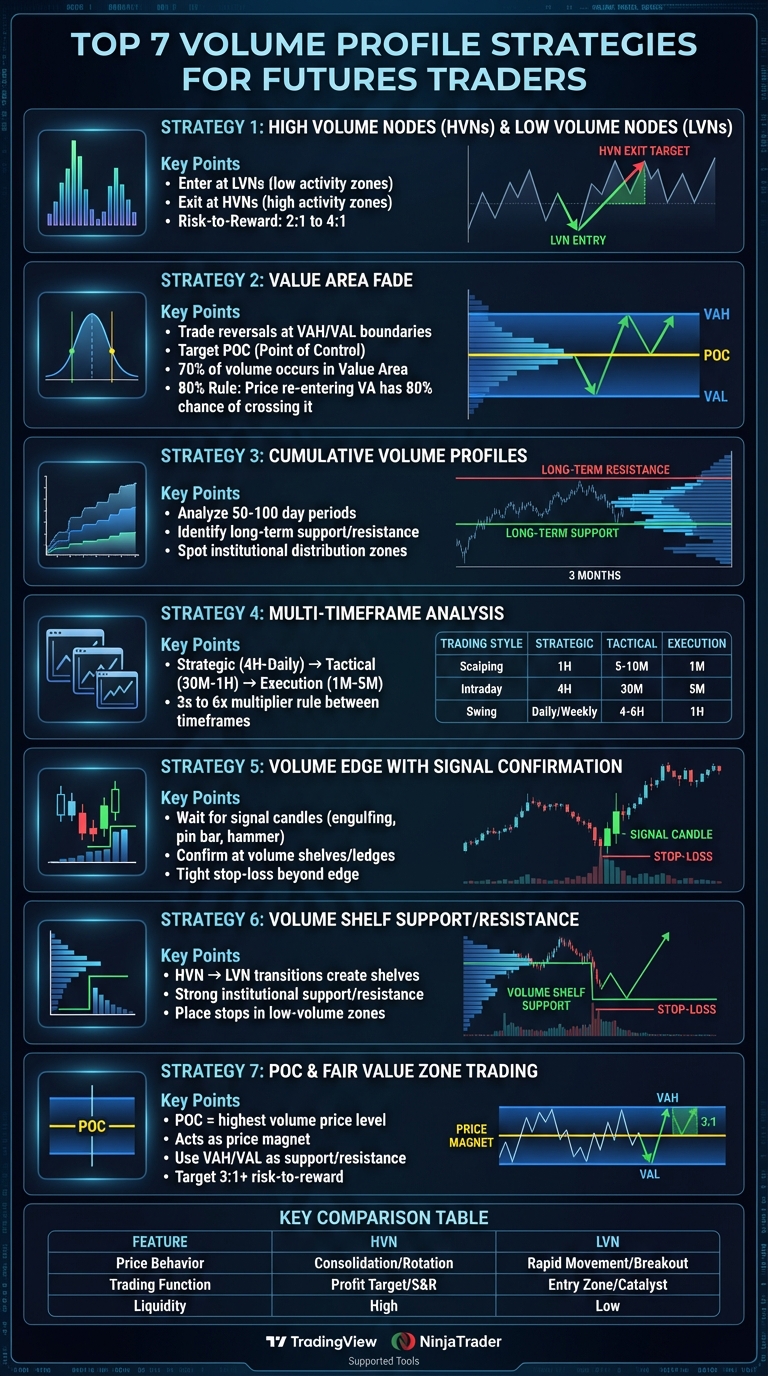
Volume profile trading gives futures traders an edge by showing where the most trading activity happens at specific price levels. This helps identify key areas like support, resistance, and fair value zones. Here’s a quick breakdown of the top strategies covered:
- High Volume Nodes (HVNs) & Low Volume Nodes (LVNs): Trade at LVNs for entries and target HVNs for exits.
- Value Area Fade: Use the Value Area High (VAH) and Low (VAL) as reversal points, targeting the Point of Control (POC).
- Cumulative Volume Profiles: Spot longer-term support and resistance zones for broader market insights.
- Multi-Timeframe Analysis: Combine profiles from different timeframes for precise entries and exits.
- Volume Edges with Signal Confirmation: Use candle patterns at volume shelves for confirmation.
- Volume Shelf Support/Resistance: Trade around sharp transitions between high and low volume areas.
- POC and Fair Value Zone Trading: Focus on the POC as a magnet for price and use the Value Area for targets.
These strategies help improve trade entries, manage risk, and optimize reward potential. Tools like TradingView and NinjaTrader simplify analysis, while the best futures prop firms like Apex Trader Funding offer access to larger trading capital to scale these methods effectively.
7 Volume Profile Trading Strategies for Futures Traders
How to Correctly Trade Futures using Volume Profile
sbb-itb-46ae61d
1. Trading High Volume Nodes and Low Volume Nodes
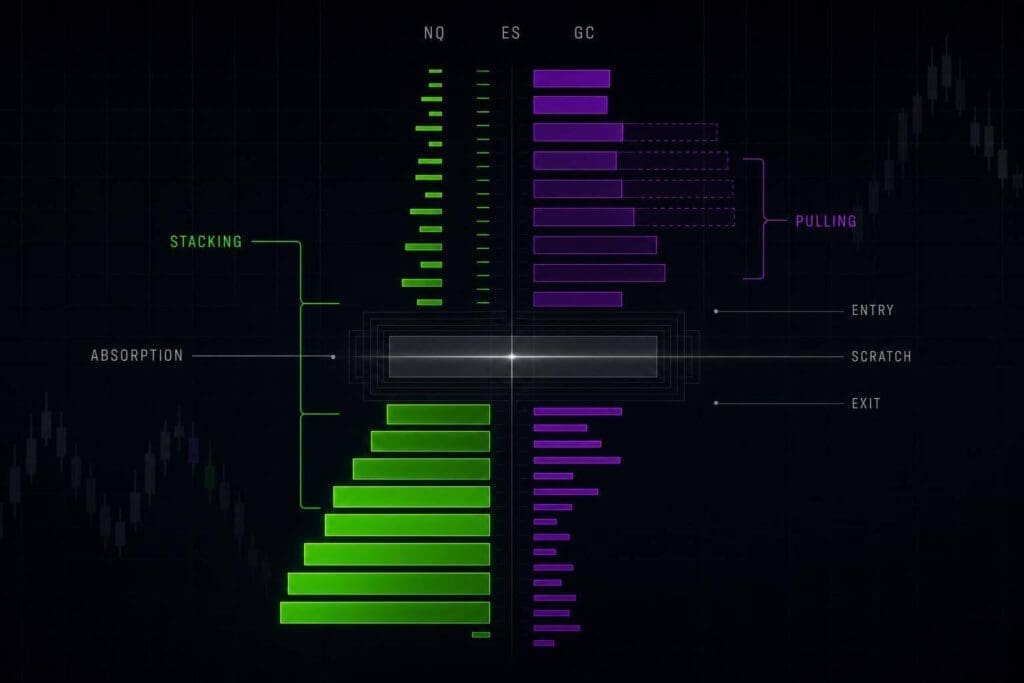
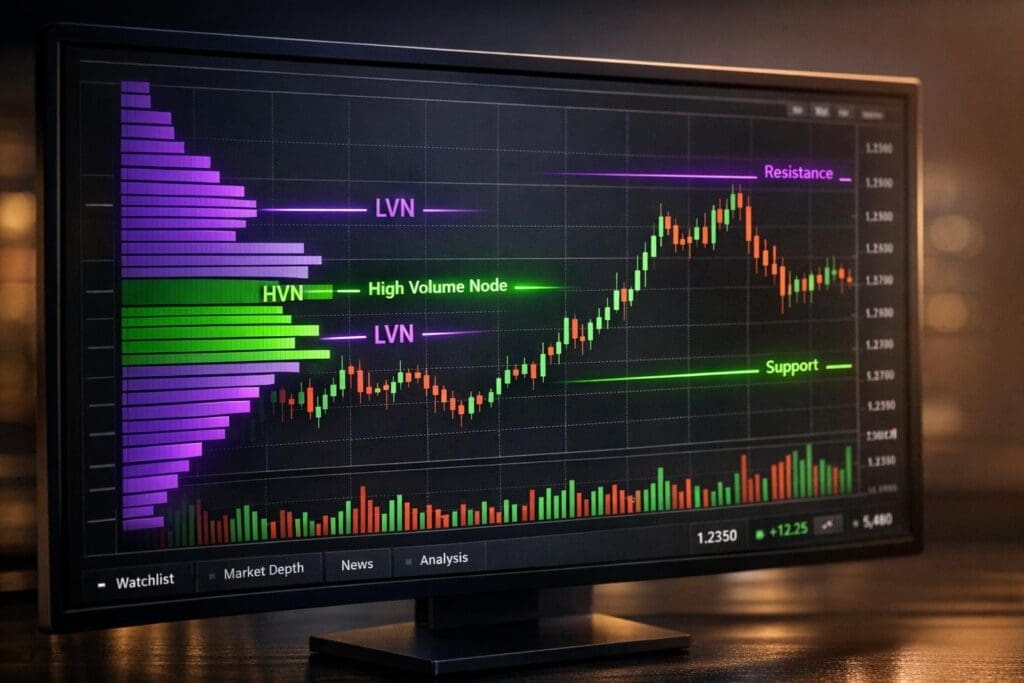
High Volume Nodes (HVNs) and Low Volume Nodes (LVNs) are essential concepts in volume profile vs. price action trading. HVNs show up as prominent peaks in the volume profile histogram, marking price levels where heavy trading has occurred. In contrast, LVNs appear as thin valleys, representing areas with minimal activity. HVNs tend to attract price, while LVNs allow for quicker price movement.
Jean Folger, Co-founder of PowerZone Trading, highlights the practical significance of LVNs:
"Low-volume nodes can provide good trade entry locations since they represent prices that have been skipped over in the past, and trading activity will likely move quickly away." [2]
Practical Application for Futures Trading
The approach is simple: enter trades at LVNs and aim for HVNs as targets.
For example, in May 2024, Gold Futures (GC) consolidated near a high-volume node at $2,350. Following a CPI report, the price rejected the upper value edge. Traders who shorted the retest of the $2,350 HVN targeted the next major volume area at $2,330, achieving a 4-to-1 risk-to-reward ratio [7].
Identifying HVNs and LVNs Across Timeframes
Volume profile tools make it easy to spot HVNs (displayed as long bars) and LVNs (visible as gaps). Start with daily or weekly profiles to identify the overall structure, then shift to shorter timeframes for precise trade entries. This multi-timeframe analysis helps refine risk-to-reward setups and improves clarity.
| Feature | High Volume Node (HVN) | Low Volume Node (LVN) |
|---|---|---|
| Price Behavior | Consolidation / Rotation | Rapid Movement / Breakout |
| Trading Function | Profit Target / Support & Resistance | Entry Zone / Breakout Catalyst |
| Liquidity | High | Low |
Optimizing Risk-to-Reward Ratios
To minimize premature exits, place stop-loss orders just beyond HVNs or within LVNs. By entering trades at LVNs and setting targets at HVNs, traders can capture setups offering 2:1 to 4:1 reward potential. The volume profile provides a clear "path of least resistance", making it easier to structure trades effectively.
Adam from Jumpstart Trading captures the essence of this strategy:
"High volume nodes act like gravity, attracting price, while low-volume zones let it pass." [3]
Up next, discover how multi-timeframe analysis can further enhance these trading strategies.
2. Value Area Fade Strategy
The Value Area (VA) is the price range where approximately 70% of trading volume occurs during a specific time period [5]. It’s defined by two key levels: the Value Area High (VAH) and Value Area Low (VAL). The fade strategy leverages price rejections at these boundaries, aiming to capitalize on price movements back toward the center, known as the Point of Control (POC).
When the price tests the edges of the VA and shows signs of rejection, it often gravitates back toward the POC or the opposite boundary. This setup offers a strong risk-to-reward ratio by entering trades near the extremes and targeting the middle or far edge of the Value Area.
Practical Application for Futures Trading
A great example of this strategy in action occurred in April 2023 with Crude Oil Futures. After OPEC announced production cuts, prices surged to the VAH at $77.00. However, as momentum waned and volume dropped, a trader spotted resistance near the upper limit and entered a short position at $76.80. The price eventually reverted to the POC at $75.30, delivering a textbook mean-reversion trade [6].
The 80% Rule is another key element of this strategy. It suggests that if the price opens outside the previous day’s Value Area but re-enters it, there’s an 80% chance it will move across the entire Value Area to the opposite boundary [4]. Patrick Wieland, a prominent day trader on YouTube, highlights this setup as a reliable framework for identifying trade opportunities [4].
For successful entries, wait for clear reversal signals – like pin bars or engulfing candles – near the VAH or VAL. Place stop-loss orders just outside the Value Area to guard against genuine breakouts. For exits, consider the POC for a conservative target or aim for the opposite VA edge to achieve a risk-to-reward ratio of 2:1 or higher [7].
Simplifying the Strategy with Volume Profile Tools
Volume profile tools make identifying and executing this strategy much easier. These tools display the VAH, VAL, and POC levels on various timeframes, from 5-minute intraday charts to weekly profiles. For short-term trades, the Session Volume Profile (SVP) is particularly effective, while the Fixed Range Volume Profile (FRVP) is better for analyzing specific price movements [8]. The POC, marked as the longest bar on the profile, represents the price level with the highest trading volume and often acts as a magnet for price [1].
A failed breakout offers a prime opportunity for this strategy. As noted in Trading In Depth:
"Failed VA breakouts offer excellent fade opportunities – if price breaks VAH and quickly retracts, short the move."
Adapting to Different Timeframes
One of the strengths of the Value Area Fade strategy is its adaptability across multiple timeframes. Intraday traders can use 5-minute or 15-minute profiles to capture quick price rotations, while swing traders may rely on 4-hour or daily profiles to catch larger moves spanning multiple sessions. For long-term investors, weekly or monthly profiles can reveal institutional value shifts [7]. Since markets spend 70–80% of their time in balanced, range-bound conditions, this strategy thrives in those environments [1]. However, it’s wise to avoid using this approach during high-volatility news events, as prices are more likely to trend rather than rotate [7].
Optimizing Risk and Reward
The Value Area Fade strategy shines in creating setups with strong risk-to-reward potential. By entering near the VA boundaries, traders can use tight stop-loss levels, while aiming for the POC or the opposite boundary offers significant profit targets. As Mastery Trader Academy advises:
"Aim for 2R to 4R setups. Volume Profile helps create asymmetric setups – don’t waste that edge on poor execution." [7]
To maximize profits, consider scaling out at the POC to secure gains while leaving part of the position open for a potential move toward the opposite VA edge. This approach balances consistent win rates with the potential for larger rewards, making the Value Area Fade strategy highly effective for futures trading.
3. Trading with Cumulative Volume Profiles
Cumulative volume profiles compile trading data over extended periods, offering a deeper look at long-term support, resistance, and key distribution zones that single-session profiles might miss [1]. This broader view highlights areas where institutional investors build positions, helping traders spot major distribution zones where the market finds balance, as well as the ledges where prices may break into trending moves.
Markets tend to move between high-volume distribution areas. When the price moves away from a well-defined volume ledge and enters a low-volume zone, it indicates an imbalance that often drives the market toward the next significant distribution [5]. As TRADEPRO Academy explains:
"Volume attracts price, so large areas of volume become ‘balance’ for price." [5]
For instance, in June 2024, traders analyzing S&P 500 E-mini futures observed a notable 100-day cumulative distribution between 5,522 and 5,542. When the price re-entered this balance from below, they noticed heavy negative delta at the 5,522 level. This led them to adopt a long bias, targeting the upper end of the distribution [10]. Such insights are made possible through cumulative profile analysis.
Practical Application for Futures Trading
A top-down approach is often the most effective way to use cumulative profiles. Start with a 50-day or 100-day cumulative profile to identify major distribution zones and the overall market structure, then shift to session profiles to pinpoint entry points [1]. For example, if the price opens outside a major cumulative distribution zone, it often signals a trending day in that direction. On the other hand, if the price opens within the distribution, a range-bound session is more likely.
Another key strategy is to watch for "naked" POCs – previous session POCs that the price has not revisited. These levels act as strong price magnets and can serve as high-probability profit targets [5]. This method also helps distinguish between institutional participants, who drive trends and create ledges, and retail traders, who often get caught in high-volume consolidation areas. By combining multiple timeframes, traders can refine their entry and exit points with greater precision.
Using Volume Profile Tools
Modern trading platforms like TradingView simplify the process with tools like "Visible Range" or "Cumulative" indicators, which plot volume histograms along the price axis [1]. These tools make it easier to identify high-volume shelves and low-volume valleys – key areas where price transitions sharply. For futures trading, it’s best to analyze cumulative profiles using continuous contracts to avoid disruptions caused by quarterly expirations [1].
Adapting to Different Timeframes
Cumulative profiles work well across various trading styles. Intraday traders might use 5-minute charts with session overlays to capture short-term moves, while swing traders rely on 100-day or weekly profiles to identify broader structural levels. Combining views from 8-hour, daily, and weekly profiles can help label long-term support and resistance zones, while shorter timeframes such as 5, 15, or 30 minutes allow for fine-tuning intraday entries [3]. This multi-timeframe approach enhances precision and clarity.
Optimizing Risk-to-Reward Ratios
Cumulative profiles are excellent for crafting setups with favorable risk-to-reward ratios. Traders can place stop-losses just beyond high-volume nodes and use low-volume areas as entry points, targeting the next high-volume zone [3]. To calculate your R-multiple, measure the distance from your entry point at a volume ledge to the next high-volume node or POC. Trailing stops can be adjusted behind emerging POCs, allowing you to secure profits based on real-time volume data instead of arbitrary price levels [3]. This strategy often supports achieving a 2:1 or better risk-to-reward ratio by aligning with the natural flow of market volume.
4. Multi-Timeframe Volume Analysis
Multi-timeframe volume analysis combines volume profiles from various timeframes to create a detailed view of market structure. This approach starts with higher timeframes to identify major "opportunity zones" and distribution ledges, then narrows down to lower timeframes (like 1-minute to 30-minute charts) for pinpointing exact trade entries[3]. A key concept here is the multiplier rule – typically a 3x to 6x ratio between strategic, tactical, and execution charts[11]. For instance, scalpers might use a 1-hour chart for strategy, 5- to 10-minute charts for tactical adjustments, and a 1-minute chart for precise entries. Meanwhile, intraday traders might rely on a 4-hour chart for strategy, a 30-minute chart for tactical moves, and a 5-minute chart for execution[11]. This method bridges strategic planning with sharp execution, complementing earlier volume profile techniques.
Practical Application for Futures Trading
Building on volume profile methods, multi-timeframe analysis sharpens decisions around trade entries and exits. A solid routine often begins by reviewing daily and weekly charts each morning to locate new high-volume nodes and project unrevisited Points of Control (POCs) onto intraday scalping charts[3]. Traders also analyze 8-hour volume profiles to assess overnight activity during Extended Trading Hours, which can hint at the market’s opening direction[3]. This preparation outlines key price levels to watch.
One effective strategy is identifying "Stacked Points of Control" – areas on daily charts where POCs from multiple days align at the same price. These zones often act as strong support or resistance levels[3]. Similarly, "naked" or "virgin" POCs (levels from prior sessions that haven’t been retested) frequently serve as magnets or rejection points[5][9]. Projecting these levels onto lower timeframes provides actionable targets and logical stop-loss placements based on volume data.
Compatibility with Multiple Timeframes
The versatility of multi-timeframe volume analysis allows it to suit different trading styles. Here’s how various traders might structure their timeframes:
| Trading Style | Strategic Timeframe | Tactical Timeframe | Execution Timeframe |
|---|---|---|---|
| Scalping | 1-Hour (H1) | 5-10 Minute (M5-M10) | 1-Minute (M1) |
| Intraday | 4-Hour (H4) | 30-Minute (M30) | 5-Minute (M5) |
| Swing | Daily/Weekly | 4-6 Hour (H4-H6) | 1-Hour (H1) |
Many trading platforms allow profiles from different timeframes to be overlaid, helping traders maintain context without constantly switching screens. This approach ties back to earlier discussions about using volume nodes to optimize risk-to-reward ratios.
Risk-to-Reward Optimization Potential
Using multi-timeframe analysis can significantly enhance risk-to-reward ratios by offering clear entry and exit points. For example, placing stop-loss orders just beyond key high-volume nodes on lower timeframes minimizes risk, while setting take-profit targets at major distribution ledges on higher timeframes provides well-defined goals[11][2]. Imagine a cumulative profile showing a strong high-volume node followed by a clear distribution ledge: entering near the lower node with a tight stop-loss creates a straightforward path to a profit target.
To refine this further, calculate the R-multiple by measuring the distance from entry to the next high-volume area, aiming for at least a 3:1 ratio[3]. Trailing stop-losses behind developing POCs on intraday charts can also help lock in profits, adjusting dynamically based on real-time volume behavior rather than arbitrary price levels[3].
As ATAS puts it:
"A trade confirmed on multiple timeframes statistically carries a higher probability of success, as it accounts for both short-term price dynamics and long-term market sentiment." [11]
5. Volume Edge with Signal Candle Confirmation
Volume edges, also known as shelves, form when a High Volume Node sharply transitions into a Low Volume Node. These areas highlight critical price levels where market activity tends to shift. To trade effectively at these levels, wait for a signal candle – like an engulfing pattern, pin bar, or hammer – to confirm that the price is reacting to the volume edge before entering a position [1][5][12][6].
As Faisal from TRADEPRO Academy explains:
"A ledge is created when a high volume node drops off into an immediate low volume node, creating a volume profile shelf. These ledges are really strong support and resistance levels." [5]
This approach allows traders to pinpoint precise entry points when the market validates these levels.
Practical Application for Topstep futures trading
To put this into practice, first identify a shelf using tools like VPVR or Session Profile. Then, observe price action for a signal candle at the volume edge to confirm market respect [12][6]. For instance, at a Low Volume Node, a strong engulfing candle could indicate a high-momentum breakout. Conversely, at a High Volume Node edge, a candle with a long wick and low follow-through volume often signals rejection [12][6].
Here’s a real-world example: In April 2023, crude oil futures surged to a Value Area High (VAH) of $77.00 following an OPEC production cut announcement. However, traders noticed momentum fading, accompanied by low volume and price rejection at this upper volume edge. A short trade was initiated at $76.80 after the price failed to hold above the VAH, with a stop-loss set at $77.30 – just above the failed breakout level. The target was the Point of Control (POC) at $75.30, where the price eventually stabilized [6].
This example highlights how combining volume analysis with strong risk management can lead to effective trade execution.
Risk-to-Reward Optimization Potential
Trading at volume edges offers the potential for asymmetric setups, as these levels allow for tight, well-defined stop-loss placements. Place stop-loss orders just beyond the ledge or candle wick; if breached, the setup is no longer valid [13][1]. On the profit side, targets are typically set at the next High Volume Node or the opposite end of the Value Area, often yielding risk-to-reward ratios of 2:1 to 4:1 [7].
For even greater precision, some traders use Footprint charts alongside signal candles to confirm internal buying or selling imbalances that align with the candlestick pattern [13][14]. This combination of tools and techniques ensures a structured approach to trading volume edges with confidence.
6. Volume Shelf Support and Resistance
Volume shelves, or ledges, form where a High Volume Node sharply transitions into a Low Volume Node. These areas often create some of the most reliable support and resistance levels for futures prop firm traders. They highlight zones where institutional trading activity is concentrated, providing strong price barriers. High Volume Nodes tend to act like magnets, pulling the price toward them and encouraging consolidation. On the other hand, Low Volume Nodes, with sparse activity, offer minimal resistance, allowing price to move through them more freely and quickly[1].
Identifying Volume Shelves with Modern Tools
Spotting volume shelves has become much easier thanks to advanced volume profile tools. These tools display transitions clearly on cumulative profiles, especially when using continuous contracts. To identify a volume shelf, look for the "belly" of the volume distribution on a cumulative profile – such as a 20-day or 50-day view. The point where horizontal volume bars taper off marks the ledge[1]. This precise visualization helps traders pinpoint key levels, laying the groundwork for well-timed trade entries.
Applying Volume Shelves in Futures Trading
These tools make it simple for traders to identify actionable ledges. A great example comes from May 2022, when Faisal and his team at TRADEPRO Academy analyzed S&P 500 E-mini futures (ES) using a 20-day cumulative profile. They found a distribution ledge around 3,987–3,988, which acted as a support level. The price held at this zone and later rallied to approximately 4,072[5]. To use this approach, traders can set limit orders at the edge of the shelf to catch a bounce back into the high-volume zone. Protective stops can be placed just behind the ledge in the adjacent low-volume area. If the price breaks through the shelf and moves into a low-volume zone, traders can set profit targets at the next high-volume node or shelf.
Effective Across Multiple Timeframes
Volume shelves aren’t limited to a single timeframe – they work across both short-term and long-term charts. This is because institutional trading activity leaves footprints that are visible regardless of the chart interval. For example, a major institutional position at a specific price level will show up on both 5-minute charts and daily charts. Traders can use a 50-day cumulative profile to identify significant structural ledges and then map these levels onto 1-minute or 5-minute charts for precise intraday entries. Many traders also look for "stacked" levels, where volume shelves from different timeframes align, creating zones of high confluence[15].
Optimizing Risk-to-Reward Ratios
Volume shelves offer traders a way to manage risk while maximizing potential profits. By placing stop-loss orders just beyond the ledge in the low-volume zone and targeting the next high-volume node, traders can achieve favorable risk-to-reward ratios, often between 2:1 and 4:1. If the price breaks through the shelf, it signals that the trade setup is no longer valid. Calculating the R-multiple can help ensure a minimum risk-to-reward ratio of 3:1, aligning trades with sound risk management principles.
7. Point of Control and Fair Value Zone Trading
The Point of Control (POC) represents the price level where the highest trading volume occurs during a specific time frame. On a volume profile histogram, it stands out as the longest horizontal bar, signifying what the market perceives as "fair value." Alongside the POC, the Fair Value Zone – also called the Value Area – covers about 70% of the total volume. This zone is bounded by the Value Area High (VAH) and Value Area Low (VAL), highlighting areas where institutional trading activity is concentrated.
Using Volume Profile Tools for Easy Identification
Platforms like TradingView, Sierra Chart, and MotiveWave simplify the process by automatically calculating and displaying these levels. The POC is typically marked with a prominent yellow or red line, while the Value Area appears as a shaded region. These visual aids make it easier for traders to incorporate the POC and Value Area into their strategies.
How Futures Traders Can Use the POC
The POC often acts as a magnet for price movement, reflecting market sentiment. Faisal, Founder of TRADEPRO Academy, notes:
"The POC can act as a magnet for price action and can provide insights into market sentiment" [1].
Instead of treating the POC as an entry point, many traders see it as a profit target since price commonly consolidates around this high-liquidity zone. The edges of the Value Area – VAH and VAL – serve as natural support and resistance levels. For instance, in April 2023, after OPEC announced production cuts, crude oil futures surged toward a VAH of $77.00. As momentum slowed on lower volume, a trader shorted at $76.80, set a stop-loss at $77.30, and aimed for the session’s POC at $75.30. The price eventually pulled back to the POC, resulting in a profitable trade based on these volume-based levels [6]. This example highlights how traders can combine the POC and Value Area levels with volume nodes for precise exit strategies.
Adapting Across Multiple Timeframes
The POC and Value Area levels are not confined to a single timeframe – they work across various chart intervals. Day traders might rely on 5-minute to 30-minute profiles for pinpoint entries but also reference daily or weekly profiles for a broader market perspective. Whether you’re analyzing a 1-minute or a daily chart, the same institutional trading patterns emerge. For instance, a daily POC can reveal the macro trend, while shorter timeframes help refine entry and exit points.
Improving Risk-to-Reward Ratios
The 80% Rule offers a strategic advantage: if the price starts outside the previous day’s Value Area but then moves back into it, there’s an 80% chance it will traverse the entire Value Area to the opposite edge [4]. This setup allows traders to enter on the re-entry with a tight stop just outside the Value Area boundary, targeting either the opposite edge or the POC. By placing stop-losses just beyond the VAH or VAL – areas where price tends to move rapidly through low-volume zones – traders can achieve risk-to-reward ratios of 3:1 or better.
Using Prop Firms to Scale Your Volume Profile Trading
Partnering with prop firms can dramatically increase the potential of your volume profile trading strategies. If you’re trading with limited retail capital, even the most precise setups might result in modest gains. Futures prop firms, however, provide access to accounts ranging from $25,000 to $300,000, with top performers scaling up to accounts worth $4 million to $20 million [16][17]. This access to larger capital allows you to turn your trading edge into meaningful profit opportunities.
Prop firms take on the market risk, while traders typically keep 80% to 100% of the profits [16][18]. Take Apex Trader Funding, for example. Their $300,000 "Full" account enables traders to use up to 35 full contracts (or 350 micros), providing substantial leverage for strategies like volume shelf trading [16]. As of June 2024, Apex has paid out over $200 million to traders, while FundingPips has distributed more than $110 million globally [16].
To make the most of your volume profile trading, you’ll need a robust trading platform. Look for firms offering platforms like NinjaTrader or Quantower, which provide advanced tools for order flow and volume profile analysis. Some firms even allow you to manage up to 20 accounts using trade copying platforms, amplifying the impact of a single high-confidence trade [18][19].
When selecting a prop firm, it’s essential to compare factors like drawdown policies, profit splits, and scaling opportunities. Websites like DamnPropFirms offer verified reviews and comparison tools to help you evaluate options such as Apex Trader Funding, Take Profit Trader, Alpha Futures, and Topstep. Evaluation fees vary, with Apex charging $147 for a $25,000 account and $657 for a $300,000 account [16]. Alpha Futures, on the other hand, offers monthly evaluations starting at $79 for a $50,000 account [19]. Most firms require consistent monthly growth of 5% to 10% to qualify for capital increases ranging from 25% to 100% [17][20]. This means your volume profile trading needs to deliver steady results, not just occasional big wins.
Managing drawdowns is another critical aspect. Many firms enforce daily loss limits of 2% to 3% of your account’s capital [17]. If your strategy involves wider stops or holding trades through the Point of Control (POC), consider firms with End-of-Day trailing drawdowns. These allow trades more time to develop, aligning better with strategies that require patience. Choosing a firm with risk management rules suited to your trading style can help you fully leverage your volume profile edge.
Conclusion
The seven volume profile strategies provide a structured way to uncover institutional positions and pinpoint critical support and resistance zones. Techniques like trading High Volume Nodes and Low Volume Nodes, Value Area fades, cumulative profiles, multi-timeframe analysis, signal candle confirmation, volume shelves, and POC trading help identify areas where the market tends to stabilize. However, success with these strategies hinges on disciplined risk management.
"Risk management is more important than strategy selection." – MetroTrade [21]
Low Volume Nodes can lead to sudden price movements and slippage if stop-losses aren’t properly set [12][6]. Even reliable setups, such as the 80% Rule, can fail during strong trends or unexpected news events [21][22]. To avoid emotional trading decisions, always define your entry points, stop-losses, and profit targets in advance [21]. Pairing volume profiles with additional indicators can also improve accuracy when needed [12].
Once you’ve fine-tuned your volume profile strategies, scaling your trades is the next step. If you’re working with limited personal capital, consider leveraging prop firm funding to expand your trading capacity. Firms like Apex Trader Funding, Topstep, and Alpha Futures offer funded accounts that allow you to apply your strategies on a larger scale. These firms evaluate traders based on precision, making volume profile expertise a valuable asset. Platforms like DamnPropFirms can help you compare firms, find discounts, and access tools like the Consistency Rule Calculator to align your trading approach with firm requirements. This methodical and scalable approach is essential for achieving long-term success.
First, master discipline. Then, scale your capital. This is the foundation for building a sustainable trading career with volume profiles.
FAQs
What are High-Volume Nodes and Low-Volume Nodes, and how do they influence trading decisions?
High-Volume Nodes (HVNs) are key price levels where a large number of contracts have been traded. These areas often serve as support or resistance zones because they reflect strong market interest. Traders rely on HVNs to pinpoint potential entry points, set profit targets, or position stop-loss orders just beyond these levels. Breaking through an HVN typically signals a significant shift in market sentiment.
On the flip side, Low-Volume Nodes (LVNs) highlight price levels with minimal trading activity. These zones are often associated with quick price movements, as there’s little to slow the market down. Traders frequently view LVNs as breakout zones or use them for placing tight stop-loss orders, knowing that the market tends to move swiftly through these areas.
By studying HVNs and LVNs on a futures chart, traders can better predict areas of consolidation or potential breakouts. This insight helps refine entries, exits, and risk management strategies. For those looking to apply these techniques in funded trading, DamnPropFirms provides tools like the Consistency Rule Calculator and a carefully selected list of top proprietary trading firms to help traders grow their accounts and maximize payouts.
Why is the Point of Control important in volume profile trading?
The Point of Control (POC) marks the price level with the highest trading volume during a specific time frame. This price often serves as a critical support or resistance zone, highlighting where the market showed the most interest and activity.
For traders, the POC is a helpful guide for spotting potential price reversals, verifying trends, or fine-tuning entry and exit decisions. Its "magnetic" quality often pulls prices toward it, making it an essential tool for strategies across both short-term and long-term trading horizons.
How can proprietary trading firms support my volume profile trading strategy?
Proprietary trading firms can play a major role in boosting your volume profile trading strategy by giving you access to capital, advanced platforms, and risk management tools. With the added funding, you’re able to trade larger positions and seize more opportunities in the futures market.
Beyond capital, many prop firms provide valuable resources like educational materials, performance tracking, and mentorship programs. These can help you sharpen your skills, especially when it comes to volume profile techniques. For instance, you’ll gain a better understanding of key price levels such as the point of control and value areas, which can lead to smarter entry and exit decisions. With these tools and support at your disposal, you can focus on growing your trading account while keeping your personal financial exposure in check.