Fakeouts in futures trading are price moves beyond key levels like support or resistance that quickly reverse, often caused by institutional players exploiting retail stop-loss orders. These traps can lead to losses for traders who act on breakouts without confirmation.
Here’s what you need to know:
- Institutions manipulate prices through techniques like spoofing and iceberg orders to trigger liquidity pools.
- Fakeouts are common around technical levels (trendlines, round numbers) and during low liquidity periods.
- Key signals to detect fakeouts include delta imbalances, absorption patterns, and volume-price divergences.
How to trade fakeouts effectively:
- Fade the fakeout: Enter a trade opposite to the fakeout after confirmation.
- Trade the retest: Wait for price to revisit the breakout level and confirm rejection before entering.
Risk management is critical – limit exposure to 1%-2% per trade and use stop-losses beyond fakeout extremes. Tools like Bookmap and footprint charts can help spot fakeouts in real-time. Stick to liquid markets and refine strategies through back-testing to reduce losses.
Using Order Flow to avoid Fakeouts
sbb-itb-46ae61d
Why Fakeouts Occur in Futures Markets
Fakeouts are deliberate moves orchestrated by large institutional players to exploit liquidity pools and fill massive orders without causing significant price slippage. Banks, hedge funds, and algorithmic trading desks handle enormous order sizes, making it impossible to execute trades without disrupting the market. To solve this, they target areas where retail traders cluster their stop-loss orders – typically around obvious technical levels.
"Large players – banks, funds, algorithmic desks – cannot fill size without counterparties. Liquidity pools naturally gather at obvious technical levels because retail traders place stop orders there."
For example, when institutions need to establish a large short position, they may push prices above a resistance level, triggering retail buy-stop orders. These orders provide the liquidity needed to fill their positions. Once their trades are complete, they reverse the price direction, leaving retail traders caught in the trap. This sets the stage for the deceptive moves that define fakeouts.
How Institutions Create Fakeouts
Institutional traders deploy several techniques to manipulate price action and exploit retail traders. One common tactic is order book manipulation, often referred to as spoofing. Here’s how it works: large, visible orders are placed to create the illusion of strong support or resistance. Just before the price reaches these levels, the orders are canceled, leaving retail traders exposed.
Another method involves iceberg orders, where large trades are broken into smaller, visible chunks while concealing the majority of the order. This tactic absorbs retail flow at key levels, causing the price to stall or reverse even when volume appears high.
Fakeouts are especially common during periods of low market activity, such as the end of the New York session, the pre-Tokyo open, or mid-day trading lulls. These low-liquidity windows make it easier for institutions to manipulate prices. Additionally, round psychological numbers – like 4,500 on S&P 500 futures – act as magnets for liquidity hunts, drawing in retail orders and setting the stage for reversals.
Why Technical Levels Attract Fakeouts
Technical levels serve as prime targets for fakeouts because they are predictable points where retail traders and best futures prop firms concentrate their orders. Support, resistance, trendlines, and swing highs or lows are commonly used by retail traders, making them attractive for institutional liquidity grabs.
Institutions exploit this predictability by triggering stop-loss clusters at these levels. For instance, a triggered sell-stop order can provide the liquidity needed for institutions to build a long position. Research shows that 35%-40% of breakouts retest the level, and when the retest fails, it often signals a fakeout [9].
Once retail traders are trapped in the false breakout, their panic-driven exits or stop-loss triggers fuel sharp reversals in price.
"By faking a move, they attract retail traders, absorb their flow, and then reverse the price."
- Bookmap [7]
Grasping these dynamics is essential for traders who want to use order flow indicators effectively and avoid falling victim to fakeouts.
Order Flow Indicators for Detecting Fakeouts
Order Flow Signals for Detecting Fakeouts in Futures Trading
Spotting fakeouts often requires looking deeper than just price bars or volume histograms. Order flow indicators can reveal the tug-of-war between aggressive buyers and sellers, helping you identify when a breakout lacks genuine institutional backing. Three key signals to focus on are delta imbalances, order book manipulation, and volume-price divergences. Let’s break these down.
Delta Imbalance and Exhaustion Patterns
Delta tracks the net difference between aggressive buy and sell orders[12]. If delta weakens or turns negative as the price moves above resistance, it’s a warning sign of buyer exhaustion – and potentially a fakeout.
Experienced traders often look for a 3x–4x difference in diagonal volume between the bid and ask at neighboring price levels to confirm a valid imbalance[12]. When three consecutive imbalances occur, it often signals institutional activity at top futures prop firms. However, if a breakout happens without these imbalances – or worse, if they appear in reverse – it could be a trap.
Exhaustion patterns are another red flag. These occur when high trading volume fails to push the price significantly. On a footprint chart, this might show as a large delta confined to a small candle range, where aggressive market orders are absorbed by passive limit orders.
"Footprint charts show you how it got there: who hit the bid, who lifted the offer, where aggression exhausted, and where institutions absorbed pressure."
Cumulative delta is another tool to keep in your arsenal. If the price reaches a new high but cumulative delta stays flat or declines, it’s a sign to avoid long positions. After analyzing delta, turn to the order book for further insights.
Order Book Imbalances and Spoofing
Order book activity adds another layer to delta analysis. Large, temporary orders in the order book often signal spoofing – where traders create the illusion of support or resistance, only to cancel those orders before execution[10]. High-frequency trading desks identify spoofing by watching for orders that appear and vanish repeatedly, layers of orders across multiple price levels, or quotes with unusually short lifespans[10].
A common fakeout tactic involves staged resistance. For example, you might see a cluster of large sell orders just above a resistance level. If these orders disappear before the price reaches them – often visible as a dimming heatmap – it’s a sign of artificial staging[7].
"If the price moves without support from real liquidity, that’s a red flag! … One of the biggest giveaways of a trap is when liquidity suddenly disappears and resting orders vanish just before the price moves."
- Bookmap [7]
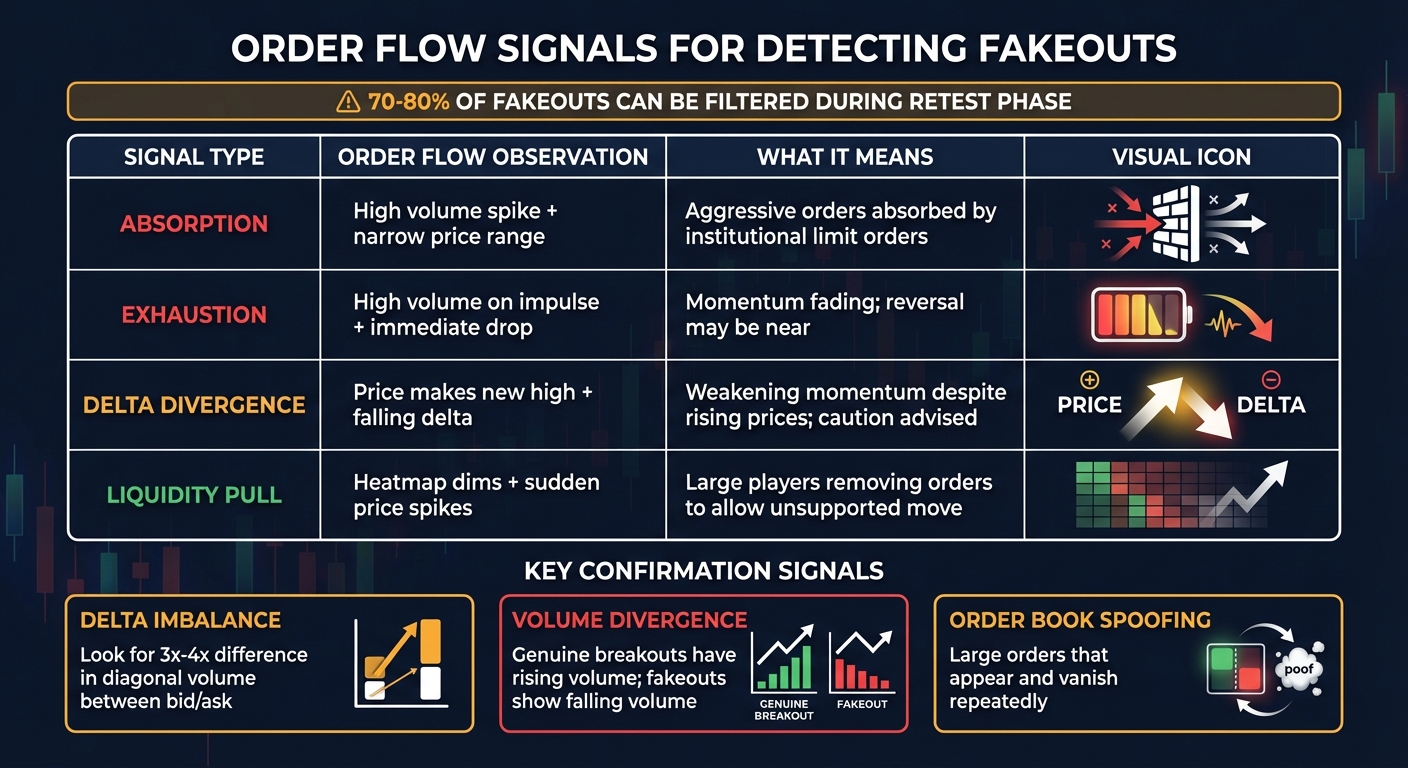
Another telltale sign is absorption at the edge. This happens when aggressive market orders hit a level with high volume, but the price stalls. This suggests a large player is using passive limit orders to trap aggressive traders before reversing the market[11][12]. Since 70% to 80% of fakeouts are filtered out during the retest phase after an initial breakout[6], waiting for a pullback and confirming with additional order flow signals can save you from falling into traps.
It’s also important to compare visible DOM (Depth of Market) imbalances with executed trades. While resting limit orders may hint at intent, aggressive market orders confirm actual participation[11].
Volume Spikes and Price Divergences
Volume spikes without significant price movement are another warning sign. For instance, if over 2,000 contracts trade at a single price level but the price only moves one tick, it suggests aggressive orders are being absorbed by passive limit orders[12].
"A genuine breakout in stocks or futures is usually accompanied by a volume surge. If price pushes above resistance on muted or falling volume, odds of failure rise."
- Ahmed Azzam, Equiti [2]
True breakouts typically come with rising volume. If a breakout occurs on falling volume and is confirmed by two consecutive candle closes, the likelihood of a fakeout increases[2].
A sudden drop in volume after a spike can also signal fading momentum[8]. Additionally, session highs or lows with "thin tails" – areas of minimal volume – often act as magnets. This means the market may revisit these levels to "finish business" before making a decisive move[12].
| Signal Type | Order Flow Observation | What It Means |
|---|---|---|
| Absorption | High volume spike + narrow price range | Aggressive orders are being absorbed by institutional limit orders [12] |
| Exhaustion | High volume on impulse + immediate drop | Momentum is fading; reversal may be near [2][8] |
| Delta Divergence | Price makes new high + falling delta | Momentum is weakening despite rising prices; caution is advised [12] |
| Liquidity Pull | Heatmap dims + sudden price spikes | Large players removing orders to allow an unsupported move [7] |
For risk management, consider using volume-based stops. Placing stop-loss orders just beyond high-volume nodes or absorption zones aligns your strategy with market structure instead of relying on arbitrary tick-based stops[13].
Trading Strategies for Fakeouts
Once order flow signals confirm a fakeout, the next step is to execute a trade that takes advantage of it. Two common methods – fading the fakeout and trading the retest – offer different ways to enter the market, set stop-losses, and define profit targets.
Fading the Fakeout
Fading a fakeout means trading in the opposite direction as soon as the fakeout is confirmed. This is a bold strategy, requiring decisive action. The entry point is simple: wait for the price to move back inside the previous range or drop below the broken resistance (in the case of a failed breakout) or rise above the broken support (for a failed breakdown) [2][6].
"A fakeout is a brief push beyond support, resistance, or a trend line that quickly collapses."
- Ahmed Azzam, Equiti [2]
Stop-loss placement is crucial here. It’s best to position the stop just beyond the extreme point of the fakeout spike [2][8]. This gives the trade enough breathing room to handle normal market fluctuations while avoiding being stopped out prematurely. Avoid using obvious levels like round numbers or previous highs, as these are often targeted by institutional players [4].
When setting profit targets, start by aiming for the middle of the previous range to lock in partial gains and reduce risk. The final target should be the opposite boundary of the range [2]. For example, if ES futures fake out above 4,500 but close at 4,495, you might go short with a stop placed slightly above the high, say at 4,503. Your partial target could be 4,480, and the full exit might be at 4,460.
Experienced traders generally limit their risk to 1% to 2% of their total portfolio equity on any single trade [1][2].
If this approach feels too aggressive, the retest strategy might be a better fit.
Trading the Retest After a Fakeout
The retest strategy is a more cautious option, relying on confirmation from price action. Instead of jumping in right away, wait for the price to revisit the broken level. Enter the trade only when there’s a clear rejection signal, such as a bearish or bullish pin bar, which indicates the level has flipped [2][14]. This method can help filter out 70% to 80% of potential fakeouts [6].
"Wait for price to return, watch how it reacts, and only step in when there’s something solid to work with."
For stop-loss placement, position your stop just above the high of the retest (for short trades) or below the low (for long trades) [2]. This keeps your risk controlled while allowing the trade to develop naturally.
Profit targets can be set using a measured move. Calculate the height of the previous range, then project that distance from the breakout point [2]. For instance, if the range was 20 points and the fakeout happened at 4,500, the target could be 4,480, reflecting a 20-point move in the opposite direction. You can use a futures trading profit calculator to estimate the potential PnL of these moves.
| Strategy Component | Fading the Fakeout | Trading the Retest |
|---|---|---|
| Entry Trigger | Price closes back inside the range [2] | Rejection of the level during a retest [2][14] |
| Stop-Loss Location | Beyond the extreme of the fakeout spike [2][8] | Above/below the retest high/low [2] |
| Primary Target | Opposing range boundary [2] | Measured move based on prior range height [2] |
| Risk Profile | Aggressive; trades against momentum [3] | Conservative; waits for confirmation [14] |
Both strategies benefit from confirmation through order flow signals, such as volume spikes and delta divergences, to ensure strong trade setups. Whether you prefer the aggressive fade or the cautious retest, disciplined risk management and proper position sizing are essential to success.
Building Fakeout Analysis into Your Trading Plan
To make fakeout detection useful, it needs to be part of a well-structured trading system. Without clear rules for managing risk, testing strategies, and selecting markets, even the most reliable order flow signals can lead to inconsistent performance. The aim is to create a process that aligns with your trading style and account size, ensuring every trade follows a consistent, controlled approach.
Risk Management and Position Sizing
Incorporate fakeout detection into your trading plan by limiting your risk to 1%-2% of your total equity per trade [2][1]. This approach protects your account during volatile periods or low-liquidity sessions, reducing the impact of consecutive losses.
For stop-loss placement, follow the principles discussed earlier: set stops beyond the extreme of the fakeout or retest level to account for normal market fluctuations. Avoid placing stops in predictable areas like round numbers or previous session highs, as these spots are often targeted by institutional traders seeking liquidity [8].
Confirmation is key before entering a trade. Keeping a detailed trading journal helps you track performance by instrument and session, allowing you to identify patterns in "trappy" markets. For instance, recording the percentage of failed breakouts can help you filter out 70%-80% of potential fakeouts [6].
| Common Mistake | Risk Management Solution |
|---|---|
| Chasing the first breakout candle | Wait for a retest or second candle close [2][8] |
| Ignoring volume divergence | Trade only when breakouts are supported by volume surges [2] |
| Setting stops too tight | Place stops beyond the fakeout wick/extreme [2] |
| Revenge trading after a failed break | Focus on evidence of a reversal, not frustration [2] |
Back-Testing and Market Selection
Once your risk criteria are set, focus on refining your strategy through back-testing and careful market selection. Stick to highly liquid futures markets and indices like ES, NQ, or CL, as fakeouts are less predictable in illiquid markets where single participants can influence price movements [2]. Use order flow data – such as volume spikes, delta imbalances, and liquidity changes – instead of relying solely on price candles [8][7].
Track breakout failure rates by instrument and session. For example, you might notice that fakeouts are more frequent during the first 10 minutes of the cash open or during lunchtime when liquidity thins out [2][7]. Start with daily charts to identify major support and resistance zones, then switch to lower timeframes (like 1-hour or less) to fine-tune your entries and observe rejection wicks [3].
Distinguish between trending markets (where breakouts are more likely to succeed) and range-bound markets (where fakeouts and mean-reversion are common) [5]. Define in advance the price action that would invalidate your fakeout hypothesis, ensuring your exits are based on logic rather than emotions [5].
Tools and Resources for Traders
Advanced order flow tools can enhance your ability to spot fakeouts. Platforms like Bookmap provide liquidity heatmaps and market order data, helping you identify "iceberg" orders and liquidity shifts that often signal fakeouts [7]. Execution platforms such as NinjaTrader and Sterling Trader Pro are also effective for analyzing Depth of Market (DOM) and real-time order flow changes [8]. Additionally, technical indicators like Bollinger Bands and VWAP can help you spot price ranges and evaluate trend direction [1][7].
For those looking to grow their accounts, resources from DamnPropFirms can guide you in finding funding opportunities while maintaining strict risk controls. They review firms like Apex Trader Funding, Take Profit Trader, and Topstep, offering profit splits as high as 80%-90% [15]. If you need quick access to capital, options like Lucid Trading and Tradeify provide instant funding.
To stay on track with performance requirements, the Consistency Rule Calculator on DamnPropFirms ensures you meet daily loss limits (typically 4%-5%) and maintain consistent payouts [15]. This tool is especially helpful for traders working within the strict parameters of funded accounts.
Conclusion
Fakeouts are deliberate traps set by institutional players. They manipulate prices through key technical levels – like swing highs, VWAP, or round numbers – to trigger retail stop-loss orders and scoop up liquidity[7].
To navigate these scenarios, focus on confirmation, volume analysis, and order book behavior. A genuine breakout often comes with aggressive volume growth and stacked resting orders that reinforce the new price level. In contrast, a fakeout usually shows weak volume, vanishing liquidity, and a quick rejection back to the previous range[7]. Pay attention to order flow signals, such as delta changes and liquidity shifts, to identify fakeouts before committing your capital.
"Asking yourself before entry: ‘What would the market have to do to prove me wrong?’ could be an approach worth trying. This facilitates stops to be placed logically rather than emotionally."
- Mike Smith, Trader [5]
A robust trading plan should include a strict 1%–2% risk limit per trade, require multiple confirmations before entry, and evolve through consistent back-testing across different sessions and instruments[1][15].
For traders looking to scale efficiently and manage risk, platforms like DamnPropFirms offer verified reviews of top firms, including Apex Trader Funding, Take Profit Trader, and Topstep, with profit splits ranging from 80% to 90%[15]. For instant funding options, check out Lucid Trading and Tradeify.
FAQs
How can I spot a fakeout in futures trading using order flow strategies?
Fakeouts in futures trading often reveal themselves when a price move lacks genuine buying or selling pressure. This can be spotted by analyzing order flow indicators, which help determine if the move is backed by real market activity. Fakeouts typically happen when the price briefly breaks a critical level – like a recent high, low, or VWAP – only to reverse quickly due to low volume or weak order flow.
Here’s what to watch for when identifying a fakeout:
- Low volume after the breakout: If the price breaks a key level but volume doesn’t follow, it might indicate a lack of real interest.
- Sudden price or momentum reversal: A quick turnaround often signals that the breakout wasn’t genuine.
- Order flow red flags: Look for signs of large players stepping back or creating traps for retail traders.
Real-time tools that visualize volume and order flow can be invaluable in confirming whether a move is authentic or just an attempt to trigger stop orders and bait breakout traders. Staying patient and closely monitoring these signals can help you steer clear of fakeouts.
How can traders profit from fakeouts in the futures market?
Profiting from fakeouts in the futures market involves spotting false breakouts and using smart strategies to take advantage of market reversals. One effective method is to wait for confirmation after a fakeout. For example, look for signs like price rejection or fading momentum before jumping into a trade. This approach helps minimize the risk of acting on misleading signals.
Another important tactic is analyzing volume patterns and the broader market context. Fakeouts often come with sudden volume spikes that don’t sustain, hinting at a possible reversal. Tools like Bollinger Bands or envelope channels can also help identify overextended price moves that are likely to pull back.
To manage risk effectively, think about setting stop-loss orders near key support or resistance levels. Also, avoid over-leveraging your trades – it’s a quick way to amplify losses. Success in trading fakeouts requires patience, a sharp eye for details, and disciplined decision-making.
Why do large institutional traders create fakeouts in futures markets, and how do they execute them?
Institutional traders often orchestrate fakeouts in futures markets to manipulate liquidity and mislead retail traders. By creating false breakouts at crucial price levels – like support or resistance – they aim to trigger stop-loss orders or trap traders in disadvantageous positions. This strategy allows them to quietly accumulate or unload positions while profiting from the confusion.
Here’s how it works: prices are pushed beyond important levels with what seems like strong momentum. But this initial breakout usually lacks genuine order flow. Shortly after, the price reverses direction, catching retail traders off guard. Spotting these patterns and relying on confirmed order flow can help traders steer clear of such deceptive tactics.