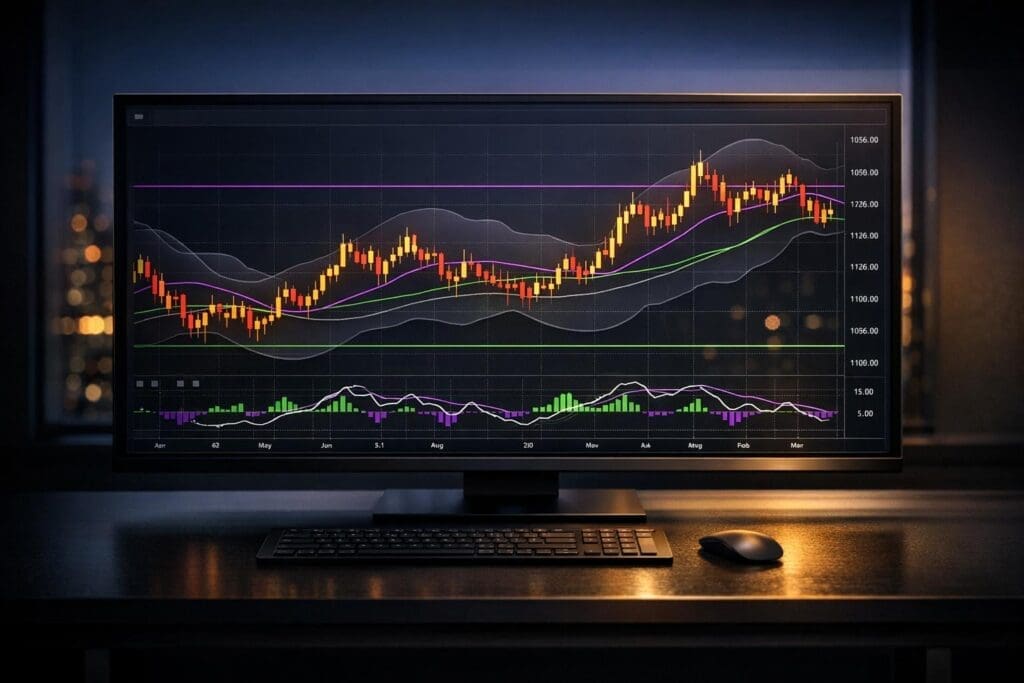
Gold futures trading offers opportunities to profit from price movements without dealing with physical gold. As of April 17, 2026, gold futures are priced at $4,815.91, with a 52-week range of $3,123.30 to $5,626.80. This guide explains how to use technical analysis tools like moving averages, RSI, MACD, and ATR to navigate gold’s price volatility effectively.
Key highlights include:
- Identifying trends: Use moving averages and trendlines to spot market direction.
- Price action: Analyze candlestick patterns and Fair Value Gaps for entries and exits.
- Critical levels: Focus on support, resistance zones, and institutional supply/demand areas.
- Indicators: Combine tools like RSI, MACD, and ATR for better decision-making.
- Risk management: Apply ATR-based stop-losses and manage position sizes during volatility.
- Prop firm strategies: Tailor your trading to meet firm-specific rules, like consistency limits and drawdown thresholds.
Gold’s price volatility, influenced by market sentiment, economic events, and central bank activity, requires a disciplined approach. This guide equips traders with actionable techniques to improve their strategies and align with professional trading standards.
Live Gold (XAUUSD) Trading & Technical Analysis – My Gold Trading Strategy
sbb-itb-46ae61d
Basic Principles of Technical Analysis for Gold Futures
Analyzing gold futures requires a solid grasp of the market’s unique traits. Unlike stocks, gold doesn’t generate dividends or cash flow. Instead, its value is heavily influenced by market sentiment and trading activity. As Metalorix puts it:
"Technical analysis for gold is quite similar [to predicting weather]… looking at the ‘weather’ of the gold market – its price movements".
Price charts act as a window into the psychology of the market.
Gold’s reputation as a safe haven means its price often reacts sharply to geopolitical or economic instability. For instance, during periods of uncertainty, traders flock to gold, driving prices upward. Central banks also play a key role; their large-scale buying or selling can cause sudden spikes in volume and sharp price shifts. Additionally, seasonal demand for jewelry can influence medium-term price trends.
The structure of gold futures trading further shapes its analysis. Unlike the forex market, which operates 24/5, gold futures are traded on centralized exchanges like COMEX, with specific trading hours. This structure is a key consideration for those navigating Apex Trader Funding rules and other evaluation requirements. This setup creates distinct volatility patterns. For example, gold tends to be most active during U.S. trading hours and often experiences overnight gaps of 0.4% to 0.6% following major economic announcements like CPI or FOMC updates. Recognizing these patterns is crucial for identifying reliable trends.
Identifying Market Trends
Spotting trends is a cornerstone of successful gold futures trading. An uptrend is marked by higher highs and higher lows, signaling consistent buying pressure. Conversely, a downtrend shows lower highs and lower lows, reflecting ongoing selling pressure. When prices move sideways in a narrow range, it indicates consolidation.
A common strategy involves analyzing trends across multiple timeframes and using moving averages as filters. For example, traders might use daily or weekly charts to determine the overall market direction, then switch to shorter timeframes (like 1-minute to 15-minute charts) to fine-tune entry points. For long-term trends, the 50-day and 200-day simple moving averages are popular indicators – a crossover between these often hints at a major trend shift. On shorter timeframes, 20-period and 50-period moving averages are frequently used as filters.
Drawing trendlines is another way to clarify market direction. By connecting higher lows in an uptrend or lower highs in a downtrend, traders can visualize the market’s path. A break of these lines, especially when accompanied by increased trading volume, may indicate a trend reversal or exhaustion. To avoid false signals, many traders wait for a retest of the broken level paired with a continuation signal before committing.
Price Action in Gold Futures
Price action analysis focuses on the raw behavior of the market, bypassing lagging indicators. As Krishnanunni H M, a crypto and finance writer, explains:
"Price action shows what buyers and sellers are doing in the moment, allowing traders to anticipate reversals, breakouts, and continuations more effectively when confirmed by volume and context".
Candlestick charts are the go-to tool for reading price action. The candle’s body reveals whether buyers or sellers are in control, while the wicks show areas of price rejection and the intensity of the market’s tug-of-war. A candle with a strong body indicates conviction, while long wicks suggest price levels that were tested but ultimately rejected.
Certain candlestick patterns are particularly useful. Pin bars – candles with long wicks and small bodies near key levels – often signal potential reversals. Inside bars, which stay within the range of the previous candle, typically indicate consolidation and the likelihood of an upcoming breakout. Fair Value Gaps (FVG), formed when price moves so quickly that three consecutive candles don’t have overlapping wicks, highlight imbalances that the market may later revisit.
Because gold is more volatile than many currency pairs, traders often use wider stop-losses to account for market noise. The Average True Range (ATR) indicator is a popular tool for setting stop-loss levels, typically placing them 1.5 to 2 times the ATR away from the entry point. During high-volatility periods, average order slippage can increase losses by about 0.12% per trade. Additionally, bid-ask spreads, normally $1 to $2, can temporarily widen to $15–$20 during major news events.
Critical Levels and Zones in Gold Futures
Understanding where gold futures are likely to pause, reverse, or gain momentum is key for planning trades effectively. These levels aren’t about pinpointing a single price but identifying broader zones where buying or selling pressure tends to concentrate. Gold’s volatility, combined with sharp moves that trigger stop-loss orders, makes relying on precise levels tricky. As Optimus Futures puts it:
"Support and resistance function best as broader zones, not precise prices. Leveraged markets are noisy; treating a level as a single tick often results in premature stop-outs".
These zones help traders define risk, set profit targets, and focus on setups offering at least a 1:2 reward-to-risk ratio.
Support and Resistance Levels
Support and resistance levels highlight where buyers or sellers repeatedly step in, creating natural turning points. Traders identify these zones using tools like historical swing points, Volume Profile High Volume Nodes (HVNs), Fibonacci retracements (notably 38.2%, 50%, and 61.8%), and psychological round numbers, such as $2,000 or $2,300.
For Gold (GC) futures, these zones often span $8 to $12. To capture the full range of activity, traders draw rectangles covering the highest wick and the cluster of candle bodies. To reduce the risk of being stopped out by market noise, stop-losses are usually placed 0.5 to 1.0 ATR (Average True Range) beyond the zone.
Aligning zones across multiple timeframes is also critical. Weekly zones often act as major turning points – referred to as "concrete walls" by FXNX Head of Research Raj Krishnamurthy – while daily zones refine entries and exits within that broader context. The concept of role reversal (or polarity) is key: a broken resistance level can become support on a retest, and vice versa, signaling a potential high-probability setup.
Historical data supports the value of these principles. For example, a 5-year backtest of XAUUSD found that mean reversion trades near the 200-period Simple Moving Average (SMA), confirmed by RSI and ATR indicators, achieved a 71% success rate. The 61.8% Fibonacci level often acts as a pivotal point – holding above it suggests a correction, while breaking below it may indicate trend weakness. Additionally, February tends to see sharp retracements of 10% or more with an 82% frequency when gold becomes overextended.
These principles naturally lead to a deeper exploration of supply and demand dynamics.
Supply and Demand Zones
Supply and demand zones represent areas where institutional order flow clusters around key price levels. These zones are often more influential than those identified by retail traders, as institutions use sophisticated algorithms to create strong barriers.
The best entries often occur not on the initial breakout but when price retests the broken zone, confirming the role reversal. Traders should also look for confluence – situations where multiple factors align. For instance, a horizontal level overlapping with a Fibonacci retracement (such as 61.8%) and a Volume Profile HVN creates a strong setup. Geopolitical events often amplify institutional activity around these zones, strengthening their impact.
Liquidity Clusters and High-Volume Areas
Liquidity clusters highlight areas with concentrated trading activity and institutional order flow. HVNs mark price levels where the market has previously agreed on fair value, creating strong support or resistance. In contrast, Low Volume Nodes (LVNs) represent areas of price rejection, where price tends to move quickly due to limited trading activity.
The Point of Control (POC) – the price level with the highest traded volume – acts as a key magnet for price action. Tools like Volume Profile, Footprint charts, and Depth of Market (DOM) help traders identify these areas and track hidden liquidity, such as "Iceberg Orders" and large institutional trades ("Block Prints").
Institutional activity is often most intense during the first 30 minutes of the U.S. cash session (9:30 AM Eastern), setting the day’s initial liquidity boundaries. A breakout from a high-volume zone is typically validated by a volume expansion of at least 50% above the average. FXNX explains:
"A sharp, high-volume rejection from a zone tells you that a significant imbalance of orders exists there, making it a high-probability area to watch".
To avoid false breakouts, wait for a candle to close decisively beyond the zone with strong volume confirmation. Round numbers like $2,000 or $2,500 often attract significant algorithmic and psychological attention, forming natural liquidity clusters.
Recognizing these liquidity patterns enhances analysis and aligns with professional trading practices at top futures prop firms.
Common Technical Indicators for Gold Futures
When analyzing gold futures, technical indicators play a crucial role in fine-tuning your strategy. They help confirm trends, spot momentum shifts, and complement support and resistance levels. A well-rounded approach often combines a momentum indicator like RSI, a volatility measure such as ATR, and a trend tool like Moving Averages. This blend offers a more complete view of the market than relying on just one metric.
Moving Averages
Moving Averages are great for filtering out price noise and identifying the underlying trend. The Simple Moving Average (SMA) calculates the average price over a specific period, while the Exponential Moving Average (EMA) reacts faster to price changes by giving more weight to recent data.
The 200-day SMA is often considered the gold standard for trend analysis. If gold trades above a rising 200-SMA, it signals a bullish market, favoring long positions. Conversely, trading below a falling 200-SMA suggests bearish conditions, favoring short setups. For swing traders, combining the 21/50 EMA can help capture medium-term trends. Meanwhile, conservative traders might prefer the 50/200 SMA for multi-week outlooks. Aggressive traders operating in volatile markets sometimes use a 5-8-13 EMA setup for quicker entries, though this comes with the risk of more false signals.
Moving Averages also act as dynamic support and resistance. For example, during a strong trend, prices often bounce off the 50 EMA during pullbacks, creating natural entry points. These averages can be applied across different timeframes to confirm trends and identify retracement opportunities.
Once the trend is established, momentum indicators like RSI can provide additional clarity.
Relative Strength Index (RSI)
The RSI is a momentum oscillator that ranges from 0 to 100, helping traders identify overbought or oversold conditions. While traditional thresholds are 70 for overbought and 30 for oversold, gold often benefits from using regime bands (40–60) due to its extended trends.
In an uptrend, an RSI dip to the 40–45 range often signals a pullback entry opportunity. In a downtrend, an RSI rise to 55–60 can indicate a high-probability short entry. Siri Hegde K from Mudrex highlights:
"Gold’s strongest rallies often push RSI into the 70–80 range and remain there for extended periods. Treating this as an automatic reversal signal leads to repeated countertrend losses".
RSI divergence is another key signal. If gold hits a new high but RSI fails to confirm it, this indicates weakening momentum and could signal a potential reversal. The standard RSI setting is 14 periods, though adjustments can be made based on your trading timeframe.
MACD and Momentum Oscillators
Once momentum is identified with RSI, other oscillators like MACD can enhance signal accuracy. The MACD (Moving Average Convergence Divergence) uses two EMAs – commonly 12 and 26 periods – to detect momentum shifts. A bullish crossover happens when the MACD line crosses above the signal line, suggesting a long opportunity, while a bearish crossover indicates a short setup. The MACD histogram further illustrates momentum strength, with expanding bars showing increasing momentum and contracting bars signaling weakening momentum.
The Stochastic Oscillator is another tool that compares the closing price to a price range over a set period (usually 14, 3, 3). Readings above 80 suggest overbought conditions, while readings below 20 indicate oversold levels. While RSI gauges overall trend strength, the Stochastic is better suited for spotting reversals in range-bound markets.
The Average True Range (ATR) focuses on volatility instead of direction, making it vital for risk management. ATR helps set stop-loss levels – typically 1.5x to 2x ATR beyond a key level – to account for gold’s natural price swings. When ATR readings are high, traders should reduce position sizes to maintain consistent risk exposure. This discipline is essential when attempting to pass evaluations for the best futures prop firms.
It’s wise to avoid entering trades just before major economic events, as these can disrupt technical setups. After such events, gold often opens 0.4% to 0.6% away from its previous close, and bid-ask spreads can widen dramatically – from $1–$2 to as much as $15–$20 within seconds.
These tools lay the groundwork for advanced strategies to handle gold’s volatility while staying aligned with professional trading principles.
Advanced Methods for Gold Futures Analysis
Once you’re comfortable using individual indicators, the next challenge is learning how to combine them effectively. The goal isn’t to accumulate more tools but to strategically mix the right ones to cut through market noise and gain a clearer edge.
Multi-Timeframe Analysis
Multi-timeframe analysis offers a "top-down" view that enhances precision. Start with the daily chart to determine the overall trend using the 200-SMA. If gold is trading above a rising 200-SMA, focus on long trades; if it’s below a falling 200-SMA, consider short trades.
From there, move to the 4-hour chart to identify structural changes and clean pullbacks. Here, you might notice a fresh MACD crossover, a bounce off the 21/50 EMA, or a return to a Fair Value Gap. For precise entry points, zoom in further to the 1-hour or 15-minute chart. For example, on March 15, 2024, a bullish divergence appeared on the 4-hour chart when gold hit $1,985, forming a lower low while the MACD made a higher low. This triggered an entry at $1,992 after a MACD crossover, resulting in a profit at $2,022 – a 30-pip gain. Notably, divergences on 4-hour charts have shown an 82% success rate when paired with key support and resistance levels. Additionally, bullish signals on a 1-hour chart carry more weight if the daily MACD is above zero. By layering these timeframes, you can refine your strategy and improve your entry signals.
Combining Indicators for Better Confirmation
After gaining insights from multi-timeframe analysis, you can further refine your approach by integrating diverse indicators. A three-indicator model – blending momentum, volatility, and structural tools – works well, as it avoids redundancy from stacking similar oscillators.
On August 8, 2024, a textbook example of this strategy played out. The daily MACD was above zero, signaling a bullish trend, while the 4-hour chart showed a fresh MACD crossover, and the 1-hour histogram turned positive. An entry at $2,045 generated an average profit of 37.5 pips across scaled positions. As NordFX explains:
"Technical indicators on gold charts work best as confirmation tools rather than standalone signals."
Always align indicator signals with price action. For instance, a Stochastic crossover at a major support level is far more reliable than one occurring on its own. Also, steer clear of technical setups during major economic events like CPI, FOMC, or Non-Farm Payrolls, as the volatility during these times often overrides technical patterns.
Managing Gold’s Price Volatility
A complete technical strategy for gold futures must include advanced volatility management. One effective method is using ATR-based stops. Set your stop-loss 1.5 to 2 times the 14-period ATR away from your entry. This accounts for normal price swings and minimizes the risk of being prematurely stopped out. During periods of high ATR, reduce your position size to maintain consistent risk.
The Opening Range Breakout (ORB) strategy also works well for gold’s volatility. This approach defines risk within the first 15 to 30 minutes of the trading session. The 15-minute ORB typically has a win rate between 52% and 58%, while the 30-minute version offers a slightly higher win rate of 55% to 62%, though it requires wider stops. To further manage risk, place stops at the midpoint of the opening range.
During high-volatility sessions, bid-ask spreads can widen dramatically – from $1–$2 to $15–$20 in seconds – and order slippage may add about 0.12% to your losses. Additionally, gold often opens 0.4% to 0.6% away from its previous close after major economic events. To safeguard your capital, consider using a time-stop rule: exit the trade if the price remains stagnant for several bars after entry, rather than keeping your capital tied up in a low-probability trade.
For the best results, focus on trading during the London (8:00–17:00 GMT) and New York (13:00–22:00 GMT) sessions. These periods offer the highest liquidity, making technical signals more reliable. These volatility management techniques align well with the requirements of proprietary trading firms, helping you apply technical analysis within structured trading rules. For those looking to start, using an Apex Trader Funding discount can lower the barrier to entry for evaluation accounts.
Using Technical Analysis with Prop Firm Rules
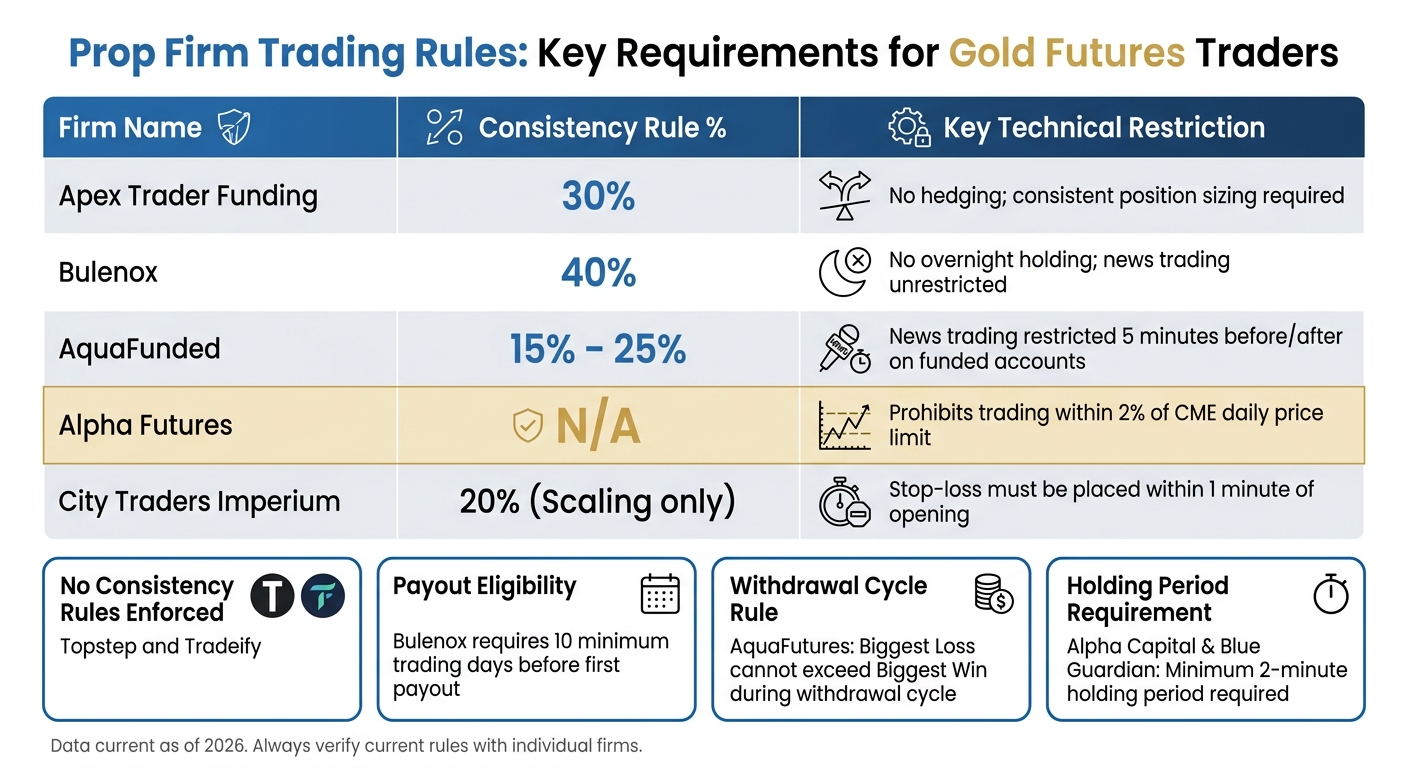
Prop Firm Trading Rules Comparison for Gold Futures Traders
Integrating technical analysis with prop firm rules requires a disciplined approach to trading. When trading gold futures with prop firm capital, you’re not just managing market risk – you also need to navigate firm-specific rules that can influence your payout eligibility. The goal is to align your technical strategies with these rules to maintain profitability while staying compliant.
Meeting Consistency Rules and Maximizing Payouts
Consistency rules are a key requirement for many futures prop firms. These rules limit the percentage of total profit that can come from a single trading day, typically ranging from 15% to 40%. The idea is to encourage steady, repeatable performance rather than relying on a single big trade.
For example:
- Apex Trader Funding enforces a 30% consistency rule, meaning no single day can account for more than 30% of your total profit when requesting a withdrawal.
- Bulenox has a 40% threshold for Master accounts and requires a minimum of 10 trading days before the first payout.
- AquaFunded applies a range of 15% to 25%, depending on the program.
- Other firms, like Topstep and Tradeify, don’t enforce consistency rules.
To stay within these limits, tailor your setups carefully. Use support and resistance levels to set profit targets that align with the firm’s thresholds. For example, if a trade is about to exceed the daily profit cap, consider closing part of your position or adjusting your stop-loss to lock in gains while staying compliant. Tools like DamnPropFirms‘ Consistency Rule Calculator can help you track your daily profit percentages in real time.
Maintaining consistent position sizing is equally important. Firms like Apex require trades to have uniform position sizes. Avoid making drastic changes – stick to a fixed percentage of your account per trade. For instance, if you risk 1% per trade using an ATR-based stop, ensure this risk remains consistent across all setups.
Some firms impose additional restrictions. Alpha Futures and AquaFutures, for example, prohibit trading within 2% of the CME daily price limit for gold futures (GC). If gold approaches the limit-up or limit-down threshold, exit your position to avoid account violations. Additionally, firms like Alpha Capital and Blue Guardian require trades to remain open for at least two minutes to prevent "tick scalping". If you’re trading on lower timeframes, ensure your strategy accommodates this holding period.
AquaFutures also has a "Biggest Loss vs. Biggest Win" rule, where your largest loss cannot exceed your largest win during a withdrawal cycle. To meet this requirement, use tighter stop-losses and aim for a reward-to-risk ratio of at least 1.5:1 or 2:1 for every trade.
| Firm | Consistency Rule % | Key Technical Restriction |
|---|---|---|
| Apex Trader Funding | 30% | No hedging; consistent position sizing required |
| Bulenox | 40% | No overnight holding; news trading unrestricted |
| AquaFunded | 15% – 25% | News trading restricted 5 minutes before/after on funded accounts |
| Alpha Futures | N/A | Prohibits trading within 2% of CME daily price limit |
| City Traders Imperium | 20% (Scaling only) | Stop-loss must be placed within 1 minute of opening |
By aligning your technical setups with these rules, you’ll increase the likelihood of meeting payout requirements while avoiding unnecessary penalties.
Technical Analysis for Instant Funding Accounts
Instant funding accounts, offered by firms like AquaFunded and Blue Guardian, provide access to capital without an evaluation phase. However, consistency rules often apply from the start. This requires a measured technical approach that prioritizes steady, incremental gains over aggressive trades.
Start by using a daily chart to identify the overall trend. Then, switch to the 4-hour chart to find pullbacks to key moving averages or significant support levels. Finally, confirm entries on shorter timeframes – such as the 1-hour or 15-minute charts – when multiple indicators align. For instance, look for a MACD crossover at a major support level while the RSI exits oversold territory. This multi-layered approach minimizes impulsive trades that could breach consistency rules or hit drawdown limits.
Many instant funding accounts feature trailing intraday drawdowns, where your maximum loss limit adjusts based on your highest equity point for the day. Apex Trader Funding follows this model. To manage this, consider using ATR-based stops (1.5–2× ATR) and reduce position sizes during periods of high volatility.
Firms may also require a "safety net" – a small buffer above your drawdown limit – before processing payouts. Until this buffer is achieved, focus on capital preservation. Opt for setups with tight stops and clear invalidation points rather than pursuing aggressive profit targets.
Finally, avoid trading gold during major economic events such as CPI, FOMC, or Non-Farm Payrolls. These events can disrupt technical setups and lead to large gaps or slippage. For instance, during such events, bid-ask spreads can widen from $1–$2 to $15–$20 in seconds, and gold futures may gap 0.4% to 0.6% away from the previous close. Instead, trade during the London (8:00–17:00 GMT) and New York (13:00–22:00 GMT) sessions, where liquidity is higher and technical signals are more reliable.
Conclusion
Trading gold futures using technical analysis isn’t just about memorizing a set of indicators. It’s about creating a solid framework that integrates three key elements: momentum tools (like RSI or Stochastic), volatility measures (such as ATR), and structural anchors (like support/resistance levels or Fair Value Gaps). Successful traders don’t rely on these tools in isolation – they use them to confirm market structure and trends, ensuring their decisions are well-grounded.
Once you’ve built this framework, disciplined execution across different timeframes becomes crucial. Start with the daily or 4-hour chart to establish your broader market bias. Then, zoom into the 15-minute or 30-minute charts for pinpointing entry opportunities. To handle market volatility effectively, consider using ATR-based stop-loss levels. Also, steer clear of initiating trades during high-impact news events, as these can introduce unpredictable price swings.
If you’re trading with prop firm capital, sticking to a disciplined strategy is even more important. Approaches like the Opening Range Breakout (ORB) can be particularly useful during evaluations, as they provide clear rules and controlled risk to help minimize drawdowns. Tools like the DamnPropFirms Consistency Rule Calculator can help you monitor your daily profit percentages in real time. This ensures compliance with the consistency requirements of firms such as Apex Trader Funding and Alpha Futures.
FAQs
Which chart timeframe works best for trading gold futures?
When trading gold futures, the best chart timeframe depends largely on your trading strategy. Swing traders typically rely on the daily chart to spot overarching trends, while the 4-hour chart is useful for identifying pullbacks and potential entry signals. On the other hand, intraday traders often focus on shorter timeframes, such as the 15-minute or 1-hour charts, to make quicker decisions.
A popular tactic among seasoned traders is to combine multiple timeframes. This approach allows them to align the broader market trends with more precise entry and exit points, enhancing their overall strategy.
How do I set an ATR-based stop-loss and position size for GC?
To set an ATR-based stop-loss for gold futures, start by calculating the Average True Range (ATR). This metric helps you gauge market volatility. Once you have the ATR value, multiply it by a factor – typically between 1.5 and 3. The result gives you the distance for your stop-loss.
Next, adjust the stop-loss placement depending on the trade direction. For a long trade, place it below the entry price by the calculated distance. For a short trade, position it above the entry price by the same measure.
When determining position size, divide the amount you’re willing to risk on the trade (e.g., 2% of your account) by the dollar value of your stop-loss. This ensures your risk aligns with the current market’s volatility.
What should I avoid when trading gold futures around CPI or FOMC?
Avoid jumping into trades during the initial volatility sparked by CPI or FOMC events. These sharp price movements can create misleading signals or result in whipsaws. Over-leveraging during this time is especially dangerous, as markets often reverse direction after fully processing the news. A smarter approach is to wait for trends to stabilize and confirm. Also, keep in mind the inverse relationship between gold and the US Dollar Index – this can provide valuable context. Staying patient and managing leverage wisely are critical to sidestepping unnecessary losses in these scenarios.