Chart patterns are the bread and butter for futures traders looking to avoid noise and spot high-probability setups. Whether you’re trading volatile contracts like Nasdaq-100 (NQ) or Crude Oil (CL), knowing patterns like Head and Shoulders, Double Bottoms, and Bull Flags can be the difference between a winning trade and a blown account. Backtesting from 2026 shows these setups have success rates as high as 89% – but only when paired with volume confirmation. This guide breaks down how to trade these patterns step-by-step, avoid common mistakes, and use them effectively during prop firm challenges like Topstep or Apex. Let’s get into it.
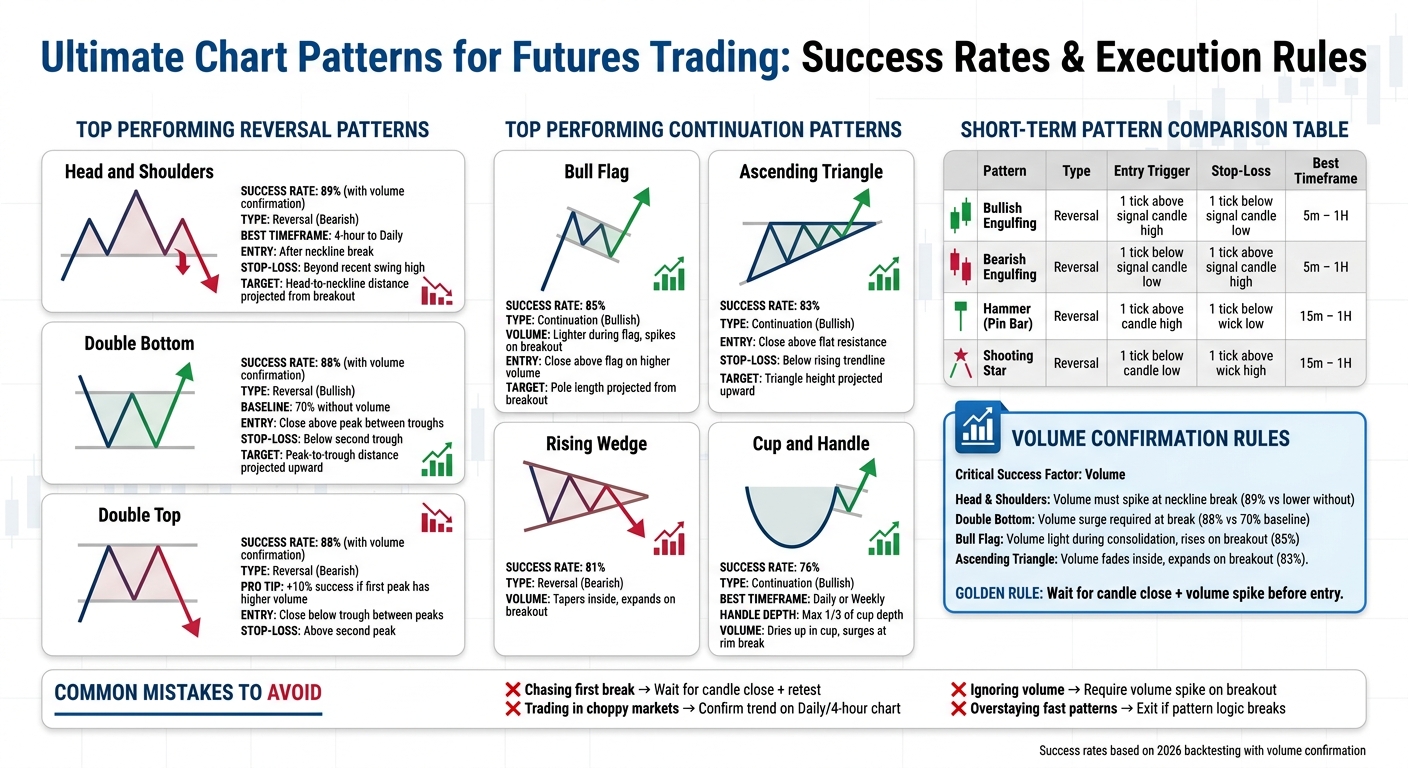
Chart Pattern Success Rates and Trading Rules for Futures Traders
How to Read Candlestick Patterns with Order Flow | Bruce Pringle
sbb-itb-46ae61d
Reversal Patterns: Identifying Trend Changes
Reversal patterns signal when a trend is losing steam and the market could be shifting direction [2]. These setups – Head and Shoulders, Double Tops, Triple Bottoms, and V-reversals – reflect shifts in market sentiment. But spotting the shape alone isn’t enough. You need to wait for confirmation and understand the chart context to trade them effectively. Let’s break them down so you can execute with precision.
Reversals with higher odds tend to form at key spots like prior support or resistance levels, major moving averages (like the 200-period EMA), or established trendlines [1]. For example, a Double Bottom randomly appearing mid-chart is likely just noise. But the same pattern at a well-tested daily support zone, backed by volume, could be a solid trade setup [2].
Volume is your confirmation tool. A valid reversal needs a noticeable volume spike during the breakout – when the price closes decisively beyond the neckline or boundary [2]. Without that surge, you’re probably looking at a bull or bear trap.
Patience is key. Don’t jump in early. Wait for a full candle close beyond the pattern’s boundary, and consider entering on a retest of the broken neckline [2]. This discipline is especially important if you’re in a prop firm evaluation, where false signals can push you into drawdown trouble. Choosing the best futures prop firms with fair rules can help mitigate these risks.
For all reversal patterns, the approach is consistent: enter after a confirmed breakout, set your stop-loss just beyond the last swing, and use the pattern’s height to calculate your profit target [2]. Adding momentum indicators like RSI can help confirm direction – RSI holding above 50 on a bullish breakout strengthens the setup [2].
Here’s a closer look at key reversal patterns, complete with entry rules, stop-loss placement, and profit target strategies.
Head and Shoulders
The Head and Shoulders pattern is one of the most reliable reversal setups, with an 89% success rate on 4-hour to daily charts when volume confirms it [2]. It forms after an uptrend: a left shoulder (a rally followed by a pullback), a higher head (a peak), and a right shoulder (a smaller rally), with the neckline connecting the two troughs. A close below the neckline on strong volume signals a bearish reversal [2].
The Inverse Head and Shoulders flips this structure for a bullish setup after a downtrend, with about a 75% success rate [3]. Here, the left shoulder forms on a decline and bounce, followed by a lower low (the head) and a higher low (the right shoulder). A close above the neckline with strong volume confirms the reversal.
How to trade it: Enter after the neckline break. Place your stop-loss just beyond the recent swing high (bearish) or low (bullish). Calculate your profit target by measuring the distance from the head to the neckline, then projecting that from the breakout point [2]. This measured move keeps your risk-to-reward ratio on track, especially if you’re trading ES futures in a prop firm evaluation.
Common mistakes: Jumping in before the neckline closes or ignoring volume. A mere “touch” of the neckline isn’t enough. Waiting for a throwback – a retest of the broken neckline – can confirm the move [2].
Double Tops and Double Bottoms
These patterns mark a battle where one side fails to break a level twice, leading to a shift in control [4]. A Double Top forms after an uptrend: price hits a peak, pulls back, then retests the same level and fails. It confirms when the price closes below the trough between the two peaks, with an 88% success rate when volume backs the move [2].
Double Bottoms are the reverse. After a downtrend, the price bottoms out, bounces, then retests the same level. A close above the peak between the two troughs signals a bullish reversal. Backtests show a 70% baseline success rate, which jumps to 88% with volume confirmation [2][3].
Pro tip: For Double Tops, if the first peak sees higher volume than the second, the pattern’s success rate can increase by up to 10% [3]. This divergence signals fading buying pressure as sellers take over. Similarly, rising volume on the second trough of a Double Bottom indicates institutional buying [2].
How to trade it: Enter on the breakout. Place your stop-loss just beyond the second peak (Double Top) or below the second trough (Double Bottom). Use the measured move method: calculate the distance from the peak to the trough and project it from the breakout point [2]. This approach works well in volatile NQ futures sessions.
Triple Tops and Triple Bottoms
Triple Tops and Triple Bottoms take the Double pattern concept further, showing even stronger rejection when the market fails at a level three times [2]. These patterns often signal major trend exhaustion, with success rates around 70% for Triple Tops and 72% for Triple Bottoms [3].
A Triple Top confirms when the price closes below the lowest trough of the three peaks, while a Triple Bottom confirms with a close above the highest peak between three support tests [2]. The repeated failures highlight a significant sentiment shift, often leading to sharp, sustained moves.
How to trade it: Entry, stop-loss, and profit target rules mirror those of Double patterns. The difference? Triple patterns give you more time to prepare your trade and confirm the setup using tools like RSI or MACD [2].
V Tops and V Bottoms
V Tops and V Bottoms – also called “spike” reversals – are quick, dramatic turns without the consolidation seen in other patterns [5]. You’ll often find these in volatile futures markets like Crude Oil (CL) or Nasdaq-100 (NQ), where aggressive rejections create sharp V-shaped moves [1].
A V Top forms when the price spikes up, meets resistance, and reverses sharply, often marked by a Pin Bar or Shooting Star pattern [1]. For example, in a 2026 Crude Oil case, a Shooting Star at resistance showed buyers being overwhelmed by sellers, offering a precise short entry [1].
V Bottoms are similar but bullish. The price drops sharply, hits support, and reverses just as fast, often with a Bullish Engulfing pattern signaling the turn. In one E-mini S&P 500 (ES) case, price hit a major support, then reversed with a strong Bullish Engulfing candle on heavy volume. Traders entered above the high of the engulfing candle, with a stop below its low [1].
How to trade it: Use the reversal candle (e.g., Pin Bar or Bullish Engulfing) on high volume as your entry signal [1]. Place your stop-loss just beyond the wick of this candle. Since there’s no clear “pattern height” to measure, set profit targets at the next major support or resistance level [1].
These patterns demand clear trends and volume confirmation. They’re not for choppy markets. If you’re in a prop firm evaluation, don’t force trades where the setup isn’t clean [2].
Continuation Patterns: Trading with the Trend
Continuation patterns show when a trend pauses before resuming. Unlike reversals, these setups suggest the market is consolidating briefly before continuing in the same direction. For futures traders, they offer solid entry points with clear risk levels.
These patterns often form during an established trend, signaling short pauses like triangles, flags, pennants, or the cup-and-handle. The best setups usually happen at key levels, like a 200-period EMA or a former resistance zone that’s now support [1].
Patience matters here. Don’t jump the gun – wait for a full candle close outside the pattern and consider entering on a retest of the breakout level. Momentum indicators like RSI can help confirm the move (RSI over 50 for bullish breakouts). If you’re trading volatile contracts like NQ or CL, watch for volume spikes near institutional levels like overnight highs or lows to validate the breakout.
Here’s a breakdown of continuation patterns and how to trade them.
Triangles
Triangles come in three types: Ascending, Descending, and Symmetrical. Each reflects different dynamics between buyers and sellers.
- Ascending Triangles:
These are bullish. The price forms a flat upper resistance line (where sellers hold the line) and a rising lower support line (buyers stepping up with higher lows). The pattern confirms when price closes above resistance on strong volume, with an 83% success rate [2]. - Descending Triangles:
This is the bearish version. A flat lower support line meets a falling upper resistance line (lower highs), showing sellers are in control. A breakout happens when price closes below support. - Symmetrical Triangles:
These are neutral until the breakout. They feature converging trendlines of lower highs and higher lows. With a 72% success rate, confirmation is key before entering.
Trading triangles:
- Enter after a candle closes outside the triangle.
- For ascending triangles, place your stop-loss below the rising trendline. For descending ones, set it above the falling trendline.
- The profit target is the height of the triangle projected from the breakout point.
| Pattern | Trend Bias | Entry Trigger | Stop-Loss Location | Profit Target |
|---|---|---|---|---|
| Ascending Triangle | Bullish | Close above flat resistance | Below rising trendline | Triangle height projected upward |
| Descending Triangle | Bearish | Close below flat support | Above falling trendline | Triangle height projected downward |
| Symmetrical Triangle | Neutral | Close outside the pattern | Opposite side of triangle | Triangle height projected from breakout |
Next, let’s cover flags and pennants, which also signal trend continuation with clear entry setups.
Flags and Pennants
Flags and pennants show up after sharp moves that create a "pole."
- Bull Flags:
In an uptrend, after a strong rally (the pole), price consolidates into a tight, downward-sloping channel (the flag), often retracing 38–50% of the pole on lighter volume. Enter when price closes above the flag on higher volume. These patterns have an 85% success rate [2]. - Bear Flags:
The bearish counterpart. After a steep drop, price consolidates in an upward-sloping channel before breaking lower to continue the downtrend. - Pennants:
Instead of forming a channel, pennants are small symmetrical triangles that resolve faster – usually within 5–15 candles on intraday charts. These are great for volatile markets.
Trading flags and pennants:
- Enter once price closes outside the pattern boundaries.
- Place your stop-loss on the opposite side of the trendline.
- Set your profit target by projecting the pole’s length from the breakout point (e.g., if the ES pole measures 50 points, aim for a 50-point move).
A tip: Use RSI to confirm the breakout (above 50 for bullish, below 50 for bearish). This is especially helpful during tough evaluations like those at Topstep or Apex.
Cup and Handle
The Cup and Handle is a bullish continuation pattern seen on longer timeframes like Daily or Weekly charts. It shows institutional buyers gradually building positions during the "cup" phase, followed by a brief "handle" that shakes out weaker traders.
This pattern features a rounded "cup" where buyers step in at higher lows, followed by a short "handle" that retraces no more than one-third of the cup’s depth. A deeper pullback could signal lingering selling pressure.
Confirmation comes when price closes above the "rim" (the cup’s high) on strong volume. The breakout triggers a measured move – the depth of the cup projected upward from the rim sets the profit target. With a 76% success rate [2], this is a strong setup for swing traders or those holding funded accounts. If you manage multiple accounts, using a trade copier can help execute these patterns simultaneously.
Trading the Cup and Handle:
- Enter when price closes above the rim.
- Place your stop-loss below the handle’s low.
- Keep the handle shallow; if it retraces more than one-third of the cup’s depth, the pattern becomes unreliable.
As with other patterns, wait for a full candle close and proper volume to confirm the breakout. Don’t jump in during the cup formation – the pattern is only valid once the handle completes and breaks. Patience pays off, as this is a slower-developing setup, not a quick day trade.
Short-Term Patterns for Day and Swing Traders
If you’re a day trader or swing trader, you’re all about patterns that show up fast and resolve just as quickly. Unlike the multi-day setups we’ve talked about before, these short-term patterns pop up on 5-minute to 1-hour charts and give you actionable signals within a single session. The trick? Always confirm them with the trends on higher timeframes.
The golden rule here is confirmation. Don’t jump in just because you spot a hammer or an engulfing candle. Wait for that candle to close, check if the volume spikes, and make sure the pattern shows up at a meaningful level – like previous support, resistance, or a moving average. In markets with high leverage, chasing false signals can cost you big.
Let’s break down some of these quick setups, starting with inside and outside bars.
Inside and Outside Bars
Inside and outside bars reveal the tug-of-war between buyers and sellers during the day [1]. An inside bar forms when a candle’s entire range fits inside the range of the previous candle. It shows indecision or consolidation. On its own, it’s not a strong signal, but near a key level, it can hint at a breakout. A Doji, where the open and close prices are nearly identical, sends a similar "wait and see" message.
On the other hand, an outside bar happens when the current candle’s range completely engulfs the previous one. This is a more decisive move, signaling a shift in control – similar to an engulfing pattern where the new candle overtakes the previous one entirely.
Engulfing Patterns
Engulfing patterns are a reliable two-candle reversal setup [1]. With a bullish engulfing pattern, you’ll see a small bearish candle followed by a larger bullish one that opens lower but closes above the first candle’s open, swallowing it whole. The reverse happens with a bearish engulfing pattern: a small bullish candle gets overtaken by a larger bearish one that opens higher but closes below the prior open.
Volume is the secret sauce here. A volume spike with an engulfing pattern often means big players – institutions – are stepping in [1]. Take January 2026, for example: ES futures formed a textbook bullish engulfing pattern as prices retraced to a major daily support level. A small bearish candle was followed by a strong bullish one that opened lower but closed above the previous open on heavy volume. That’s the kind of high-probability entry you want [1].
"The Engulfing Pattern (especially when supported by high volume) is often considered the most reliable." [1]
When trading engulfing patterns, a common approach is to place your entry 1 tick above the high of the bullish engulfing candle (or 1 tick below the low for bearish). Your stop-loss? Just 1 tick beyond the extreme wick of the signal candle [1]. This keeps your risk tight while giving the trade room to breathe.
Key Reversals
Key reversals, also called pin bars, are single-candle patterns that scream price rejection. A Hammer (bullish) forms when the price dives during the candle but rallies back to close near the high, leaving a long lower wick. A Shooting Star (bearish) is its opposite – price spikes up but gets smacked down, closing near the low with a long upper wick. The longer the wick, the stronger the rejection [1].
These patterns are great for catching the start of a trend change, giving you a solid risk-to-reward setup. For example, if a hammer forms at key support on a 15-minute chart, and it aligns with bullish structure on a higher timeframe, that’s a high-probability entry. You’d place your stop 1 tick below the hammer’s low (or 1 tick above a shooting star’s high) and aim for at least a 2:1 reward-to-risk ratio [2].
In early 2026, Gold Futures showed off a "Three White Soldiers" pattern after breaking out above a critical trendline. Three bullish candles in a row, each with small wicks, confirmed strong upward momentum [1].
| Pattern | Type | Entry Trigger | Stop-Loss Location | Best Timeframe |
|---|---|---|---|---|
| Bullish Engulfing | Reversal | 1 tick above the high of the signal candle | 1 tick below the low of the signal candle | 5m – 1H |
| Bearish Engulfing | Reversal | 1 tick below the low of the signal candle | 1 tick above the high of the signal candle | 5m – 1H |
| Hammer (Pin Bar) | Reversal | 1 tick above the high of the candle | 1 tick below the low of the wick | 15m – 1H |
| Shooting Star (Pin Bar) | Reversal | 1 tick below the low of the candle | 1 tick above the high of the wick | 15m – 1H |
Short-term patterns are fast and repeatable, but they demand discipline. Always wait for the candle to close, confirm with volume, and only trade when the pattern aligns with a significant structural level.
Using Volume to Confirm Chart Patterns
Volume is your secret weapon for confirming chart patterns and avoiding costly traps – especially in futures trading, where leverage can amplify mistakes. It gives you a peek into whether the big players are in the game or if you’re just chasing retail noise. Always pair breakouts with a volume spike to ensure you’re not stepping into a false move.
Patience is key. Wait for the candle to close before acting on a breakout. Don’t jump in just because the price grazes a neckline or trendline. The candle needs to close beyond the pattern’s boundary, and volume should surge in the same direction. If the volume stays flat or drops during a breakout, that’s a red flag. These "quiet breaks" are often traps, with the price snapping back into the previous range. For specific setups like the Cup and Handle, volume typically dries up during the cup formation and surges as the price breaks the rim. In flags and pennants, volume tapers during consolidation and then spikes on the breakout.
Backtesting from 2026 highlights how volume impacts success rates:
- Head and Shoulders: 89% success when volume spikes at the neckline break.
- Double Bottoms: 88% success with volume surging on the neckline break.
- Bull Flags: 85% success when breakouts are paired with rising volume.
- Ascending Triangles: 83% success when volume expands through flat resistance.
Here’s a quick breakdown of volume behavior for popular patterns:
| Pattern Name | Success Rate (Volume Confirmed) | Volume Behavior |
|---|---|---|
| Head and Shoulders | 89% | Higher on neckline break than right shoulder |
| Double Bottom | 88% | Volume spikes at neckline break |
| Bull Flag | 85% | Lighter during flag, picks up on breakout |
| Ascending Triangle | 83% | Fades inside, expands on breakout |
| Rising Wedge | 81% | Tapers inside, expands on breakout |
| Cup and Handle | 76% | Lighter inside cup, rising on breakout |
For reversals, like the Engulfing Bar, the signal candle’s volume must dwarf that of the preceding candles to confirm the move [1]. In patterns like Head and Shoulders, the volume during the neckline break should exceed what was seen during the pattern’s formation. This confirms institutional involvement [2]. When trading volatile contracts like Crude Oil (CL), volume becomes even more critical. Liquidity sweeps can create dramatic wicks that mimic reversals but lack the backing of big players [1].
Volume confirmation isn’t just a nice-to-have – it’s essential for precision. It ensures your trades are based on solid ground, as the next section on trade execution will explain.
How to Execute Trades Using Chart Patterns
Trading with chart patterns in futures isn’t about taking wild guesses – it’s about timing and stacking the odds in your favor. The first and most important rule? Wait for the candle to close. Don’t jump in just because the price touches a neckline or trendline. You need a decisive close beyond the pattern’s boundary, backed by volume confirmation. For example, with a Head and Shoulders pattern, don’t act until you see a close below the neckline paired with strong volume. Jumping in too early might feel smart, but it’s often a quick way to get stopped out [2].
Once you’ve confirmed the breakout, use the retest rule to avoid getting caught in false moves. After a breakout, prices often pull back to retest the broken level, which now serves as new support or resistance. This retest is your chance for a safer entry with a tighter stop-loss. For instance, if a Bull Flag breaks upward, wait for the price to dip back to the flag’s upper trendline and hold before entering. This strategy helps weed out weak or fake breakouts [2].
Stop-loss and take-profit placements should be automatic, not emotional. For a Head and Shoulders setup, place your stop just above the right shoulder. To set your target, measure the vertical distance from the head to the neckline and project that distance from the breakout point. For a Double Bottom, set your stop slightly below the second trough, and use the distance between the troughs and the neckline to calculate your target. Triangle patterns? Put your stop beyond the opposing trendline and aim for a target equal to the triangle’s height, projected from the breakout. Always aim for at least a 2:1 or 3:1 risk-reward ratio – if your stop is $100, your target should be $200 or more [4,11,12].
Time frame matters. Patterns on higher time frames, like 4-hour or daily charts, are generally more reliable than those on lower ones, such as 1-minute or 5-minute charts, which are full of noise and false signals. Use multi-time frame analysis to stack the odds further: identify the main trend on the daily chart, spot patterns on the 4-hour chart, and fine-tune your entry on a 15-minute chart. For example, a bullish pattern on a 15-minute chart is far more reliable if the 4-hour trend is also bullish. As Forex trader Justin Bennett puts it, "The daily time frame is the best place for most traders to start because it cuts through market noise and shows cleaner market trends" [6].
Finally, execution tools like bracket orders and OCO (One Cancels the Other) orders can take the emotion out of your trades. In fast-moving markets like Crude Oil (CL), trailing stops can help you lock in gains as the price moves in your favor. Let the chart pattern do the heavy lifting while you focus on managing your risk precisely [11,12].
Common Mistakes in Pattern Trading
When it comes to pattern trading, sidestepping common errors can make or break your success.
One big mistake? Jumping in the moment a price touches a neckline. This often results in a quick reversal. Take the example from Bookmap in 2025: NVIDIA stock briefly broke above its premarket high of $884 with some initial buying momentum. But large sell orders quickly reloaded, and the price reversed within 30 seconds, dropping $6 almost instantly [8]. This highlights why chasing early breakouts is a losing game. Instead, wait for a full candle to close beyond the pattern boundary and look for a confirmed retest before entering.
Another trap is trying to trade reversal patterns, like Head and Shoulders or Double Bottoms, in a choppy market. These setups only work at the end of a well-established trend, not in the middle of a range.
"A false-break of a level can be thought of as a ‘deception’ by the market, because it looks like price will breakout but then it quickly reverses, deceiving all those who took the ‘bait’ of the breakout" [7].
For example, trading a Double Bottom in a sideways, choppy market is almost guaranteed to fail. Always check higher time frames, like the Daily or 4-hour charts, to confirm you’re at the end of a real trend and not stuck in market noise.
Volume is another critical factor. A breakout without volume often signals weak institutional participation. One trader shared that pairing MACD with volume analysis saved her from countless fakeouts [9]. For instance, Head and Shoulders patterns boast an 89% success rate when confirmed by volume, but that number plummets without it [2]. Use volume spikes as your filter – if the big players aren’t in, you shouldn’t be either.
Exiting promptly is just as important. Fast patterns like pennants and flags lose their edge if they linger too long. A pennant that overstays its welcome morphs into a triangle, shifting the odds against you. Similarly, a flag that retraces more than 50% of the prior move often signals a dying trend. If a bull flag breaks below its support or closes under key levels like the 50 EMA or VWAP, take that as your cue to exit immediately.
"I’ve avoided many traps by confirming patterns on higher time frames, rather than relying on quick, smaller movements" [9].
And remember, the market doesn’t care about your entry price. If the pattern logic breaks, close your position without hesitation.
| Mistake | Why It Fails | Fix |
|---|---|---|
| Chasing the first break | Often a fakeout or stop hunt | Wait for candle close + retest |
| Trading in choppy markets | Reversal patterns need a mature trend | Confirm trend on Daily/4-hour chart |
| Ignoring volume | Low volume = low institutional activity | Require volume spike on breakout |
| Overstaying fast patterns | Patterns that linger lose their validity | Exit if pattern logic breaks (e.g., flag support fails) |
Keeping these missteps in check will help you maintain your trading edge.
Chart Patterns and Futures Prop Firms
Chart patterns are an essential tool for tackling evaluations at futures prop firms like Apex Trader Funding and Topstep. In these high-pressure environments, success hinges on precise execution and tight risk management. Patterns help translate market data into actionable trading plans, with defined entries, exits, and risk levels [2]. This structure is a lifesaver when you’re dealing with drawdown limits and consistency rules.
Continuation patterns, like Bull Flags and Ascending Triangles, are particularly useful if you need to spread profits across several days. For instance, Apex Trader Funding raised its consistency rule in March 2026, requiring that no single day’s profit exceed 50% of your total target (up from 30%) [10]. Backtesting from 2026 shows Bull Flags hitting an 85% success rate and Ascending Triangles coming in at 83% [2]. These patterns are predictable and help you avoid blowing through consistency limits.
Volume confirmation is another critical factor during evaluations. Weak volume on a breakout can lead to fakeouts, which can quickly eat into your drawdown. For example, Head and Shoulders patterns perform with an 89% success rate when volume confirms the move, but that number drops significantly without it [2]. Adjusting for these factors during evaluations can make or break your strategy. Always backtest your approach on historical data to verify its success rate.
A key tip: wait for a full candle close beyond the pattern boundary and a retest before entering a trade [2]. This patience can save you from unnecessary losses. And if you’re juggling consistency rules, check out our Consistency Rule Calculator to see how various firms handle these limits.
Here’s a quick breakdown of the most effective patterns for prop firm trading:
| Pattern Name | Type | Success Rate | Best for Prop Firms? |
|---|---|---|---|
| Head and Shoulders | Reversal | 89% [2] | Reliable, but watch out for big moves that might breach consistency rules [10] |
| Double Bottom | Reversal | 88% [2] | Great for catching trend reversals |
| Bull Flag | Continuation | 85% [2] | Perfect for spreading gains across multiple days |
| Ascending Triangle | Continuation | 83% [2] | Consistent and easy to execute |
| Rising Wedge | Reversal | 81% [2] | Solid with careful risk management |
These patterns, paired with proper volume analysis and patience, can give you a solid edge in passing evaluations.
FAQs
How do I confirm a breakout with volume in futures?
To confirm a breakout in futures trading, pay close attention to volume. A noticeable jump in volume when the price breaks through a key level, like support or resistance, can signal a strong move. Compare the current volume with previous bars or averages to spot any unusual activity. If volume increases right before or during the breakout, it often shows strength. However, a volume spike after the breakout could hint at a false move. Watching these patterns can help you confirm the breakout and manage your risk better.
What are the best timeframes for chart patterns in futures?
Daily timeframes tend to give the clearest chart patterns, making them the go-to choice for spotting reliable signals. They strip out much of the market noise, which is especially helpful when you’re analyzing more complex setups like reversals. If you’re into swing trading, shorter timeframes like the 1- to 4-hour charts strike a good balance – they give you decent clarity while still offering more frequent opportunities. On the other hand, intraday traders often rely on 5- to 15-minute charts. These can work for fast-paced strategies, but they come with a lot more noise, which can make them trickier to trust. Many traders mix and match timeframes, using higher ones to catch the overall trend and smaller ones for dialing in their entries and exits.
How do I size risk and stops for prop firm rules?
To handle risk and set stops under prop firm rules, stick to strict risk management. Risk a set percentage of your account per trade – 1% to 1.5% is a solid range – to safeguard your capital when drawdowns hit. Figure out stop levels based on your entry price and the max loss you’re willing to take. Make sure these stops align with the firm’s rules on drawdowns and position limits so you don’t break their thresholds. Keeping it consistent is key to staying in control of your risk.