Overloading your Nasdaq futures charts with indicators might be holding you back. Instead of adding complexity, the most effective traders focus on price action, market structure, and key levels. Here’s why simplicity works better:
- Fewer distractions: Cluttered charts with overlapping indicators (like RSI and Stochastic) create confusion and hesitation.
- Faster decisions: Simple setups, like trading around VWAP and key levels, let you act quickly in volatile markets.
- Improved discipline: Prop firms value consistent execution. A clear, one-page plan helps you stay within strict drawdown and loss limits.
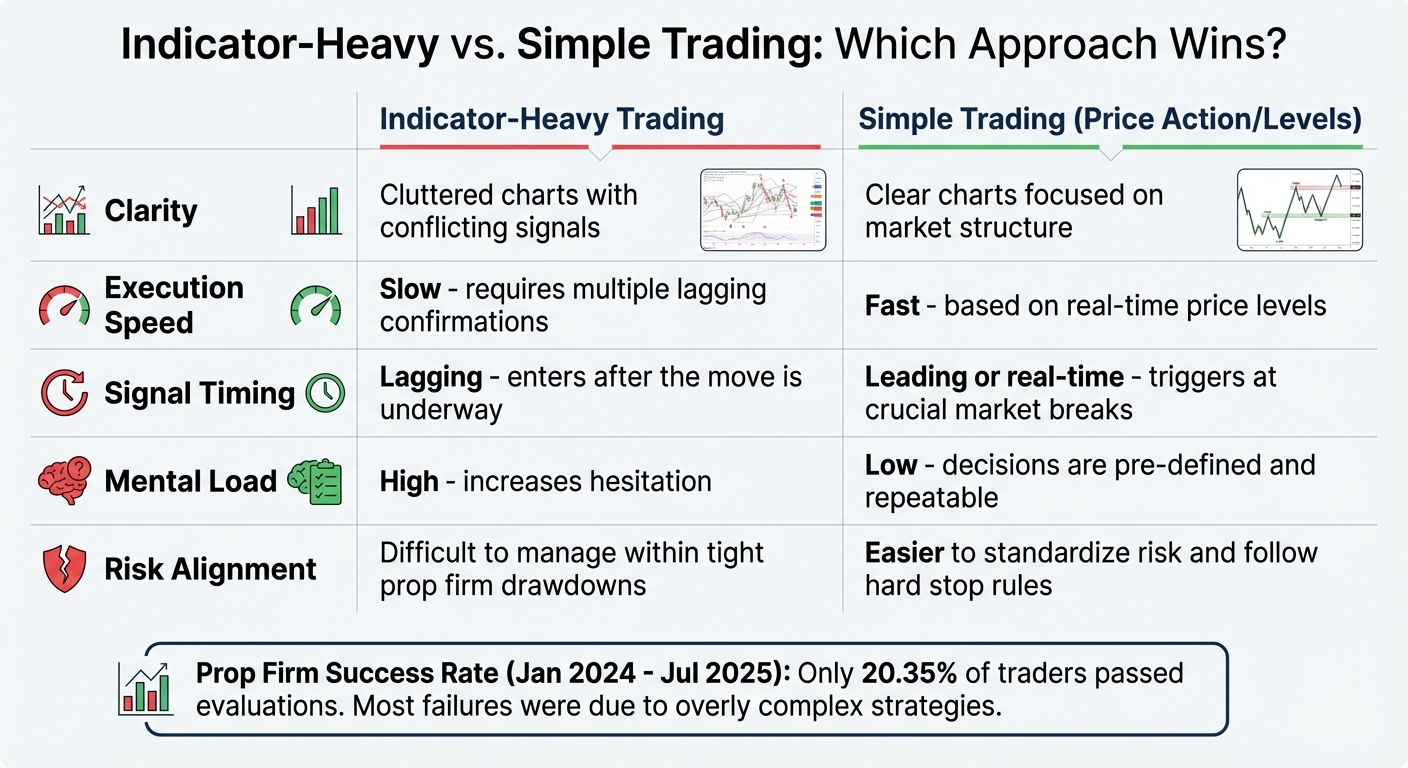
- Proven results: Between Jan 2024 and Jul 2025, only 20.35% of traders passed prop firm evaluations – most failed due to a lack of effective trading practices.
Focus on what matters: Use raw price action, VWAP, volume, and a few key levels to build a clean framework. Ditch lagging indicators and stick to simple, repeatable rules. This approach not only helps you trade more confidently but also aligns with the strict requirements of prop firms.
The Problem with Too Many Indicators
What Happens When You Stack Indicators
Imagine a Nasdaq futures chart cluttered with moving averages, oscillators, VWAP, Bollinger Bands, and trend lines. When you throw in indicators like RSI and Stochastic – both measuring similar momentum – you’re essentially duplicating the same price data. This overlap, known as multicollinearity, doesn’t add value; it just complicates things [8][10].
This complexity can derail your execution. One indicator might signal a buy, while another flashes sell. The result? Hesitation. By the time you make a decision, the market may have already shifted. As Al Brooks, a seasoned price action trader, explains:
"If you can read price action, why add all of those indicators that only obscure the charts and give you the false hope that they will somehow help you trade better?" [9]
Backtesting supports this idea. A straightforward 25-day price momentum rule on Bitcoin delivered a profit factor of 3.84, while more intricate RSI-driven strategies barely broke even at 1.0 [10].
In fast-paced markets like Nasdaq futures, delays in action mean worse entry prices and larger losses on exits. Beyond the execution challenges, this complexity clouds your mental clarity, making it harder to trade effectively.
How Complexity Affects Your Trading Psychology
A messy chart doesn’t just confuse your strategy – it messes with your head. Staring at conflicting signals can overwhelm your brain, disrupting the calm, disciplined approach that consistent trading demands.
Indicators can also act as a crutch, shielding you from the reality of price action [9]. Instead of truly understanding the market, you might find yourself relying on lagging indicators that often fail in live trading conditions.
When trading with high leverage or under strict drawdown rules, clarity is non-negotiable. Complex setups lead to hesitation, emotional decisions, and the dreaded "hold and hope" mentality when trades go south – habits that professional trading firms won’t tolerate. A clean, simple framework, on the other hand, helps you stick to your rules and cut losses quickly. Curtis Faith, one of the original Turtle Traders, puts it best:
"Simple time tested methods that are well executed will beat fancy complicated methods every time" [7]
Ultimately, the delays and mental strain caused by overcomplicated setups underscore why simplicity is key to success in Nasdaq futures trading.
sbb-itb-46ae61d
LIVE Scalping The Futures Markets With PRICE ACTION RULES
Why Simple Strategies Work Better for Nasdaq Futures
Indicator-Heavy vs Simple Trading Strategy Comparison for Nasdaq Futures
In the fast-moving world of Nasdaq futures, every second counts. With volatility and momentum shifts happening in an instant, you need a strategy that cuts through the noise and lets you act decisively when prices hit key levels or break market structures. A streamlined, no-frills approach makes this possible.
Between January 1, 2024, and July 1, 2025, only 20.35% of evaluation accounts at MyFundedFutures successfully advanced to the next stage [3]. The traders who succeeded weren’t relying on complex systems. Instead, they followed simple, repeatable rules designed to stay within strict drawdown limits and daily loss caps. As MyFundedFutures explains:
"Overcomplicated strategies often lead to analysis paralysis and costly mistakes, when faced with high-pressure situations in the market. By contrast, embracing simplicity allows traders to react swiftly, even when the market whipsaws." [3]
This highlights the importance of having a clear and efficient strategy. A one-page plan – focused on specific entries, stops, and targets – eliminates guesswork and enables you to act on real-time price signals without hesitation.
What a Simple Trading Strategy Includes
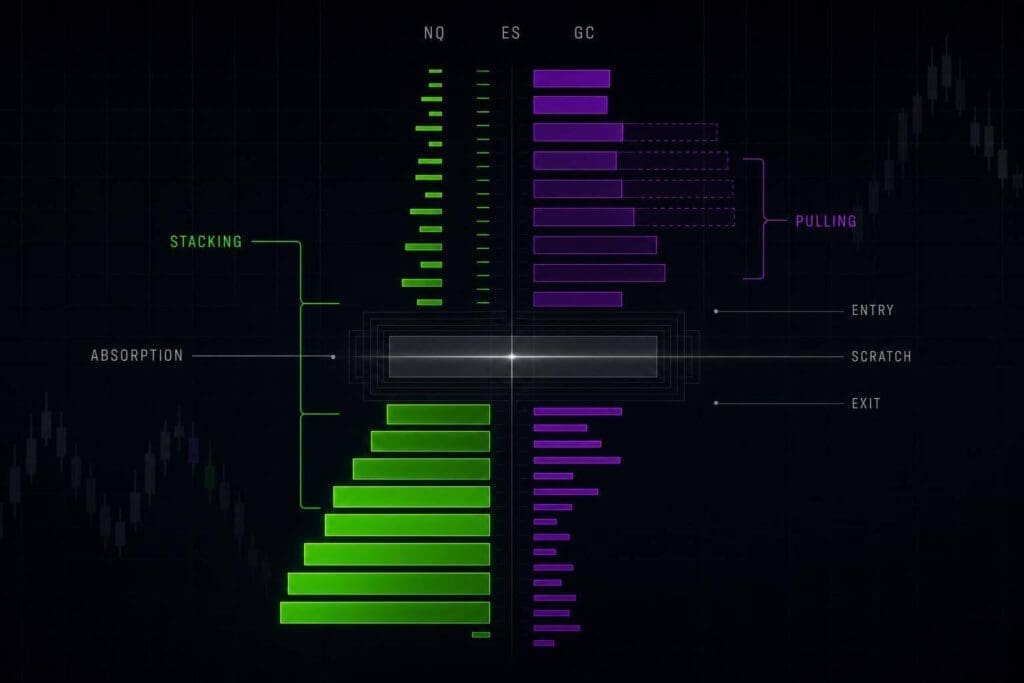
Keeping it simple means sticking to the essentials when trading Nasdaq futures. Forget about cluttering your charts with endless indicators. Instead, focus on four core elements: raw price action, market structure, key levels, and basic volume confirmation.
- Price action gives you a direct look at real-time buyer and seller activity.
- Market structure shows whether the market is trending – higher highs and lows – or breaking down, giving you a directional bias without overloading your screen.
- Key levels serve as your anchors. Mark the prior session’s high and low, overnight high and low, and the market’s opening price. Add VWAP (Volume Weighted Average Price) for context: prices above VWAP indicate buyer control, while prices below suggest sellers are in charge. These levels often attract institutional orders, aligning your trades with the so-called "smart money" [4][11].
- Volume confirmation helps validate your decisions. For example, a breakout with rising volume shows conviction, while falling volume during a rally signals weakness. Simple tools like volume bars or cumulative delta are enough [4].
That’s all you need – no oscillators, no lagging moving averages. Just the core elements that drive price movements in the Nasdaq.
Indicator-Heavy vs. Simple Trading: A Comparison
Let’s compare the two approaches under prop firm rules:
| Feature | Indicator-Heavy Trading | Simple Trading (Price Action/Levels) |
|---|---|---|
| Clarity | Cluttered charts; conflicting signals | Clear charts; focus on market structure [4] |
| Execution Speed | Slow; requires multiple lagging confirmations | Fast; based on real-time price levels [3] |
| Signal Timing | Lagging; often enters after the move is underway [6] | Leading or real-time; triggers at crucial market breaks [11] |
| Mental Load | High; increases hesitation | Low; decisions are pre-defined and repeatable |
| Risk Alignment | Difficult to manage within tight prop firm drawdowns | Easier to standardize risk and follow hard stop rules [3] |
In fast-moving markets like the Nasdaq, execution speed is critical. Relying on lagging indicators means you risk entering too late, after the move has already started. A trader with a simple strategy, on the other hand, watches for price to break above the prior day’s high with strong volume and takes action immediately – no hesitation, no second-guessing.
When trading under strict prop firm rules – like managing a trailing drawdown or sticking to daily loss caps – you can’t afford to hold onto losing trades while waiting for signals. Simple strategies let you cut losses quickly and stay within the firm’s guidelines [3]. As MyFundedFutures puts it:
"Rules may feel restrictive, but structure actually creates freedom by removing uncertainty." [3]
This clarity is a game-changer. With a clean chart and well-defined rules, you can trade with confidence instead of second-guessing every move.
How to Build a Simple Framework for Nasdaq Futures
When creating a framework for trading Nasdaq futures, simplicity is key. This approach zeroes in on the essentials: understanding market structure and key levels, using volume and VWAP for confirmation, and applying strict risk management that aligns with prop firm requirements.
Using Market Structure and Key Levels
Start by analyzing real-time market trends through visible swing points. A bullish market structure shows higher highs and higher lows, while a bearish structure features lower highs and lower lows [15]. Mark these swing points directly on your chart.
Before the market opens, identify key levels to watch. These include the session open, the previous day’s high and low, and the overnight high and low [3][13]. During the first 30 minutes of trading (9:30–10:00 AM EST), pay attention to the opening range breakout, which often sets the tone for the morning [13].
To refine your analysis, overlay Volume Profile and price action data to locate liquidity zones. Focus on the Point of Control (POC), Value Area High (VAH), and Value Area Low (VAL) from the prior session [12]. These zones highlight where the most trading activity occurred and can act as price magnets. Additionally, keep an eye on psychological round numbers like 20,500 or 21,000, as institutional orders often cluster around these levels [12].
Here’s a quick checklist: determine the market trend (higher highs/lows or lower highs/lows), pinpoint nearby liquidity zones (such as yesterday’s high and low), and confirm these levels using volume [13][11]. If the price opens outside the previous day’s value area but moves back into it, the 80% Rule suggests there’s an 80% chance it will travel across the entire value range [11].
This initial setup of structure and liquidity forms the foundation for confirming trades with volume and VWAP.
Using Volume and VWAP as Confirmation
Once key levels are identified, use VWAP and volume to confirm the move. VWAP (Volume Weighted Average Price) provides an intraday bias: trading above VWAP indicates buyers are in control, while trading below it signals sellers dominate [12]. Institutions often use VWAP to build positions discreetly, making it a reliable indicator of the day’s "fair value" [14].
In an uptrend, prices tend to bounce off VWAP, while in a downtrend, VWAP often caps price movements. A break of VWAP after multiple tests can signal a momentum shift [14][16]. If Nasdaq futures move far from VWAP, they frequently revert back to it – offering a setup for counter-trend trades during extreme intraday conditions [14][17].
Volume is the ultimate confirmation for any move. For instance, a breakout above the previous day’s high requires a surge in volume to confirm institutional participation [3][16]. Without this volume, the breakout is more likely to fail. As Faisal from TradePro Academy explains:
"Volume is the single most important thing that dictates the direction of price and where price wants to trade." [5]
Replace lagging indicators like MACD or RSI with VWAP and a volume histogram to simplify your analysis and avoid clutter [14][3]. Additionally, plotting standard deviation bands around VWAP can help identify overbought or oversold conditions, providing opportunities for potential reversals [16][12].
Risk Management for Prop Firm Evaluations
A clear chart setup requires equally clear risk rules, especially when trading under prop firm guidelines. Many firms use trailing drawdowns, where your maximum loss threshold rises with your account balance but never decreases. This means one bad trading day could disqualify you [3].
Adopt a "three losses and stop" rule: if you hit three losing trades in a day, shut down your platform and step away. This protects not only your capital but also your mental clarity. As MyFundedFutures emphasizes:
"A futures trading plan isn’t just about chart patterns or indicators. It’s about bridging strategy with consistent action – under the real constraints of prop firm rules, account sizes, and trailing drawdowns." [3]
Document every trade with screenshots, along with notes on your reasoning and mindset at the time [3]. This practice can help you determine whether your setups are failing due to market conditions or because of emotional deviations from your plan. If your trading plan can’t fit on a single page, it’s likely too complicated [3].
Concentrate your trading during high-volume periods: the New York Open (9:30–11:00 AM EST) and the Power Hour (3:00–4:00 PM EST) [13]. These times typically offer the best liquidity and tighter spreads.
How to Switch to a Simple Trading Approach
Moving from a cluttered, indicator-heavy trading setup to a cleaner, price-focused strategy takes intentional effort. It’s not just about ditching tools – it’s about reshaping how you interpret the market and make decisions.
Cleaning Up Your Charts
Start by removing unnecessary indicators. Get rid of oscillators like MACD, RSI, and Stochastic. These tools often lag behind price movements and can make it harder to react quickly, especially in fast-moving markets like Nasdaq. Your chart should focus on raw price action and include only essential tools like VWAP.
Mark critical levels on your chart: yesterday’s high and low, overnight high and low, and the prior session’s Point of Control from the Volume Profile. These levels are key liquidity zones where institutional orders tend to cluster. As professional trader Nial Fuller wisely notes:
"Simplicity is the most often and easily overlooked ingredient to profiting long-term in any financial market." [2]
With a clearer chart, you’ll start to notice natural price patterns like pin bars, trend bars, and false breaks. These patterns can guide your trades. Once your charts are simplified, the next step is to create straightforward trading rules.
Creating Clear Trading Rules
Keep your trading plan simple – ideally just one page [3]. Define a clear filter to decide whether a trade setup is worth taking. For instance, you might say: “Only take long trades when price is above VWAP and the market structure shows higher highs and higher lows.”
Be specific about your entry criteria. Instead of vague instructions like “buy the dip,” set clear conditions, such as: “Buy the first pullback to the 20 EMA after a 20-day high, as long as the retracement is less than 50%.” Manage your risk by limiting each trade to 0.25%–0.5% of your account equity. Use bracket orders with pre-set stop-losses and take-profit levels to enforce discipline automatically.
If you’re trading Nasdaq futures, consider using Micro contracts (MNQ). They allow for wider stop-losses while keeping your risk within prop firm trailing drawdown limits. Statistics from MyFundedFutures show that between January 1, 2024, and July 1, 2025, only 20.35% of evaluation accounts advanced beyond the evaluation stage, and just 1.01% reached live-capital funding [3]. These numbers highlight the importance of strict adherence to your rules over chasing a flawless strategy. Once your rules are in place, tracking your performance becomes the next critical step.
Tracking Your Performance and Consistency
Document every trade you take. Include a screenshot showing your entry and exit points, contract size, and the reasoning behind the trade. Group your trades by type – whether pullback, breakout, or reversal – to evaluate which setups work best in the current market environment.
Track your rule compliance as closely as you track your profit and loss. A trade that wins but breaks your rules should be treated as a failure in discipline, not a success. MyFundedFutures emphasizes this point:
"A lucky win outside the plan is a red flag, not a success." [3]
Focus on two key metrics: your win rate and your average R multiple (reward-to-risk ratio). Even a small edge, applied consistently, can lead to meaningful account growth over time. Dedicate 10–20 minutes daily to reviewing your trades, and conduct a more detailed weekly analysis to spot recurring issues. Ask yourself: Did I stick to my plan? Was the setup valid? How can I refine my approach?
Keep a close eye on your maximum drawdown to ensure it stays within prop firm limits. If you hit a 6% drawdown, take a three-day break to reset mentally. This level of discipline is essential for meeting the strict requirements of prop firms. Tools like the Consistency Rule Calculator from DamnPropFirms can help you assess whether your trading meets these standards before you risk paying evaluation fees.
Conclusion
Simplicity offers a clear edge when trading Nasdaq futures, paving the way for faster decisions, smoother execution, and better alignment with prop firm rules. As Curtis Faith, author of Turtle Trader, wisely said:
"Simple, time-tested methods that are well executed will beat fancy, complicated methods every time." [10]
Time and again, straightforward strategies outperform overly complex ones in live trading. This highlights the importance of adopting a lean, focused approach that prioritizes clarity and precision.
A minimalist trading framework helps cut through mental clutter, especially in volatile markets. It prevents the confusion caused by conflicting signals from too many indicators – the classic "too many cooks in the kitchen" problem [1][2]. This kind of clarity is essential when working within the strict rules of prop firms, where success hinges on disciplined execution, not the sophistication of your tools.
Strip your charts down to the essentials. Mark key levels, set clear risk parameters, and stick to your plan without hesitation. If your trading strategy can’t be summarized on a single page, it’s likely too complicated [3]. Remember, the goal isn’t to trade more – it’s to trade better [4]. Tools like the Consistency Rule Calculator from DamnPropFirms can help ensure your streamlined strategy aligns with prop firm standards before you dive into an evaluation.
Consistent profitability in Nasdaq futures doesn’t demand an advanced degree in technical analysis. What it does require is the courage to let go of complexity and focus on what truly matters: simple, repeatable, and disciplined execution.
FAQs
How does simplifying my trading strategy help with Nasdaq futures?
Simplifying your approach to trading Nasdaq futures can do wonders for your performance. By cutting down on information overload and avoiding analysis paralysis, you’ll find it easier to focus on what really matters: price action, market structure, and those all-important support and resistance levels. This sharper focus allows you to make quicker, more confident decisions without constantly second-guessing yourself.
Keeping things simple also helps you stick to your trading plan, which is critical for long-term success. Instead of juggling a dozen technical indicators, rely on clear entry and exit rules, manageable position sizes, and tools like volume analysis. This streamlined strategy not only sharpens your decision-making but also makes it easier to adjust to changing market conditions.
What should I focus on to simplify my Nasdaq futures trading strategy?
Simplifying your trading strategy begins with emphasizing price action. This means focusing on the raw movement of prices, identifying key levels like support and resistance, and understanding market structure (such as higher highs or lower lows). These straightforward elements reveal shifts in supply and demand without the need for lagging indicators. A clean chart – showing just the price and a few horizontal levels – can make it easier to identify high-probability setups like breakouts or reversals.
The next step is to create clear, straightforward rules for your trades. Define an entry trigger, such as going long when the price breaks above the previous day’s high on strong volume. Pair this with a pre-determined exit plan, including a stop-loss and a profit target, and stick to consistent position sizing – for example, risking no more than 1% of your account per trade. Keeping your plan simple and easy to follow helps you stay disciplined and avoid second-guessing your decisions.
Finally, narrow your focus to a specific market and session that fits your trading edge. For instance, trading Nasdaq futures during the U.S. morning session, when liquidity is at its peak, can lead to better execution. By concentrating on one asset and using a straightforward price-action strategy, you minimize distractions and trade with more confidence.
Why do prop firms prefer traders who use simple strategies instead of complex ones?
Prop firms tend to prefer traders who stick to simple, rule-based strategies. Why? Because these approaches are easier to monitor, evaluate, and scale. Strategies that focus on price action or key support and resistance levels, for instance, allow firms to gauge performance and risk management without wading through the complexities of intricate indicator setups. Plus, straightforward methods make it easier for traders to adjust to shifting market conditions, minimizing the danger of strategies becoming overly tailored to past data.
Another advantage of simplicity is its impact on execution. Clear entry and exit rules reduce the chances of errors and help traders make quicker, more confident decisions. This precision is essential for staying within a firm’s performance and risk guidelines. On top of that, simple strategies are easier for firms to replicate across multiple accounts or traders, aligning with their goal of creating a reliable and profitable trading team.