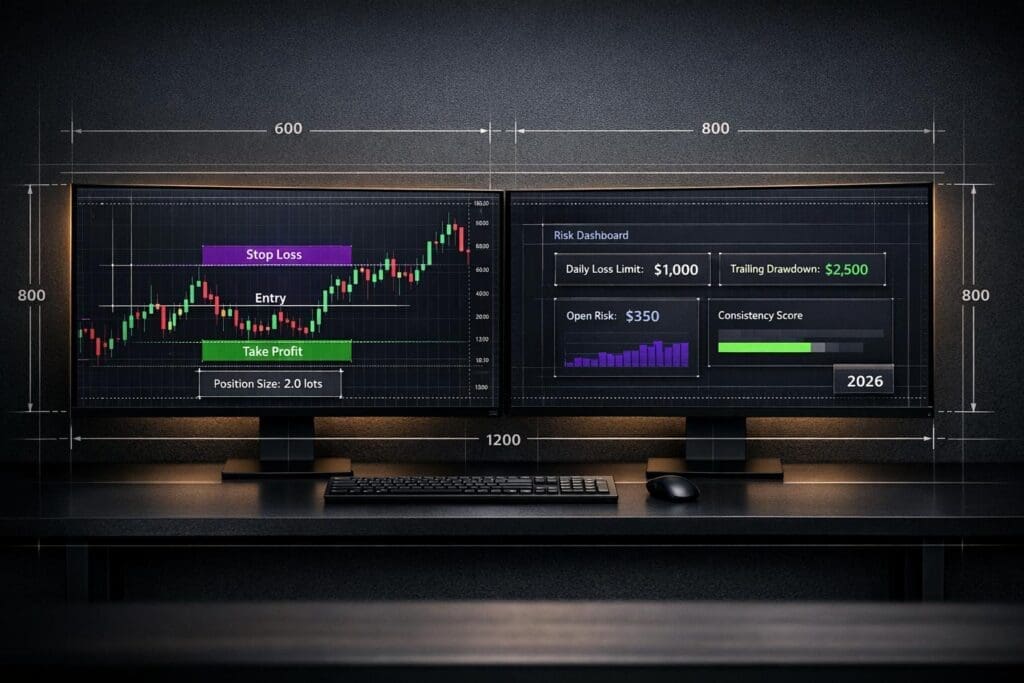
Backtesting is a critical process for prop traders to test and refine trading strategies using historical data. Unlike retail traders, prop traders must adhere to strict firm-specific rules, such as daily loss limits (3–5%), trailing drawdowns (6–10%), and consistency thresholds (40–50% profit contribution per day). These rules ensure risk management and compliance during live trading.
Key takeaways:
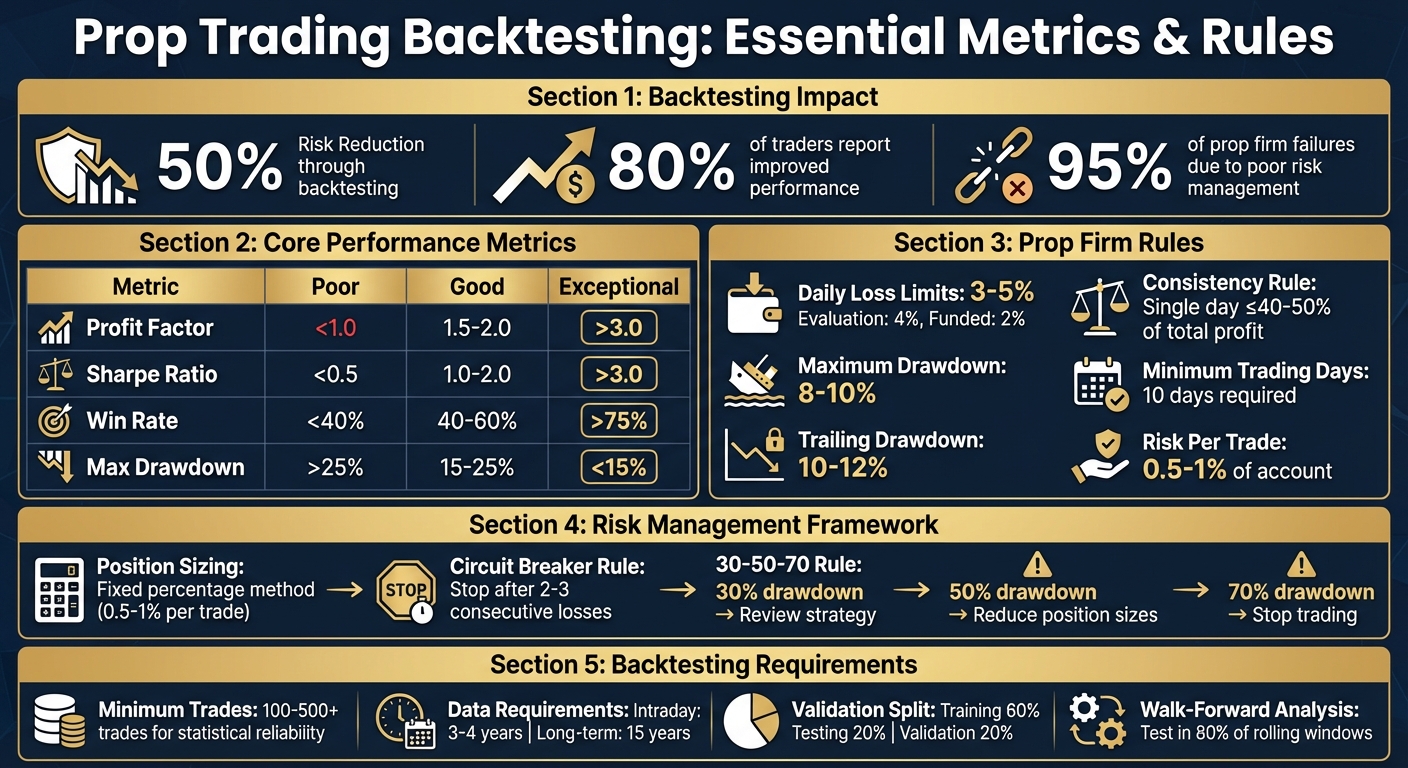
- Backtesting Benefits: Reduces risk by up to 50%, improves performance for 80% of traders, and identifies weaknesses before live trading.
- Core Metrics: Focus on profit factor (≥1.5), maximum drawdown (≤10%), win rate (40–60%), and Sharpe ratio (≥1.0).
- Prop Firm Rules: Simulate conditions like drawdown limits, daily loss caps, and consistency rules to pass evaluations.
- Avoid Overfitting: Use walk-forward analysis, limit strategy variants, and test across market regimes to ensure reliability.
- Risk Management: Stick to 0.5–1% risk per trade, use circuit breakers, and scale positions conservatively.
Prop Trading Backtesting: Key Metrics and Performance Benchmarks
Building a Rule-Based Backtesting Framework
Defining Entry, Exit, and Risk Parameters
Creating a successful backtesting framework starts with clear, actionable rules. These rules translate concepts into specific triggers that computers can execute, like a 10-day moving average crossing above a 50-day moving average.
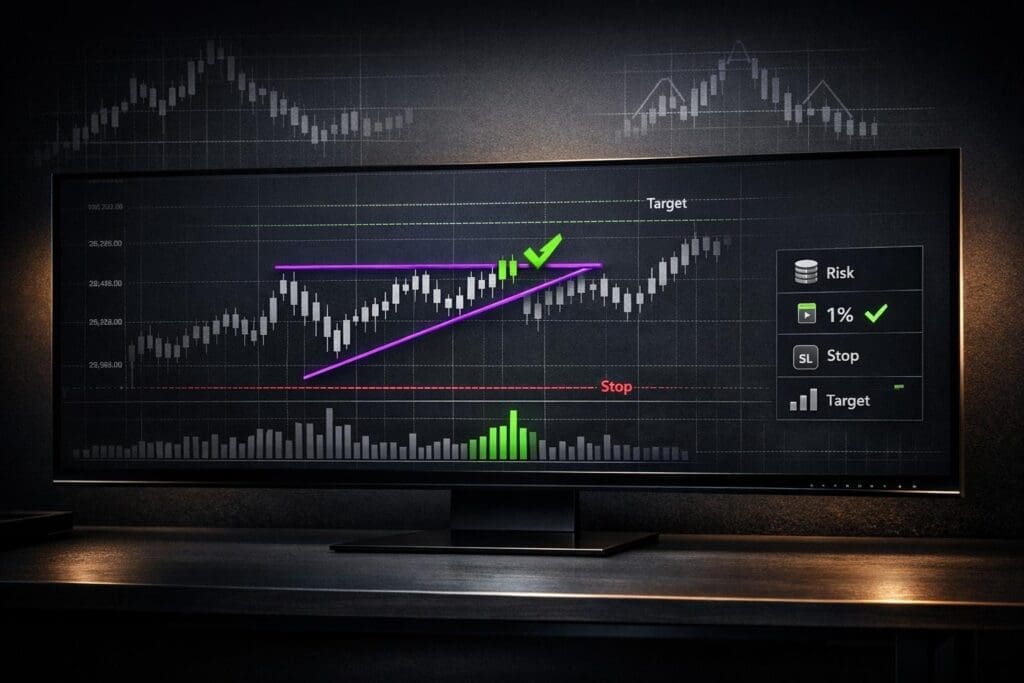
Your framework should cover five essential components: entry criteria, exit criteria, position sizing, stop loss placement, and reward-to-risk ratios. Entry setups should detail exact technical triggers, such as pullbacks to the 50% Fibonacci retracement, breakouts above resistance with volume confirmation, or reversals identified by double tops with RSI divergence. Exit rules need to define both profit targets and stop losses, which can be based on technical levels (e.g., 5–10 pips beyond support) or volatility indicators like the Average True Range (ATR).
"Ambiguous rules yield indeterminate outcomes." – FX Replay
Position sizing is critical for managing risk and surviving losing streaks. The fixed percentage method – risking 0.5% to 1% of your account per trade – is widely used and allows for 10–20 consecutive losses without breaching typical prop firm drawdown limits. With a 1:2 reward-to-risk ratio, even a 34% win rate can break even. Risk management is key, as 95% of prop firm failures result from poor risk practices.
Don’t forget to account for commissions, bid-ask spreads, and slippage. These factors can turn a backtested strategy that looks profitable into one that underperforms in live trading. Scalping strategies, in particular, often struggle when these costs are considered.
Once your rules are established, document them thoroughly. This ensures consistency when transitioning from backtesting to live trading.
Documenting Your Trading Plan
Prop firm evaluations require more than just profitability – they demand structured and well-documented trading plans that align with specific risk and consistency standards. A trading plan acts as a roadmap, eliminating guesswork. ATFunded emphasizes this point:
"At ATFunded, we don’t reward random trades. We reward structure, discipline, and execution".
Keep your plan concise – ideally, it should fit on one page. Overcomplicating it can lead to inconsistency, especially under the pressure of live trading.
Organize your setups into distinct strategies, such as trend-following, range trading, or breakouts. For each, outline exact entry conditions with measurable thresholds. For example, instead of saying "enter on volatility expansion", specify "enter when the current bar’s ATR exceeds 1.5 times the 14-period ATR average." Include screenshots of ideal setups and note the specific market conditions where each strategy excels.
Your plan should also address prop firm-specific requirements. Document details like your maximum daily loss limit (commonly 4–5% of the starting balance), trailing drawdown threshold (usually 10–12%), and risk per trade (0.5–1%). Incorporate a circuit breaker rule to stop trading for the day after two or three consecutive losses, avoiding emotional decision-making. Some traders follow the 30-50-70 rule: at 30% of maximum drawdown, review your strategy; at 50%, reduce position sizes; and at 70%, stop trading altogether.
Focus on mastering 2–3 instruments, such as EUR/USD, gold, or NASDAQ futures. This approach helps you learn the unique volatility patterns and daily ranges of each instrument – knowledge that complements backtesting and is invaluable during live trading.
| Component | What to Document | Prop Firm Requirement |
|---|---|---|
| Entry Criteria | Specific technical/fundamental triggers (e.g., "50-day MA cross") | Must be objective and repeatable |
| Exit Criteria | Take-profit levels, stop-loss placement, time-based exits | Must protect account equity |
| Risk Per Trade | Percentage of account risked per position | Often restricted to 0.5–1% |
| Max Daily Loss | Hard limit on daily equity decline (typically 4–5%) | Required for prop firm compliance |
| Max Drawdown | Maximum peak-to-trough decline allowed (10–12%, trailing) | Required for prop firm compliance |
sbb-itb-46ae61d
Testing Across Market Conditions and Historical Data
Selecting and Analyzing Historical Data
Once you’ve established clear rules and a documented plan, the next step is to focus on selecting and analyzing historical data. The amount of data you’ll need depends heavily on your trading style. For intraday strategies, 3–4 years of data is typically sufficient, while long-term position strategies may require about 15 years to capture full market cycles. For monthly strategies, aim for at least 8 years of data, which translates to around 100 trades for statistical reliability.
A robust backtest should include 100 to 500+ trades to separate genuine skill from mere luck. For day traders, this often means testing over 500 trades within a 6–12 month window. Swing traders, on the other hand, should target 200+ trades spanning 2–3 years. As David Bergstrom, a quantitative strategy developer, puts it:
"A good backtest should be a requirement for risking capital".
The quality of your data is just as important as the amount. High-frequency strategies benefit from tick-level or minute data, while daily OHLC data works well for swing trading. Additionally, before starting your tests, include a warm-up period of 20–200 days to allow technical indicators to stabilize.
To avoid overfitting, split your dataset into training (60%), testing (20%), and validation (20%) sets. Build your strategy on the training set, then validate it on unseen data to ensure it performs consistently.
Be mindful of transaction costs – they can turn a seemingly profitable strategy into a losing one. For example, a strategy with an average profit of $10–$15 per trade might become unprofitable when commissions and slippage are factored in. Advanced traders often conduct noise testing by adding or subtracting volatility to historical price data. This step ensures the strategy isn’t overly tailored to specific historical patterns.
Evaluating Results by Market Regime
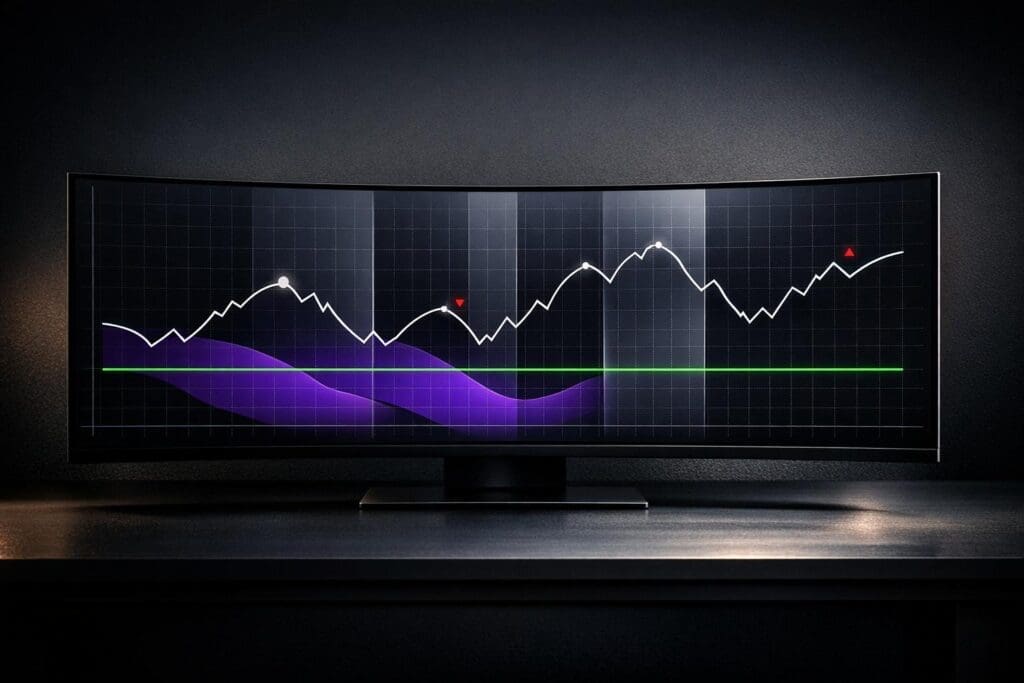
Breaking down your strategy’s performance by market regime helps determine whether it works consistently or only under specific conditions. Test it across bull markets, bear markets, sideways trends, and periods of varying volatility. If a strategy excels during trending markets but fails in range-bound periods, it may have "regime sensitivity", making it vulnerable to shifts in market conditions.
Marcos Lopez de Prado, a leading quant researcher, offers a clear distinction:
"The backtest is fit when the strategy is profiting from a signal, and overfit when the backtest is profiting from noise".
If your strategy falters after adding random volatility to historical data, it’s likely overfitted to noise rather than built on a repeatable edge.
To ensure your strategy holds up over time, use rolling window analysis and walk-forward optimization. Rolling windows analyze performance over segments of 60–120 trades, helping identify whether success is due to luck or genuine robustness. A strong strategy should remain profitable in at least 80% of these windows. Walk-forward optimization takes this a step further by optimizing parameters on one data segment and testing them on a separate out-of-sample period. This approach simulates how your strategy adapts to changing market conditions.
For example, in 2023, a mid-sized futures prop firm used TradingView to backtest strategies with rigorous out-of-sample testing and walk-forward analysis over six months. The result? A 15% improvement in their Sharpe ratio and a 20% reduction in maximum drawdown.
Stress testing with synthetic data is another critical step. It helps evaluate whether your strategy can withstand extreme events, such as the 2008 financial crisis or the 2020 market crash. Testing on related markets is also important – if a strategy built for the S&P 500 fails on the NASDAQ, it might be overfitted to the unique noise of a single instrument.
Key Backtesting Metrics for Prop Traders
Core Metrics: Win Rate, Profit Factor, and Drawdown
When it comes to evaluating your backtest, certain metrics stand out as essential benchmarks. Prop traders, known for their stringent standards, rely on these numbers to ensure their strategies align with firm requirements and maintain a rule-based approach to risk and performance.
One of the most important metrics is the profit factor, which compares gross profits to gross losses. A profit factor of 1.5 is considered the minimum acceptable level after accounting for slippage and commissions. A score of 2.0 or higher is ideal, while anything below 1.0 indicates your strategy is losing money.
Another critical metric is maximum drawdown (MDD), which measures the largest drop in equity from a peak to a trough. Prop firms take this metric seriously, as exceeding the allowed drawdown typically leads to account closure. Most firms cap MDD between 5% and 10%. If your backtest shows a 25% drawdown, expect live trading to push that number to 35–40% due to factors like slippage and emotional decision-making. It’s wise to choose strategies that can handle at least 1.5 times the backtested drawdown.
Profitability is also influenced by the win rate and the risk-reward ratio. For instance, with a 1:2 risk-reward setup, you only need a 35% win rate to turn a profit. Additionally, the Sharpe ratio, which measures returns adjusted for risk, is a key indicator. A ratio above 1.0 is considered good, while professional strategies often aim for 2.0 or higher.
Here’s a quick look at how these metrics stack up:
| Metric | Poor/Losing | Good/Professional | Exceptional |
|---|---|---|---|
| Profit Factor | < 1.0 | 1.5–2.0 | > 3.0 |
| Sharpe Ratio | < 0.5 | 1.0–2.0 | > 3.0 |
| Win Rate | < 40% | 40%–60% | > 75% |
| Max Drawdown | > 25% | 15%–25% | < 15% |
These metrics form the backbone of any strategy evaluation, ensuring it meets the rigorous standards of prop trading.
Prop-Specific Metrics: Daily Loss Limits and Consistency Rules
In addition to standard performance metrics, prop firms have their own set of rules to evaluate traders. One key measure is the daily loss limit, which caps how much you can lose in a single day. For funded accounts, this limit is typically around 2%, while evaluation challenges might allow up to 4%. Exceeding this limit often results in failing the evaluation. As DealPropFirm puts it:
"95% of prop firm evaluation failures come from poor risk management, not bad trading strategies".
Another important rule is the consistency rule, which ensures your profits are spread out over multiple days rather than relying on one exceptional trading session. This is usually expressed as the percentage of your total profit that comes from your highest-grossing day, with thresholds ranging from 30% to 50%. For example, if you earned $1,000 in total profits and $600 came from a single day, that 60% contribution would violate a 50% consistency rule. To fix this, you’d need to trade more days with smaller positions to balance out the profit distribution.
Some firms, like Apex Trader Funding, also use trailing drawdown rules. These adjust the drawdown limit as your account grows, making it tougher to maintain a buffer as profits increase.
Prop firm evaluations typically require a minimum of 10 active trading days to ensure your performance isn’t based on a single market event. To prepare for this, monitor your daily profit and loss during backtesting to ensure no single day dominates your results. Additionally, during evaluations, it’s crucial to limit your risk per trade to 0.5%–1% of the account balance. This provides a safety net against hitting drawdown limits.
One way to manage risk is to implement a "circuit breaker" rule: stop trading for the day after three consecutive losses or if you hit 50% of the daily loss limit. This approach can help you maintain discipline and avoid unnecessary setbacks.
Avoiding Backtesting Pitfalls and Overfitting
What Is Overfitting and How to Avoid It?
Overfitting happens when a trading strategy is overly tailored to historical noise instead of actual market patterns. This often results in backtests that look flawless but fail miserably in live trading. As Jo from beefed.ai explains:
"The most dangerous backtests are the ones that are too deterministic. If your backtest passes only one carefully tuned historical path, it will usually fail when the market cares about a different path."
Here’s a startling fact: if you test 100 different strategy variants, there’s a 92% chance you’ll find a seemingly profitable one purely by luck, even if it lacks a real edge. Additionally, over 78% of published trading strategies fail when tested on fresh data, and the average Sharpe ratio drops by 63% when transitioning from backtested to live trading.
Take this real-world example: a Reddit trader, "QuantNewbie87", lost $47,000 after optimizing a strategy using 217 different moving average combinations without proper validation. On the flip side, "SystematicTrader42" on QuantConnect kept things simple, optimizing only three variables – RSI threshold, stop-loss, and position sizing – and used walk-forward analysis. This disciplined approach resulted in live performance within 12% of the backtested results.
To avoid falling into the overfitting trap, consider these strategies:
- Use walk-forward analysis instead of relying on a single fixed data split, like the common 70/30 split.
- Apply the Deflated Sharpe Ratio (DSR) to account for selection bias and the number of trials. A DSR below 1.0 indicates a high risk of failure in live trading.
- Pre-register your strategy by clearly defining entry, exit, and risk rules upfront. This eliminates the temptation to tweak parameters after seeing poor results.
- Limit the number of strategy variants to 20–30. Testing beyond this range increases the likelihood of overfitting to over 50%.
- Reduce data-snooping bias by pre-registering strategies, which can cut this bias by 41%.
Once you’ve tackled overfitting, the next step is stress testing your strategy to see how it performs in extreme market conditions.
Stress Testing for Market Crises
Even the most well-tested strategy can crumble during a market crisis. Stress testing helps you prepare by simulating worst-case scenarios, ensuring your strategy can handle volatility spikes, liquidity challenges, and macroeconomic shocks. Instead of relying on average market conditions, stress testing pushes your strategy to its limits – where spreads widen, slippage increases, and orders might not fill as expected.
Start by fine-tuning your Transaction Cost Model (TCM) using historical fill data. Then, inflate impact parameters by 20–50% to mimic crisis-level conditions. Test your strategy under varying scenarios, such as:
- Normal market conditions
- Moderate crises (Stress-1)
- Severe crises (Stress-2)
As Damon Falk from Midlands in Business puts it:
"Backtesting isn’t about finding the perfect strategy. It’s about avoiding the ones that will destroy your account."
To further improve reliability, use techniques like purging, embargoing, and combinatorial symmetric cross-validation (CSCV). These methods can reduce false positives from 68% to 22%. Finally, set up automated performance monitoring. Track live metrics such as realized slippage and win rate, and implement throttles to shut down the strategy if these metrics deviate significantly from backtest expectations. This rigorous approach can help you navigate market crises while staying aligned with prop firm risk management standards.
Backtesting Strategies Under Prop Firm Rules
Simulating Prop Firm Evaluation Conditions
When preparing for prop firm evaluations, backtesting isn’t just about testing your strategy – it’s about replicating the specific constraints you’ll face during live trading. Most prop firms enforce three key drawdown rules:
- Daily Drawdown: Typically 4–5% of your account value.
- Maximum Drawdown: Usually 8–10% of your initial balance.
- Trailing Drawdown: Based on the highest equity achieved.
Another critical metric is the Consistency Rule, which evaluates how evenly profits are distributed across trading days. For instance, if your best trading day generates $1,200 out of a total $7,500 profit (16%), you might pass a 20% threshold but fail under stricter limits. To check compliance, use the formula:
Biggest Day PnL / Consistency % = Total Balance Needed.
You’ll also need to simulate operational constraints like minimum trading days (often 5–10), mandatory stop-losses, and restrictions on news trading or holding positions over the weekend. Notably, over 70% of rule violations stem from poor drawdown management or breaking hedging/correlation rules. As FundedFast points out:
"The most successful funded traders don’t view prop firm rules as limitations, but as a framework that aligns with professional risk management principles."
It’s equally important to avoid strategies that rely on prohibited methods like high-frequency trading (HFT), latency arbitrage, or martingale systems without strict stop-losses. While these approaches may look good in standard backtests, they typically fail under live evaluation conditions.
Once you’ve accounted for these rules, the next step is refining your position sizing to manage risk effectively.
Adapting Position Sizing for Evaluation Stages
Position sizing plays a pivotal role in navigating the evaluation process. During this phase, focus on capital preservation rather than maximizing profits. To buffer against volatility, limit your position sizes to 60–75% of the firm’s maximum allowed.
A helpful guideline is the 30-50-70 Rule, which suggests reviewing your strategy at 30% drawdown, scaling back positions at 50%, and halting trading entirely at 70%. For futures traders, starting with Micro contracts is a smart way to build a profit cushion before transitioning to Mini contracts. This approach helps manage tighter trailing drawdowns as your equity grows.
After experiencing a significant loss, reduce your position size by 40–50%. This allows you to recover without risking a breach of daily loss limits. Sticking to a fixed risk per trade – such as 0.5% or 1% of your capital – can also prevent a single large win from violating the Consistency Rule. Daily compliance reviews, ideally automated, can reduce rule violations by over 65%.
For added precision, tools like the Consistency Rule Calculator can align your backtesting results with specific evaluation criteria. You can also explore reviews of firms such as Apex Trader Funding and Take Profit Trader to see how your position sizing strategy measures up against different evaluation standards.
Refining and Iterating Backtested Strategies
Using Backtest Results to Improve Performance
Backtesting isn’t a "set it and forget it" process. Professional traders treat it as an ongoing cycle of testing, refining, and validating strategies. In fact, statistics show that over 90% of backtested strategies fail in live trading, with only about 1 in 20 making it through rigorous validation processes.
The first step is to analyze core performance metrics to spot weak points. For instance, if your Profit Factor is below 1.2, transaction costs in live trading could quickly wipe out any potential gains. A simple stress test that inflates transaction costs can help determine whether your strategy is too fragile. Pay special attention to drawdowns and stagnation periods – these are critical for passing the evaluation stages of most proprietary trading firms.
To further validate your strategy, use Walk Forward Analysis to compare in-sample and out-of-sample performance. A Walk Forward Ratio below 0.3 is a red flag for overfitting. Monte Carlo simulations are another essential tool; they randomize trade sequences to estimate the likelihood of breaching a firm’s maximum drawdown limits.
Refinements should follow a structured approach: start with broad market regime filters, then incorporate seasonal patterns, and finally adjust individual indicator parameters.
Before taking your strategy live, use the "Shelf" Method to test it in real-time on a demo account. This step allows you to observe how your strategy performs in actual market conditions without risking real money.
"No matter how good your backtest is, the first contact with the real market always reveals differences."
– Ernest Chan, author of Algorithmic Trading
"Paper trading is not optional, it’s a requirement. If your strategy doesn’t survive two weeks in demo, it won’t survive in live trading."
– Andreas Clenow, quantitative fund manager
After refining your strategy using detailed performance metrics, the next challenge is ensuring it aligns with the specific rules and payout structures of proprietary trading firms.
Aligning Strategy with Prop Firm Goals
Once your strategy is fine-tuned, the next step is adapting it to real-world constraints. Start by hard-coding risk limits and consistency rules directly into your backtests. For example, many firms enforce daily loss limits of 4–5% and maximum trailing drawdowns of 10–12%. Incorporating these as built-in "kill switches" ensures your strategy halts trading when thresholds are breached.
Consistency rules are another critical factor. Firms like Apex Trader Funding and Take Profit Trader often require that no single trading day accounts for more than 30–50% of total profits. By analyzing your backtest’s profit distribution, you can confirm whether your edge is consistent or overly reliant on a single standout trade.
Scaling plans should also reflect the conditions of firm evaluations. For instance, Topstep limits the number of contracts traders can use based on their account equity. Your backtests should mirror these restrictions instead of assuming maximum position sizes from the outset. Divide your testing into "Evaluation" and "Funded" stages, applying specific profit targets required to pass the initial challenge phase.
Don’t overlook execution costs. These include exchange fees, commissions, and slippage, which can significantly impact net profitability. For example, professional futures data feeds can cost between $50 and $200 per month, while platform licenses for funded accounts often range from $600 to $1,200. Such expenses should be factored into every backtest iteration.
To ensure compliance with firm-specific evaluation criteria, tools like the Consistency Rule Calculator can be invaluable. Additionally, review firms like FundedNext Futures, Alpha Futures, and Tradeify to understand how different rule sets might affect your strategy. Finally, reserve 20–30% of your historical data for a "blind" test to confirm that your strategy isn’t just overfitted to past market noise.
Conclusion and Key Takeaways
Key Points for Effective Backtesting
Backtesting transforms trading from a guessing game into a disciplined, repeatable process. Did you know that 80% of traders who backtest their strategies report improved performance? Even more compelling, rigorous backtesting can cut trading risks by up to 50% by exposing flaws before any real money is on the line. Despite this, 80% of traders still fail within their first two years – often because they skip this essential step.
The most successful prop traders know that backtesting isn’t about predicting profits. It’s about managing risk and proving consistency. A solid strategy must hold up under different market conditions – bullish, bearish, and sideways – and meet the specific rules of prop firm evaluations. These include daily loss limits (3–5%), maximum drawdowns (8–10%), and consistency rules that cap single-day profits at 40–50% of your total. To avoid misleading results, aim for at least 100 to 200 trades in your backtest and validate your findings with walk-forward analysis to guard against overfitting.
"Backtesting is not ritual; it is risk control and learning."
– Goat Funded Trader
Before trading live, set a stop-trading limit at 80–90% of the firm’s daily loss cap to create a safety cushion. Make your backtest realistic by factoring in slippage, commissions, and running Monte Carlo simulations to estimate the likelihood of hitting drawdown limits. These steps lay the groundwork for scaling your strategy with the right prop firm.
Final Thoughts on Scaling with Prop Firms
Once you’ve built a solid foundation through backtesting, scaling with a prop firm means aligning your strategy with the firm’s evaluation model. Prop firms vary widely, offering structures like one-phase challenges or instant funding, each with its own rules that impact how you trade.
A well-tested strategy doesn’t just reduce risk – it also helps you select a prop firm that aligns with your trading goals. Websites like DamnPropFirms offer verified reviews, discounts, and tools to compare firms. For example, their Consistency Rule Calculator can help you verify if your profit distribution meets payout requirements before making a withdrawal request. Top-rated firms like Apex Trader Funding, Take Profit Trader, FundedNext Futures, Alpha Futures, and Topstep all offer unique scaling opportunities. Need faster access to capital? Instant funding options are available through firms like Tradeify and Lucid Trading.
Traders who scale successfully treat backtesting as a continuous process, not a one-and-done task. They refine strategies in demo accounts, adjust position sizes as they approach profit targets, and adapt based on live trading data. Backtesting is your roadmap, and the right prop firm provides the resources to bring it to life. Rule-based backtesting remains the cornerstone of long-term success in prop trading.
How I Backtest My 6 Figure Trading Strategies In 2026 (Step-by-step guide)
FAQs
How do I backtest a strategy with a trailing drawdown?
To backtest using a trailing drawdown, you’ll need to simulate how this rule adapts as your account’s peak equity changes. Start by tracking equity fluctuations, updating the drawdown limit whenever your equity hits a new high, and monitoring for any breaches of the limit.
For instance, if your account balance is $100,000 with a 5% trailing drawdown, your initial limit would be $95,000. As your equity grows, the drawdown threshold shifts upward accordingly. This process helps ensure your trading strategy aligns with the rule before you transition to live trading.
What’s the fastest way to check consistency-rule compliance in backtests?
The fastest way to check if your backtests comply with consistency rules is by using tools like the Consistency Calculator. These tools review your daily profits to confirm that your highest profit day falls within the firm’s allowed percentage of total profits. It’s a time-saver and helps you stick to prop firm requirements.
How many trades do I need before trusting a prop-firm backtest?
To build confidence in a prop firm’s backtest, aim for a sample size of 200 to 500 trades. This range helps capture performance across various market conditions, offering a solid dataset to evaluate how well your strategy holds up against market fluctuations.