Footprint charts give traders a detailed view of executed trades, showing where buying and selling pressures dominate at specific price levels. By identifying order flow imbalances – where aggressive buy or sell orders significantly outnumber the opposite side – you can spot areas of institutional activity with the best futures prop firms, key support/resistance levels, and potential price reversals. This approach focuses on stacked imbalances, delta analysis, and absorption zones to predict market behavior with precision.
Key Takeaways:
- Order Flow Imbalances: A 3:1 or 4:1 ratio between bid and ask volumes highlights aggressive buying or selling.
- Footprint Charts: Show executed trades at each price level, offering insights beyond traditional candlestick charts.
- Stacked Imbalances: Consecutive imbalances in one direction often indicate institutional activity and key price zones.
- Delta Metrics: Volume Delta tracks net buying/selling within candles; Cumulative Delta shows trends over a session.
- Reversals: Absorption and delta divergence signal potential trend changes when aggressive orders fail to push prices further.
The Importance Of Order Flow Imbalances In The Footprint Chart Using Orderflows Trader
sbb-itb-46ae61d
How to Identify Imbalances on Footprint Charts
Order Flow Imbalance Ratios and Trading Applications Guide
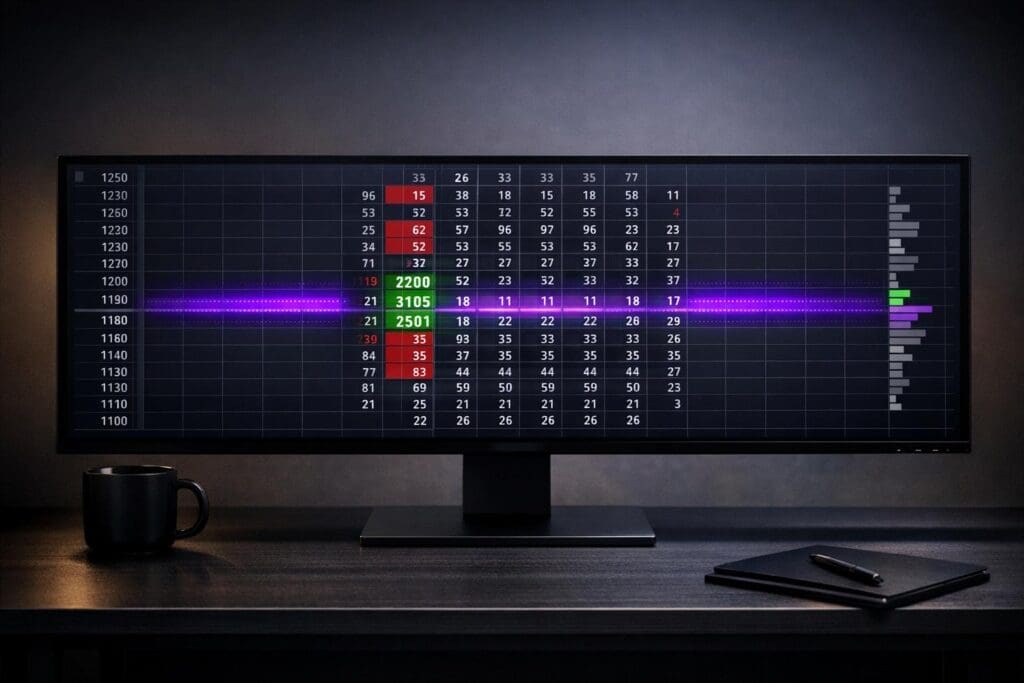
Footprint charts are a powerful tool for analyzing executed trades, and identifying imbalances is all about diagonal comparisons. To spot these imbalances, compare the ask volume at one price level with the bid volume directly below it.
"Imbalances are always compared diagonally between rows of prices on a footprint chart. They are not compared horizontally across the same row." – TradingLite
This approach highlights areas where institutional pressure builds, offering deeper insights into order flow. A buy imbalance happens when buyers lifting the offer outnumber sellers hitting the bid at the next price level down. Conversely, a sell imbalance occurs when sellers hitting the bid outnumber buyers lifting the offer one level up. Most trading platforms visually distinguish these imbalances: buy imbalances are typically shown on the right side of the candle (often in green), while sell imbalances appear on the left side (often in red).
Common Imbalance Patterns
One key pattern to watch for is the stacked imbalance – three or more consecutive price levels showing directional pressure within a single candle. These stacks often signal aggressive institutional activity and create zones where price may respond during future retests.
"Stacked imbalances are simply multiple imbalances spread across a few price increments in a tight range… Large buy imbalances will tend to act as support if price retraces back to test the level." – Adam, Founder, Jumpstart Trading
Scattered imbalances, on the other hand, are isolated and don’t form a stack. While they indicate localized pressure, they’re less impactful unless they occur at critical levels like the Point of Control or Value Area extremes. Another notable pattern is the finished auction, where a "0" appears at the extreme high (on the bid side) or low (on the ask side) of a candle. This often signals market exhaustion and a potential reversal.
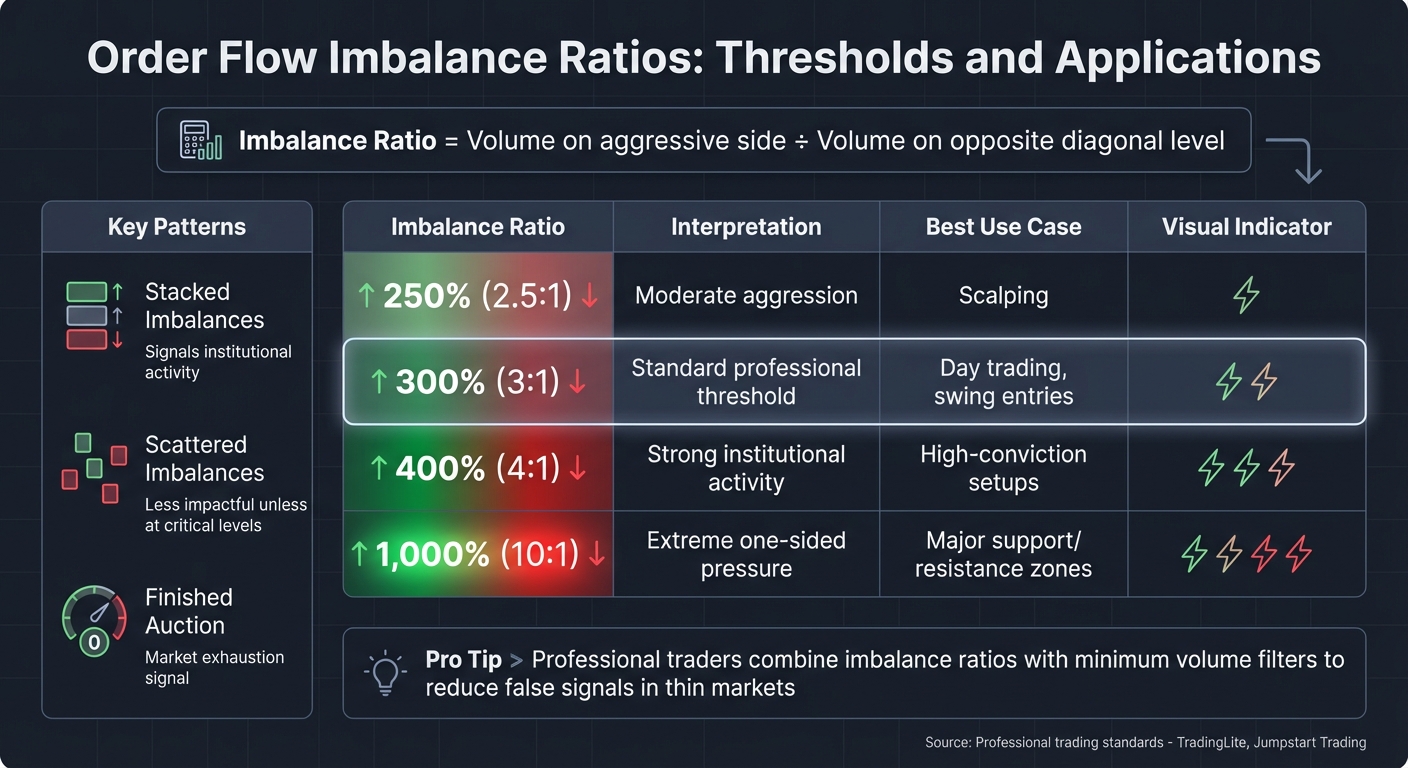
Imbalance Ratios and Thresholds
Traders using futures prop firm guides rely on imbalance ratios to filter significant activity. A 300% threshold (3:1 ratio) is commonly used, meaning the volume on one side must be at least three times greater than the opposing diagonal level. Some traders opt for a 400% (4:1) ratio for stronger signals, while others start at 250% (2.5:1) on platforms like TradingLite. Advanced platforms even allow for extreme configurations, such as 1,000% (10:1), to capture only the most intense order flow events. Many traders also apply a minimum volume filter to ensure the imbalance occurs at a price level with sufficient liquidity, reducing the risk of false signals in thin markets.
| Imbalance Ratio | Interpretation | Best Use Case |
|---|---|---|
| 250% (2.5:1) | Moderate aggression | Scalping |
| 300% (3:1) | Standard professional threshold | Day trading, swing entries |
| 400% (4:1) | Strong institutional activity | High-conviction setups |
| 1,000% (10:1) | Extreme one-sided pressure | Major support/resistance zones |
This structured approach helps traders zero in on price levels dominated by aggressive participants, leading to more informed and precise trading decisions.
Tools for Analyzing Order Flow
Footprint charts are powerful, but they work best when paired with other tools that provide a fuller picture of market activity. While footprints show where trades are executed, other tools can help you understand the pace of the market and the orders waiting to be filled.
Volume Delta and Cumulative Delta
Volume Delta tracks the net difference between aggressive buying and selling within a single candle. When buyers are more aggressive than sellers, the delta is positive. Conversely, when sellers dominate, the delta is negative. This metric resets with each new candle.
Cumulative Delta (CVD) takes this a step further by summing up delta values throughout the trading session. Instead of resetting, it builds a running total, helping traders identify whether buyers or sellers are consistently in control. For example, if price reaches a new high but the CVD shows a lower high, it could signal weakening buyer momentum or institutional absorption.
"Order flow trading reveals where large market orders are executed, letting you make decisions based on actual trading activity rather than theory." – Gleb Kabanov, Analyst and Managing Trader, LiteFinance
Pay attention to scenarios like a high positive delta at resistance levels without a price breakout. This could indicate that passive sellers are absorbing aggressive buy orders, often a precursor to a reversal. Similarly, high negative delta at a support level, with little price movement, suggests passive buyers are stepping in to counter selling pressure.
To deepen your analysis, combine delta insights with data from the Depth of Market (DOM) and Time & Sales tools.
Depth of Market (DOM) and Time & Sales
Footprint charts show what has already happened, but tools like the Depth of Market (DOM) and Time & Sales give you a glimpse into market intentions and momentum.
The Depth of Market (DOM) – also known as the order book or Level II – displays pending limit orders at various price levels. This tool highlights where traders are positioning themselves before trades are executed. It helps identify potential support and resistance zones, as well as "iceberg orders", where institutions break large orders into smaller chunks to mask their size.
Time & Sales, often referred to as "the tape", logs each completed trade, showing its price, size, and time. This provides a real-time view of market momentum. If trade executions start speeding up, it signals urgency and institutional interest.
"Footprints show WHEN (timing), Volume Profile shows WHERE (context), DOM shows WHO (live liquidity)." – Algostorm
Using these tools together can refine your trading strategies. For instance, if your footprint chart shows heavy volume but the DOM reveals a large resting order that refuses to break, it’s a sign of institutional absorption. Similarly, a breakout gains credibility if Time & Sales shows accelerating trade activity while the DOM confirms liquidity stacking behind the move.
When combined with footprint chart imbalances, these tools give you a more comprehensive understanding of the market. Together, they help you identify high-probability setups and make more informed trading decisions.
Using Imbalances to Predict Price Movement
Order flow imbalances can signal institutional activity and potential momentum shifts. Knowing how to spot and interpret these patterns gives traders an edge, allowing them to anticipate moves rather than just react to them.
Bullish and Bearish Momentum Signals
Once you’ve identified imbalances on footprint charts, the next step is understanding their directional significance.
Stacked imbalances are a standout indicator of institutional activity. When three or more consecutive price levels show buy imbalances (usually with a 3:1 or 4:1 ratio), it’s a strong signal that buyers are dominating sellers. This pattern often appears during breakouts, signaling that institutions are actively entering positions rather than merely testing levels.
For bullish momentum, watch for stacked buy imbalances combined with a noticeable increase in positive delta. On the flip side, stacked sell imbalances paired with rising negative delta suggest bearish momentum – sellers are in control, and downward pressure is mounting.
"Footprint charts are not magic. They’re a microscope revealing order flow mechanics. The edge comes from interpreting them at critical junctures." – AlgoStorm
Mark these stacked imbalance zones on your chart. These levels often act as key areas of support or resistance during pullbacks, offering high-probability entry points when the price revisits them. Confirm breakouts by looking for stacked imbalances accompanied by a surge in delta.
Momentum doesn’t always move as expected, though. When it shifts unexpectedly, reversal signals can provide valuable insights.
Reversal Signals and Contrarian Trades
Reversal signals build on the concept of stacked imbalances, highlighting moments when aggressive orders fail to push prices further – often a sign of a potential trend change.
Contrarian trades can be highly profitable when aggressive orders meet a wall of passive limit orders, a phenomenon known as absorption. On footprint charts, this looks like high volume and strong imbalances at a specific price level, but with little to no price movement. When significant effort fails to move the price, it often indicates a liquidity trap where institutions are defending a level, setting the stage for a sharp reversal.
Delta divergence is another key reversal indicator. For example, if the price makes a new high but cumulative delta shows a lower high or moves in the opposite direction, it signals that aggressive buyers are no longer supporting the move. Similarly, if the price sets a new low while delta strengthens or turns positive, it suggests seller exhaustion. Some professional traders use the "Absorption Fade" strategy – entering contrarian trades after spotting institutional absorption at key levels – with reported win rates as high as 75-80%.
Exhaustion signals differ slightly. These occur when the aggressive side begins to lose steam. On footprint charts, this appears as high volume at price extremes, followed by immediate rejection and declining volume and delta. Imbalances exceeding 70% in one direction, followed by a shift back toward balance, often indicate major turning points.
When trading these reversals, patience is key. Don’t act solely on exhaustion signals – wait for confirmation, such as failed follow-through on a retest of previous levels. The real edge lies in recognizing when market effort fails to deliver the expected outcome.
Tips for Trading with Footprint Charts
Footprint charts offer detailed insights into order flow, but their real value comes from filtering the data to uncover actionable signals.
Filtering Imbalances for Relevance
To cut through market noise, refine your analysis by applying volume and time filters, along with imbalance ratio thresholds.
For example, use a 3:1 or 4:1 ratio (300%–400%) between diagonal bid and ask volumes to highlight significant buying or selling aggression. Set a volume threshold tailored to your market. In the case of the S&P 500 E-mini (ES), a range of 50–200 contracts ensures you’re focusing on trades that involve meaningful capital, rather than small retail activity. Most platforms allow you to flag stacked imbalances – three or more consecutive price levels in one direction – which often signal institutional activity.
To increase the reliability of these signals, align imbalances with key structural levels like the Point of Control (POC), Value Area High/Low (VAH/VAL), or Volume Weighted Average Price (VWAP).
Spotting Institutional Activity
After setting your filters, the next step is interpreting imbalances to uncover market sentiment and institutional behavior.
Large imbalances on their own don’t tell the full story. Look for absorption, which occurs when high volume trades fail to move the price significantly. This can indicate institutional defense and may signal a potential reversal.
Another key clue is spotting iceberg orders. These appear when a price level shows consistent volume across multiple bars, but the price fails to break through. This pattern often reflects large institutional orders being split into smaller, visible chunks. Also, pay attention to delta divergence – when a new price high forms but the cumulative delta is weaker or even negative, it suggests institutional distribution rather than genuine buying strength.
For actionable trades, wait for pullbacks to stacked imbalance zones and confirm absorption before entering. A strong sign of institutional defense is a "delta flip", where the delta shifts direction, or a candle closing in the opposite direction, indicating the absorption phase has concluded.
Futures Prop Firms for Advanced Trading Tools
Building on the strategies used with footprint charts, advanced trading tools offered by futures prop firms take order flow analysis to the next level. These firms provide not only funded capital but also access to professional-grade tools, enabling traders to perform detailed footprint chart analysis without risking their own funds.
Top Futures Prop Firms for Order Flow Traders
The best futures prop firms provide access to funded accounts and tick-level data feeds like Rithmic, CQG, or dxFeed. These feeds are essential for precise footprint and delta analysis, offering centralized exchange data from markets such as the CME and Eurex for a clear view of futures markets.
- Apex Trader Funding: Supports platforms like NinjaTrader‘s Order Flow+ suite, which includes tools like volumetric bars, cumulative delta, and DOM tools.
- Take Profit Trader and FundedNext Futures: Compatible with platforms like Sierra Chart and ATAS, known for their in-depth footprint analysis features.
- Alpha Futures: Offers a 20% lifetime discount for prop firm traders.
- Topstep: Known for its comprehensive trader evaluation process.
For traders seeking immediate funding, Tradeify and Lucid Trading provide instant funding, allowing you to dive into order flow analysis without the delay of an evaluation period.
These firms and tools remove barriers of capital and technical limitations, enabling traders to confidently act on footprint chart signals. If you’re unsure which firm to choose, DamnPropFirms simplifies the decision-making process.
How DamnPropFirms Helps You Compare Prop Firms

Once you’ve identified potential prop firms, DamnPropFirms offers tools to refine your choice. Their platform allows for side-by-side comparisons and includes a Consistency Rule Calculator. This helps you evaluate firms not just on payout percentages, but also on factors like platform compatibility, data feed quality, and execution speed – critical elements when trading based on stacked imbalances or absorption zones.
DamnPropFirms provides verified reviews and comparisons of firms like Apex Trader Funding, Take Profit Trader, and FundedNext Futures. Their Consistency Rule Calculator ensures your order flow scalping strategy aligns with each firm’s risk management rules, which is especially important when making multiple trades per session based on delta divergence or absorption signals. Plus, with exclusive discounts and a supportive Discord community, you can confidently validate your choice before committing your time and resources.
Conclusion
We’ve delved into how footprint charts, delta analysis, and imbalance thresholds can shed light on institutional trading activity. Footprint charts, in particular, provide a unique perspective by displaying executed trades at every price level. This granular detail uncovers institutional behavior, such as absorption zones, stacked imbalances, and delta divergences – insights that traditional charts simply can’t offer. With this information, traders can identify precise entry and exit points.
"Footprint charts are not magic. They’re a microscope revealing order flow mechanics. The edge comes from interpreting them at critical junctures." – AlgoStorm
To maximize their utility, integrate these tools at crucial structural levels. For instance, Comparing Volume Profile vs Price Action highlights areas where major players are likely to act, while footprint charts confirm when those actions are happening. Using these tools together at session extremes or VWAP levels can create a strong trading advantage. Professional traders have reported success rates of 75–80% with strategies like "Absorption Fade" and 68–72% with "Imbalance Continuation" setups.
Key imbalance ratios, such as 3:1 or 4:1, consistently signal zones of institutional pressure. Additionally, tracking Delta and Cumulative Delta can sharpen your ability to predict reversals and momentum shifts. This helps pinpoint moments when aggressive market participation starts to wane, even as price pushes to new extremes.
FAQs
What’s the difference between a stacked imbalance and a scattered imbalance?
A stacked imbalance happens when buy or sell imbalances cluster around specific price levels. This often points to strong directional interest and potential momentum in the market. In contrast, a scattered imbalance is spread out across various levels, suggesting weaker directional pressure and potential market indecision. Understanding these patterns allows traders to gauge the intensity and durability of price movements.
How do I choose the best imbalance ratio (2.5:1 vs 3:1 vs 4:1) for my trading style?
When choosing an imbalance ratio, such as 2.5:1, 3:1, or 4:1, your decision should align with your risk tolerance and how sensitive you want to be to order flow. A lower ratio like 2.5:1 tends to pick up smaller imbalances, offering more frequent signals. On the other hand, higher ratios like 3:1 or 4:1 filter out minor fluctuations, focusing on stronger, more defined signals. It’s a good idea to test these ratios in a demo environment to see which one fits your trading style and goals best.
How can I confirm absorption or a delta divergence before taking a reversal trade?
To identify absorption, watch for situations where large buy or sell orders are met with equally strong opposing orders, resulting in minimal price movement. This often suggests that major players are exerting control at critical price levels.
For delta divergence, focus on discrepancies between delta (the difference between buying and selling volume) and price movement. For example, if delta is decreasing while prices are climbing, it could hint at a weakening trend or potential reversal.
To enhance precision and cut down on false signals, combine footprint charts with tools like volume profiles. These can provide a more detailed view of market activity, helping you confirm patterns and make better trading decisions.