Support and resistance zones are key tools for futures traders. They represent price areas where markets often reverse or pause due to collective buying or selling activity. Support acts as a "floor" where demand prevents further price drops, while resistance serves as a "ceiling" where selling pressure halts price increases. These levels aren’t fixed points but zones influenced by market psychology, trading volume, and historical price action.
Key Takeaways:
- Support: Price areas where buying interest halts declines.
- Resistance: Price areas where selling interest caps gains.
- Zones, Not Lines: Treat them as ranges (e.g., 5–10 points for S&P 500 futures).
- Market Psychology: Trader behavior, such as fear and greed, reinforces these levels.
- Volume and Tools: High trading activity, moving averages, and VWAP help identify strong zones.
- Dynamic Levels: Trendlines or moving averages adapt to market trends.
By understanding these zones, traders can make informed decisions, manage risk with stop-loss orders, and identify high-probability trade setups. Use tools like volume profiles, Fibonacci retracements, or moving averages to confirm levels, and always wait for clear signals before acting.
How Support and Resistance Levels Form
Main Factors Behind Level Formation
Support and resistance levels emerge from consistent market patterns. Prior swing highs and lows are some of the clearest indicators. When prices make sharp reversals at a specific point, that area becomes memorable for traders. A level’s importance grows when prices bounce or stall near the same spot multiple times – each test reinforces its significance as more traders recognize the pattern and act accordingly.
The polarity principle also plays a big role. When resistance is broken, it often turns into new support, and vice versa. This happens because traders who were caught in losing positions tend to wait for prices to return to their breakeven point. When that happens, their exit orders create buying or selling pressure, helping to solidify the level.
In futures markets, volume concentration is another factor. Areas with high trading activity, such as High Volume Nodes (HVNs) and the Point of Control (POC), often become key levels. These are prices where buyers and sellers previously agreed on value, making them natural zones for future market reactions in highly liquid futures contracts.
In trending markets, dynamic indicators like the 50-day or 200-day Simple Moving Average (SMA), VWAP, and trendlines serve as moving support or resistance levels that adjust with price changes. The 200-day SMA is especially noteworthy – it’s often referred to as the "institutional line in the sand", where major market participants tend to defend their positions. Beyond these technical tools, the psychology of traders plays a critical role in shaping these levels.
Market Psychology and Level Formation
At its core, support and resistance are driven by collective human behavior. Price memory explains why levels created during significant market events continue to influence future price action. Traders naturally anchor their decisions to these historical reference points. This creates a kind of self-fulfilling cycle: because so many traders focus on these levels, their actions ensure the levels remain relevant.
"Support and resistance levels work due to their representation of collective decision-making. They’re the fingerprints of market psychology." – Bruce Powers, CMT
Fear of loss is a key driver of resistance. Traders who bought at a past high and then saw prices drop often sell as soon as prices return to their entry point, eager to avoid further losses. This collective relief creates the selling pressure that forms resistance levels. On the other hand, greed and regret fuel support. Traders who missed out on buying at a previous low tend to jump in if prices revisit that level, creating the demand that establishes support.
In futures markets, institutional anchoring amplifies these psychological effects. Large institutions often place significant limit orders at round numbers like $50, $75, or $100, as well as at previous swing levels. These clusters of orders act as barriers, absorbing supply or demand and creating visible levels on charts that retail traders can easily spot and react to. The combination of human attention and algorithmic activity at these psychological levels makes them especially dependable in futures trading.
Understanding how these levels form is essential for identifying them effectively in trading scenarios. This skill is particularly valuable when evaluating the best futures prop firms to find the right trading environment.
sbb-itb-46ae61d
Support & Resistance Explained
How to Identify Support and Resistance Levels
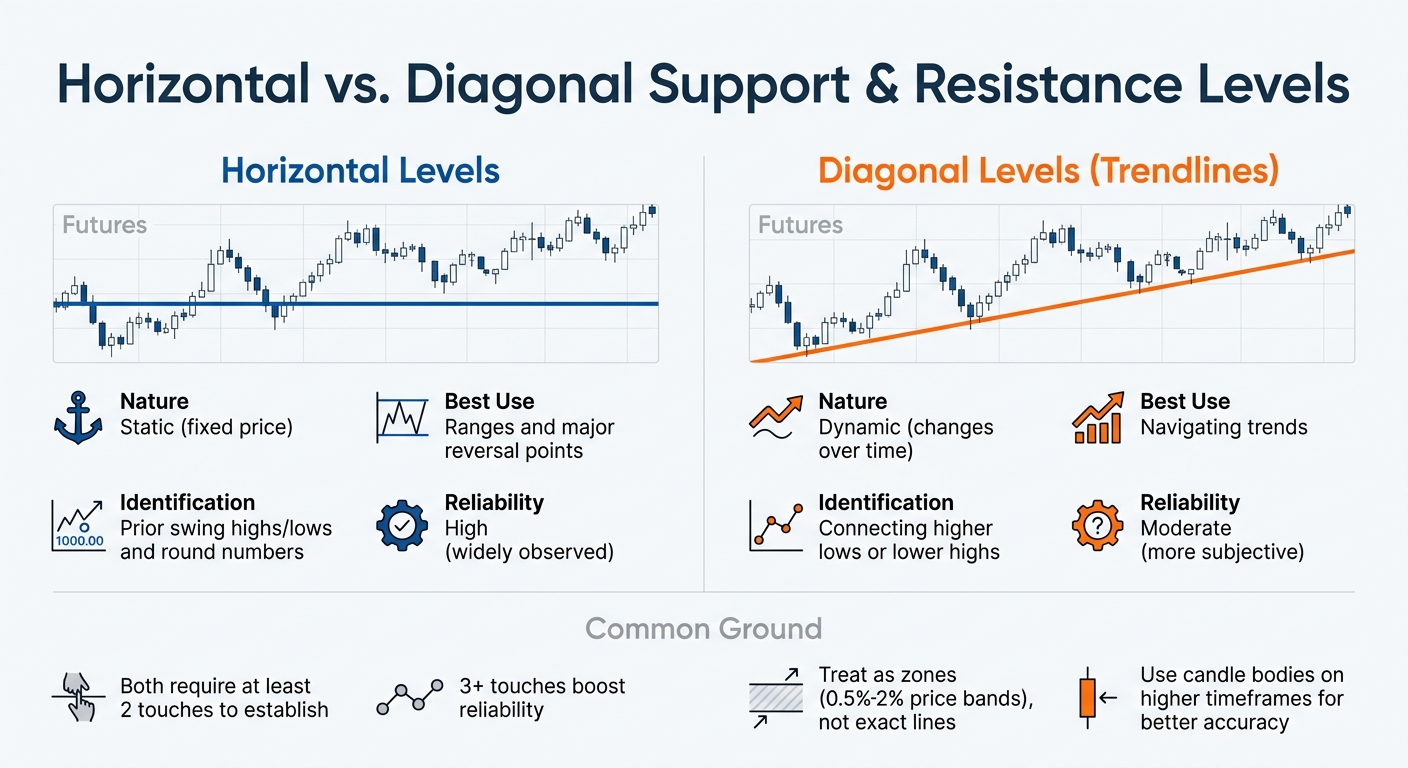
Horizontal vs Diagonal Support and Resistance Levels Comparison for Futures Trading
Using Past Price Data
Support and resistance levels often emerge at past price reversal points. Resistance forms where selling pressure previously outweighed buying interest, often at prior swing highs. On the flip side, support appears at swing lows, where buying interest halted a decline. The stronger the price movement following a reversal, the more relevant that level becomes for future trading decisions.
To pinpoint these levels, start with weekly or daily charts to identify major zones, then zoom into shorter timeframes to refine your analysis. This approach helps filter out the noise from intraday fluctuations. When marking levels, focus on the candle bodies instead of the wicks, as closing prices reflect the consensus value traders agreed upon.
Psychological round numbers, like ES 5,000, CL $80.00, or GC $2,000, often act as natural barriers. These levels attract institutional traders, often found at the top futures prop firms, who cluster their limit orders around clean, whole figures. Another concept to watch for is the polarity principle – when resistance is broken, it often becomes new support upon retesting.
"Support and resistance levels are not magical lines drawn by a software algorithm. They are price points where a significant number of buyers or sellers previously made decisions – and will likely make decisions again when price returns."
Reliability increases when a level is touched multiple times – aim for at least 2–3 touches before considering it tradeable. For futures traders, think of these levels as zones rather than precise lines. Typical zones might span 5–10 points for ES, $0.50–$1.00 for CL, or $8–$12 for GC. To avoid being stopped out by temporary spikes, consider placing stop-losses 0.5 to 1.0 ATR (Average True Range) beyond the identified zone.
Finally, combine these observations with technical tools to confirm and refine your levels.
Technical Tools for Level Identification
Several technical tools can help validate and sharpen your analysis of support and resistance levels. Moving averages, particularly the 50-day, 100-day, and 200-day SMAs, are widely monitored. The 200-day SMA, often called the "institutional line in the sand", is especially significant. For intraday trading, the Volume Weighted Average Price (VWAP) offers a dynamic way to track support and resistance by factoring in both price and volume.
Volume Profile is another useful tool, highlighting High Volume Nodes (HVNs) and the Point of Control (POC), where trading activity was heaviest. Fibonacci retracements at 38.2%, 50%, and 61.8%, along with Pivot Points calculated from the prior session’s high, low, and close, can also serve as effective markers.
The best trading opportunities often arise when multiple tools align in the same price zone – a concept known as confluence. For example, a prior swing low that aligns with the 200-day SMA and a high-volume node can form a particularly strong support zone. Advanced traders might add order flow tools like Footprint Charts, Depth of Market, or Time & Sales to their analysis. Platforms like Optimus Flow offer these tools and can uncover institutional activity like iceberg orders.
"Treat all levels as potential failures until they’ve been confirmed."
- Bruce Powers, Author and CMT
Avoid trading levels blindly. Look for confirmation signals such as rejection candles, engulfing patterns, or volume spikes to determine whether a level is holding or breaking. Keep your charts clean by focusing on 3–5 key levels where you’re prepared to commit capital. As Bruce Powers puts it, "If you have to squint, it’s probably not a meaningful level."
Once you’ve confirmed your levels, decide whether to focus on horizontal or diagonal markers, depending on the market environment.
Horizontal vs. Diagonal Levels
Horizontal levels are static markers derived from past swing highs or lows, offering consistent signals for reversals. Diagonal levels, or trendlines, are dynamic and change over time. These are drawn by connecting ascending swing lows for support or descending swing highs for resistance.
Both types require at least two touches to establish, with three or more touches boosting their reliability. Horizontal levels are especially effective in range-bound markets, while diagonal levels are more useful in trending environments. Horizontal levels tend to be more objective and widely recognized, whereas trendlines involve a degree of subjectivity.
| Feature | Horizontal Levels | Diagonal Levels (Trendlines) |
|---|---|---|
| Nature | Static (fixed price) | Dynamic (changes over time) |
| Best Use | Ranges and major reversal points | Navigating trends |
| Identification | Prior swing highs/lows and round numbers | Connecting higher lows or lower highs |
| Reliability | High (widely observed) | Moderate (more subjective) |
Whether you’re working with horizontal or diagonal levels, think of them as zones rather than exact price points. Drawing a price band – typically 0.5% to 2% of the asset’s price – can better capture areas where buyers and sellers are likely to gather. On higher timeframes, using candle bodies instead of wicks often provides more reliable structural levels. Start your analysis on a weekly or monthly chart, then zoom in to shorter timeframes for trade execution.
Using Support and Resistance in Your Trading Strategy
Entry and Exit Strategies
A simple yet effective principle: buy near support and sell near resistance. When entering a long position at a support level, watch for rejection signals like long lower wicks or bullish engulfing patterns before committing your capital. To protect your trade, place your stop-loss 0.5–1.0 ATR (Average True Range) beyond the zone instead of directly on the level. This approach minimizes the risk of getting caught in "stop runs" where the price briefly dips to trigger stop-loss orders before reversing direction.
For short positions at resistance, apply the same logic. Resistance often forms around previous swing highs or round numbers (e.g., ES 5,000 or CL $80.00). When resistance breaks, it often flips into support during a retest, creating a strong role-reversal opportunity. This zone-based strategy ties back to the psychological dynamics of the market.
Managing risk is just as important as finding the right entry. Many traders scale out of their positions in stages. For example:
- Exit 50% of your position at the first minor resistance.
- Take another 30% off at a major structure.
- Leave the remaining 20% as a "runner" with a trailing stop.
Professional traders also aim for a minimum 1:2 risk-reward ratio when trading these levels.
"Do not place stops directly on the level… This avoids ‘stop runs’ where price pierces the level to grab liquidity before reversing."
Combining Support and Resistance with Other Indicators
To strengthen your trading signals, combine support and resistance with other indicators. High-probability setups often emerge when multiple independent factors align at the same price – a concept called confluence. For instance, a support level that coincides with the 200-day SMA and a Volume Profile High Volume Node (HVN) forms a much stronger zone than any one of these factors alone.
Here’s how to enhance your strategy:
- Volume Profile: High Volume Nodes (HVNs) indicate areas of value acceptance, acting as support or resistance. Low Volume Nodes (LVNs), on the other hand, suggest areas where price may move quickly.
- Moving Averages: Dynamic indicators like the 200-day SMA adjust with price and are often seen as key levels, sometimes referred to as the "institutional line in the sand".
- VWAP (Volume Weighted Average Price): Particularly useful for intraday futures trading, VWAP helps identify fair value levels.
- Order Flow Tools: Tools like Footprint charts, Depth of Market (DOM), and Time & Sales can reveal hidden orders or absorption at key levels, providing further confirmation of support or resistance strength.
Focus on levels visible on higher timeframes, such as Daily or Weekly charts, as these tend to carry more weight than intraday levels.
Trading Breakouts and Breakdowns
Trading breakouts and breakdowns requires patience and confirmation. A breakout occurs when the price closes above resistance, while a breakdown happens when it closes below support. To avoid false signals, wait for a full candle close beyond the level rather than trading on a mid-candle move.
Volume is a critical confirmation tool here – look for breakout volume that’s at least 50% above average. After a breakout, the price often pulls back to retest the broken level before continuing its new trend. This retest can offer a safer, more conservative entry point compared to the initial breakout move.
Profit targets can be set by measuring the range of the prior consolidation and projecting it from the breakout point. In futures markets, the first 30 minutes of the trading session are especially important – the high and low of this opening range frequently act as key support and resistance levels throughout the day.
"A breakout (up or down) requires confirmation of strength or weakness. It’s the behavior of price at or near the level that gives real clues."
- Bruce Powers, CMT, FX Empire
False breakouts are a common challenge, especially in leveraged markets, such as those detailed in our futures prop firm reviews. These occur when the price briefly moves beyond a level but then closes back within the range. To reduce the risk of falling for false signals, combine your support and resistance analysis with volume and momentum indicators. Always treat these levels as zones, not precise lines.
Common Problems with Support and Resistance
Why Levels Break
Some levels fail because they lack structural acceptance – essentially, the market didn’t settle on those prices as fair value. This often happens when levels form during periods of thin volume or unbalanced moves. When price revisits these weak levels, it tends to break through quickly.
Another reason is order consumption. Each time a level is tested, the resting buy or sell orders that support it get filled and removed from the order book. A level that’s been tested five or six times is usually weaker than one tested only once or twice because the defending liquidity diminishes with every test.
Then there’s the impact of institutional liquidity sweeps, where large players intentionally target areas like "equal highs" or "equal lows" where retail traders often cluster their stop-loss orders. They drive the price past these levels to trigger those stops, filling their own positions before reversing the market direction. This is why placing stops directly at a support or resistance level often results in getting stopped out just before the market moves in your favor. It underscores the idea that support and resistance are better understood as zones rather than precise lines.
Major news or economic events can also make historical levels irrelevant. For example, on November 6, 2024, following the US election, TSLA surged past its $248–$250 resistance zone to close at $288.53, with triple the prior day’s volume. This illustrates how event-driven momentum can obliterate resistance in a single move. When momentum is high, with long candles and heavy volume, resting orders simply can’t hold up.
Recognizing these vulnerabilities helps traders focus on avoiding false signals.
How to Reduce False Signals
To minimize false signals, consider waiting for a full candle close before acting. Intraday wicks that pierce a level can be deceptive, so look for a decisive candle body close beyond the zone before entering a trade. A good example is NVDA on December 30, 2024. The stock briefly dipped to $133.98, piercing its $134–$135 support zone, but recovered to close at $137.44. Because the session closed above $134, the support held, showing how wicks can create misleading breakdown signals.
Think of support and resistance as zones, not lines. For instance, In day trading futures markets, these zones might range from 5–10 points for ES (S&P 500), $0.50–in futures markets, these zones might range from 5–10 points for ES (S&P 500), $0.50–$1.00 for CL (Crude Oil), or $8–$12 for GC (Gold).00 for CL (Crude Oil), or $8–in futures markets, these zones might range from 5–10 points for ES (S&P 500), $0.50–$1.00 for CL (Crude Oil), or $8–$12 for GC (Gold)2 for GC (Gold). Using zones helps account for market noise and reduces the chances of premature stop-outs. To further protect yourself, place stop-losses 0.5 to 1.0 ATR (Average True Range) beyond the zone to avoid being shaken out by normal market volatility.
Volume confirmation is another key factor. A breakout is more reliable when the candle closes beyond the level on at least 1.5× the average volume. Without this, the breakout might be a false signal. Also, focus on levels formed within the last 20–40 trading sessions, as they tend to carry more weight due to fresher positions being tied to them.
Finally, tools like order flow analysis can be incredibly useful. Look for signs of absorption, where heavy volume occurs without significant price movement. This suggests that institutional players are defending the zone, increasing the likelihood it will hold. On the flip side, if you observe "delta expansion without price rejection" (strong buying or selling with no bounce), the level is likely about to fail.
"A price level becomes meaningful only when the market has worked there."
Using DamnPropFirms to Improve Your Futures Trading
Combining a solid support and resistance strategy with the right prop firm conditions can help you make the most of key trading levels.
Finding the Right Futures Prop Firm
When trading support and resistance, having account conditions that allow for wider stop-loss buffers – typically 0.5 to 1.0 ATR beyond your zone – is critical to avoid triggering tight daily loss limits. DamnPropFirms simplifies the search by providing verified reviews and rankings of futures prop firms tailored to these needs.
For instance, Apex Trader Funding uses end-of-day drawdown calculations, which let traders hold positions during intraday volatility, especially near key support levels. On the other hand, Tradeify offers "Select" plans with no consistency rules, making it a great choice for those who prefer fewer, high-probability setups.
Tools and Resources for Traders
DamnPropFirms provides a variety of free tools to enhance your support and resistance trading strategies.
- The Consistency Rule Calculator helps ensure your breakout profits stay within a firm’s profit-sharing limits.
- Custom TradingView indicators assist in identifying profit targets at key levels.
- The Tradesyncer Trade Copier allows you to execute a single setup across multiple funded accounts simultaneously, supporting firms like Take Profit Trader and FundedNext Futures.
Additionally, the Damn Good Trading Discord community, with over 3,000 traders and $500K in verified payouts, provides real-time updates on which firms are honoring payouts for technical strategies. You can also access exclusive discount codes (use DGT to save 10–90% on evaluations). These resources are designed to align prop firm requirements with your technical strategies, ensuring smoother execution.
Staying Current with Prop Firm Updates
Market conditions and prop firm rules are constantly evolving, which can directly impact how you apply support and resistance strategies. For example, a firm shifting from trailing to end-of-day drawdown calculations can influence how long you hold positions during a support retest.
DamnPropFirms monitors these updates in real time, including recent changes from Apex Trader Funding and other leading firms, keeping you informed. Before trading major breakout setups, check the site’s latest updates to see if new rules, like Consistency or MAE adjustments, could affect your funding calculations. Firms like Lucid Trading offer quick one-day evaluations for faster payouts, while Topstep and Alpha Futures feature unique rule structures that might better suit your approach.
Conclusion
Main Takeaways
Support and resistance are more than just static lines on a chart – they represent areas where traders collectively influence market direction. As Bruce Powers, CMT, explains, these zones reflect market psychology at work. Successful traders interpret these areas as flexible zones rather than pinpoint prices.
The most reliable setups occur when multiple factors come together. For instance, when a horizontal level aligns with a moving average, Fibonacci retracement, or high-volume node, the resulting confluence often strengthens the signal. Additionally, when resistance is broken, it often transforms into support (and vice versa), creating excellent opportunities for retest entries as the market shifts direction.
Volume confirmation is crucial for validating breakouts. To manage risk effectively, experienced traders typically set stop-loss orders 0.5–1.0 ATR beyond these zones to account for normal market fluctuations. They aim for a risk-reward ratio of at least 1:2 at major levels, taking partial profits at minor resistance points while letting the remainder ride for larger moves.
Armed with these insights, you can refine your trading strategy and take actionable steps toward improvement.
Next Steps for Futures Traders
To apply these concepts, start by marking key levels on your charts, such as the previous day’s highs, lows, and closes – these often act as critical inflection points for the next trading session. Use Daily or Weekly charts to identify broader zones, then fine-tune your entries on shorter timeframes like 15- or 5-minute charts to stay aligned with the larger trend.
Before committing real capital, consider using platforms like DamnPropFirms to find a futures prop firm that complements your trading approach. For example, Apex Trader Funding offers end-of-day drawdown calculations, helping you manage intraday volatility at critical levels. Similarly, Tradeify caters to traders focusing on fewer but higher-probability setups. Their tools, including the Consistency Rule Calculator and TradingView indicators, can help you align your breakout profits with firm guidelines.
FAQs
How do I choose the right support/resistance zone size for my futures market?
When figuring out the right size for support and resistance zones in futures trading, start by looking at areas where the price often reverses or stalls. These zones typically align with previous swing highs and lows or spots where the price has reacted multiple times.
The size of the zone should match your trading timeframe and account for market volatility. It needs to be wide enough to include key price activity but not so wide that it loses focus. Zones that have been tested several times tend to be more dependable, so give those higher priority when planning your trades.
What’s the best way to confirm a breakout before entering a trade?
To identify a breakout with confidence, pay attention to volume surges, as these highlight strong market interest. Additionally, examine price action for candlestick patterns or technical indicators that signal true momentum. This approach helps separate authentic breakouts from misleading ones.
How can I set stop-losses beyond a level without violating prop firm drawdown rules?
To place stop-losses effectively without breaking drawdown rules, it’s crucial to handle your risk per trade with precision. Start by setting a clear risk limit that aligns with your account size and the firm’s drawdown restrictions. From there, calculate the appropriate position size to match this risk limit.
When determining stop-loss levels, factor in market volatility to keep potential losses within acceptable boundaries. Make it a habit to monitor your equity and drawdown frequently to ensure you remain within the firm’s guidelines. This disciplined approach helps you stay compliant while navigating market fluctuations.