While often compared to Volume Profile vs Price Action, this charting tool highlights trading activity at specific price levels, offering insights into market behavior. It identifies key areas like the Point of Control (POC) (price level with the most trading volume) and the Value Area (VA) (range where 70% of volume occurs). These insights can help traders spot support, resistance, and momentum zones.
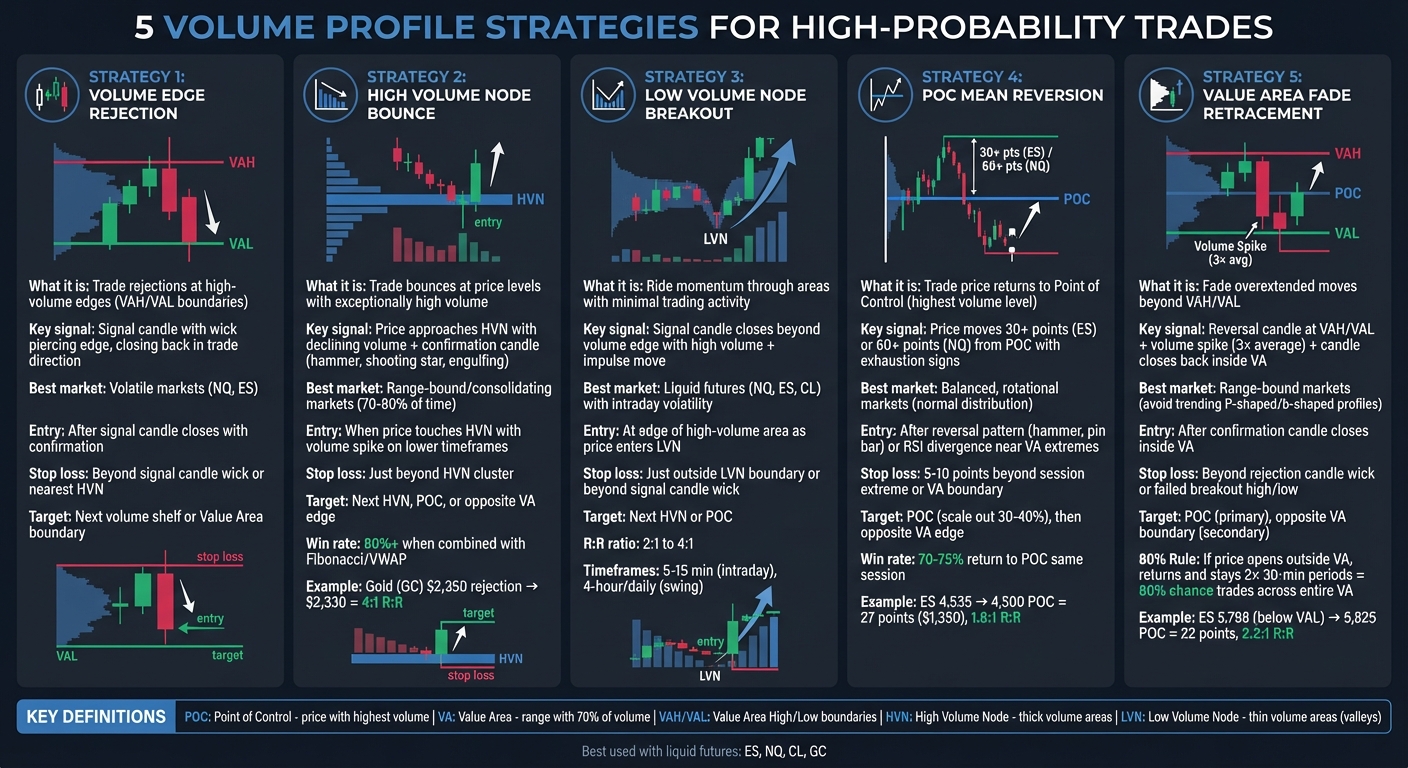
Here are five practical strategies to use Volume Profile effectively:
- Volume Edge Rejection: Trade rejections at high-volume edges with confirmation candles.
- High Volume Node (HVN) Bounce: Use HVNs as support or resistance zones in range-bound markets.
- Low Volume Node (LVN) Breakout: Target quick momentum moves through low-volume areas.
- POC Mean Reversion: Trade price movements back to the POC in balanced markets.
- Value Area Fade Retracement: Fade overextended moves beyond the Value Area for retracements.
These strategies are especially useful in futures markets like the S&P 500 (ES) and Nasdaq 100 (NQ). Combining Volume Profile with tools like VWAP or Fibonacci levels can improve accuracy and risk management. Practice using these setups on demo accounts before trading live, and consider funded accounts from prop firms to reduce personal risk.
5 Volume Profile Trading Strategies Comparison Chart
Top 3 VOLUME PROFILE Strategies & 📈 Real Results Included
sbb-itb-46ae61d
1. Volume Edge Rejection with Signal Candle Confirmation
A volume edge – sometimes referred to as a "volume shelf" or "ledge" – is where a high-volume area sharply transitions into a low-volume zone. These edges often form at the Value Area High (VAH) and Value Area Low (VAL), which are the boundaries encompassing 70% of trading volume. These levels tend to act as natural barriers because they reflect the points where buyers and sellers reached an agreement.
The strategy revolves around waiting for a signal candle to confirm the rejection at the volume edge. This candle should have a wick that pierces through the volume edge but closes back in the direction of the intended trade. High volume on this candle adds further credibility to the setup. Forrest Knight from ChartFanatics emphasizes the importance of patience in this process:
"A high volume signal candle forms with a visible wick rejecting the area and closing in the trade direction. Always wait for the signal candle to close. Do not front-run it."
This confirmation serves as the green light for executing a trade.
Take, for instance, a trade on Nasdaq 100 futures (NQ) in May 2022. The price moved into the Prior Day High (PDH) and touched the edge of an upper volume shelf. A 1-hour candle swept above the PDH but closed back below it, leaving a long upper wick and showing high volume. A short position was opened at the candle close, with a stop-loss placed above the wick high. The price then declined throughout the session, eventually reaching the Overnight Low (ONL), which coincided with a lower volume shelf.
For effective trade management, place your stop-loss just beyond the signal candle’s wick or the nearest high-volume node. Set your profit targets at the next volume shelf or Value Area boundary. In highly volatile markets like the Nasdaq, if the signal candle has an unusually long wick, consider using a limit order at a 50–80% retracement of the wick to secure a better entry point.
The best setups occur when volume edges align with critical daily levels, such as PDH/PDL (Prior Day High/Low) or ONH/ONL (Overnight High/Low). This alignment adds a layer of confidence to the trade, as it increases the likelihood that the rejection will hold.
2. High Volume Node Bounce Trades
HVN bounce trades build on rejection setups by focusing on price levels where trading activity is exceptionally high. A High Volume Node (HVN) is a price point marked by significant trading volume, often displayed as thick horizontal bars on a volume profile chart. These levels represent areas where buyers and sellers have reached an agreement on price, often leading to market slowdowns or consolidation .
When the price moves above an HVN, it tends to act as support, while below it, the HVN typically serves as resistance. As Adam from Jumpstart Trading puts it:
"High volume nodes act like gravity. They tend to attract price and try to hold it there".
This "gravitational pull" makes HVNs reliable for bounce setups. When combined with tools like Fibonacci levels or VWAP, the probability of the HVN holding can surpass 80%.
HVN bounce trades are most effective in consolidating or range-bound markets, where prices oscillate between well-defined value extremes. Since markets spend roughly 70% to 80% of their time in these compression phases, this strategy can be applied frequently. Ideal trade entries occur when the price approaches the HVN with declining volume and forms a clear confirmation candle, such as a hammer, shooting star, or engulfing pattern . Additionally, a volume spike on lower timeframes (e.g., 1-minute or 5-minute charts) as the price touches the HVN can signal institutional activity and strengthen the trade setup .
For risk management, place your stop-loss just beyond the HVN cluster or volume shelf to avoid getting stopped out by minor fluctuations . Profit targets can be set at the next HVN, the Point of Control (POC), or the opposite edge of the Value Area . For instance, in May 2025, Gold Futures (GC) consolidated near a major HVN at $2,350. After a CPI report, the price briefly broke above this level before reversing sharply:
Traders who identified the rejection at that HVN and shorted the retest captured a move back to $2,330, achieving a 4:1 reward-to-risk ratio.
This approach works particularly well with highly liquid futures markets like the S&P 500 E-mini (ES), Nasdaq 100 (NQ), Crude Oil (CL), and Gold (GC) . The key is patience – wait for volume to decline or a clear support candle to form before entering a position .
3. Low Volume Node Breakout Momentum
Low Volume Nodes (LVNs) offer a unique opportunity for breakout momentum by allowing price to move quickly through areas with minimal trading activity. This builds on the concept of High Volume Nodes (HVNs), which tend to slow price movement due to their "magnet-like" effect.
LVNs, on the other hand, are zones with sparse trading activity, creating noticeable "valleys" in the volume histogram. These areas lack significant order flow, meaning there’s little resistance to price movement. As Adam, Founder of Jumpstart Trading, puts it:
"Low Volume Nodes are areas with low gravity. The market often bounces right over these levels, not staying for long because there’s not much gravitational pull."
This behavior makes LVNs a prime setup for momentum-based breakout strategies.
To execute this strategy, enter at the edge of a high-volume area and ride the momentum as price moves through the LVN. These zones represent inefficiencies in the market – places where institutional traders found little value – making them ideal for quick, directional price moves. Look for a signal candle that closes beyond the volume edge with high trading volume, as this confirms the breakout.
For added confidence, watch for an increase in volume or an impulse move as price enters the LVN. Tools like Cumulative Delta can help confirm whether aggressive buyers or sellers are driving the movement. VWAP is another useful tool to check if the price is trading above or below the day’s fair value. Place your stop-loss just outside the LVN boundary or beyond the wick of the signal candle; if the price returns to the high-volume area, the breakout is invalidated. As the price moves in your favor, trail your stop-loss aggressively to lock in profits.
Set profit targets at the next High Volume Node (HVN) or Point of Control (POC), as these zones often act as magnets where price tends to pause. Many traders aim for a reward-to-risk ratio of 2:1 to 4:1 with LVN setups, taking advantage of the "vacuum" effect for larger profit potential while keeping stops tight at the volume edge.
This approach is particularly effective with liquid futures contracts like the Nasdaq 100 (NQ), S&P 500 E-mini (ES), and Crude Oil (CL), where intraday volatility frequently creates LVN opportunities. For intraday day trading breakouts, use 5- or 15-minute profiles, while 4-hour and daily profiles work well for swing trades to find significant LVN gaps.
4. Point of Control Mean Reversion
The Point of Control (POC) is a key concept in volume profile analysis, marking the price level where the highest trading volume occurred during a specific period. Think of it as the "fair value" where buyers and sellers reached the greatest level of agreement. According to marketprofile.info:
"The POC represents the price where the most participants agreed to transact… this makes POC the most reliable reference point because it has the strongest market consensus."
In many cases, when prices deviate significantly from the POC, they tend to revert back to it. Studies suggest that prices return to the POC about 70–75% of the time during the same trading session.
This strategy is particularly effective in balanced, rotational markets – conditions where prices fluctuate around a central value rather than trending strongly in one direction. To identify such setups, look for normal distribution patterns on your volume charts, which signal stable market conditions. For example, in ES futures, wait for prices to move 30+ points away from the POC, or 60+ points for NQ futures , a common target for traders in the Topstep evaluation, before considering a trade. Timing is critical – don’t rush into trades. Instead, look for signs of exhaustion, such as decreasing volume, reversal candlestick patterns (like hammers or pin bars), or RSI divergence near the Value Area extremes. This approach ties trades to areas of market consensus, making it a solid addition to other volume profile strategies.
Here’s a real-world example: On January 30, 2026, an ES futures trader using a funded account identified a stable POC of 4,500 at 10:00 AM. By 11:15 AM, the price had rallied to 4,535 (35 points above the POC) but showed signs of exhaustion, including a large doji candle and declining volume. The trader entered a short position at 4,527 after confirming a reversal toward the POC, with a stop-loss set at 4,542. By 12:35 PM, the price returned to the 4,500 POC, delivering a 27-point profit ($1,350 per contract) with a reward-to-risk ratio of 1.8:1.
When using this strategy, place your stop-loss 5–10 points beyond the session’s extreme or the Value Area boundary. Aim for the POC as your primary target – consider scaling out 30–40% of your position there and holding the rest for a potential move to the opposite Value Area edge. Pay close attention to "Virgin POCs" (POC levels from prior sessions that have not been revisited), as these often act as strong price magnets in future trading sessions.
5. Value Area Fade Retracement
The Value Area Fade Retracement strategy builds on earlier reversal methods by targeting overextended moves, offering opportunities for counter-trend trades with a strong probability of success.
The Value Area (VA) represents the price range where 70% of trading volume occurs. When prices move beyond the Value Area High (VAH) or Value Area Low (VAL), they are considered overextended or at an "unfair value". These moments provide a chance to fade the move and profit as prices retrace toward a balanced range.
The key to this strategy is recognizing when the market rejects these overextended levels. Look for a reversal candlestick pattern – such as a hammer, shooting star, or engulfing candle – at the VAH or VAL, accompanied by a spike in volume (at least 3× the average volume). A confirmation occurs when a candle closes back inside the Value Area, signaling that the market is likely to return to balance.
Here’s an example: Suppose the Topstep ES Futures market opens at 5,820, rallies to 5,860, and then dips 2 points below the VAL at 5,800. A bullish hammer forms at 5,798 with 3× the volume, followed by a candle closing back within the Value Area. This sets up an entry at 5,803 with a stop at 5,793. The price then moves to the Point of Control (POC) at 5,825, resulting in a 22-point gain with a 2.2:1 reward-to-risk ratio.
When setting up your trade, place the stop just beyond the wick of the rejection candle or the high/low of the failed breakout. The first profit target should be the POC, as it often acts as a price magnet. If momentum is strong, a secondary target could be the opposite Value Area boundary. However, this strategy is most effective in range-bound or consolidating markets. In trending markets with clear P-shaped or b-shaped profiles, fading the value area carries much greater risk.
For added confirmation, consider using the 80% Rule: If the price opens outside the previous day’s Value Area but then moves back into it and stays there for two consecutive 30-minute periods, there’s an 80% chance it will trade across the entire Value Area to the opposite boundary.
This retracement method complements other volume profile strategies by turning temporary price imbalances into profitable opportunities.
Using Futures Prop Firms for Volume Profile Trading
Volume profile strategies demand precision and discipline – traits that align perfectly with the structured environment of futures prop firms. These firms offer traders access to funded accounts ranging from $25,000 to over $300,000. This allows traders to execute high-probability setups on liquid markets like the E-mini S&P 500 (ES) and Nasdaq 100 (NQ) without putting personal funds at risk. For volume profile traders, this setup provides an excellent opportunity to focus on strategy execution.
Most prop firms supply real-time data and trading platforms such as NinjaTrader, Tradovate, and TradingView. For traders using volume profile indicators like POC (Point of Control) and VAH/VAL (Value Area High/Low), having access to a NinjaTrader license is particularly important.
Take Apex Trader Funding as an example. They offer a straightforward one-step evaluation process and allow traders to manage up to 20 accounts simultaneously. A 25K account starts at $187 per month. Since 2022, Apex has paid out an impressive $694,019,591 to its customers, averaging $13,471,569 in monthly payouts since January 2024.
However, traders must navigate consistency rules imposed by many prop firms. These rules ensure profits are earned steadily rather than relying on single, high-risk trades tied to news events. Platforms like DamnPropFirms simplify this process by offering detailed reviews of firms like Apex Trader Funding, Tradeify, and Lucid Trading. They even provide tools like the Consistency Rule Calculator to help traders stay compliant with payout requirements. For example, as of February 2026, Lucid Trading offered 50% off all accounts, while Tradeify had discounts of up to 40% on select plans.
For those who need immediate access to trading capital, firms like Lucid Trading, Tradeify, Legends Trading, and Purdia Capital offer instant funding options. This quick access to capital is particularly advantageous for setups such as Value Area Fade Retracements and HVN (High Volume Node) bounces. It allows traders to act swiftly in fast-moving "imbalance" zones, like Low Volume Nodes, without risking their own savings.
"Volume profile delivers a clearer view of value, momentum, and risk, making it easier to plan entries, exits, and manage trades with confidence." – Kyle Maring
Conclusion
Volume profile equips traders with tools to identify hidden market dynamics and anticipate price movements. By focusing on institutional activity, it unveils patterns that standard candlestick charts often miss. The five strategies outlined – Volume Edge Rejection, High Volume Node Bounces, Low Volume Node Breakouts, Point of Control (POC) Mean Reversion, and Value Area Fade Retracements – are designed to capitalize on recurring market behaviors in futures markets like the ES and NQ.
"Volume profile reveals these hidden levels that don’t show up on regular candlestick charts." – FuturesHive
These strategies aren’t just theoretical; they offer measurable advantages. For instance, the POC magnet trade boasts a win rate exceeding 75% in ranging markets. Pairing volume profile with confirmation tools like price action or VWAP can further boost trade accuracy.
Before diving in with real capital, it’s essential to practice. Observe at least 20 price reactions at critical levels – such as the POC, Value Area High (VAH), and Value Area Low (VAL) – to understand how price behaves. Simulation tools or paper trading can help you refine your skills and build confidence in these setups. Once you’re consistent, platforms like DamnPropFirms provide access to funded accounts ranging from $25,000 to over $300,000 through programs such as Apex Trader Funding, Take Profit Trader, and FundedNext Futures. These options allow traders to execute high-probability trades without risking personal funds.
Stay disciplined, start small, and let volume profile be your compass in navigating the futures markets.
FAQs
What’s the best Volume Profile setting for day trading ES/NQ?
When day trading ES (E-mini S&P 500) or NQ (E-mini Nasdaq 100), the best Volume Profile settings emphasize critical levels like the Point of Control (POC), Value Area High (VAH), and Value Area Low (VAL). These levels pinpoint areas of significant support and resistance, offering traders high-probability zones for potential entries or exits.
To effectively use these settings, opt for a 30-minute chart. This time frame helps capture recent market movements and reveals areas of concentrated trading volume, often linked to institutional activity. Identifying these heavy volume zones can provide valuable insights into market behavior and price action.
How can I tell if the market is balanced or trending before fading VAH/VAL?
To determine if the market is balanced or trending before deciding to fade the Value Area High (VAH) or Value Area Low (VAL), leverage insights from the volume profile. In a balanced market, prices tend to consolidate around high-volume nodes, signaling equilibrium. On the other hand, a trending market moves away from these high-volume areas, with low-volume zones acting as transition points. Pay close attention to how prices behave at these levels to confirm whether fading VAH or VAL is a viable strategy.
Which confirmation tools work best with Volume Profile (VWAP, delta, or RSI)?
The most effective tools to pair with Volume Profile are VWAP (Volume Weighted Average Price) and the Point of Control (POC). These tools are excellent for identifying critical support and resistance levels while shedding light on market sentiment and price movements.