If you’re trading futures and not using ATR for position sizing, you’re asking for trouble. One bad ES trade can blow up your account if you don’t account for volatility. ATR (Average True Range) helps you size positions based on market movement, not guesswork. Whether you’re trading your own account or going through a prop firm evaluation like Apex (see our Apex Trader Funding FAQ) or Topstep, this method keeps your risk steady – even when the market gets wild. Here’s the breakdown of how to calculate position size using ATR, with examples for ES, NQ, and MNQ contract specs.
What ATR Is and Why It Matters for Position Sizing
How ATR Works in Futures Trading
ATR, developed by J. Welles Wilder, is a tool for measuring market volatility. It uses a standard 14-period lookback and accounts for the full range of market movement, including session gaps. For instance, in a volatile Nasdaq (NQ) market, a 10-point move might just be noise. But in a quieter market, that same move could be a big deal. ATR levels the playing field by helping you adjust position sizes based on how wild or calm the market is. While the 14-period setting with Wilder’s smoothing is the default, traders often tweak it – some go shorter with a 5-period setting for quick trades, while others stretch it to 20 periods for a broader view.
Now, let’s see how this translates into managing your risk effectively.
Why ATR Helps Control Risk
ATR isn’t just about spotting volatility; it’s a game-changer for managing risk. By tying your position size to volatility, you avoid overleveraging when markets are swinging wildly. On the flip side, when volatility drops, you can take on larger positions because your stop-loss can be tighter.
This beats the old-school fixed-dollar stop-loss approach, which ignores market dynamics and often gets hit by normal price moves.
ATR-based sizing turns market uncertainty into something you can manage.
Here’s why it matters: with a 1:2 reward-to-risk ratio, you only need to win 35% of your trades to stay in the green. That’s huge when you’re trading prop firm accounts like Apex Trader Funding or Topstep, where trailing drawdowns can punish poorly managed risk.
To calculate your position size, you can use a futures risk management planner or this formula:
Position Size (Units) = Account Risk Dollars / (ATR Value x ATR Multiplier x Point Value)
Always round down to the nearest whole contract to keep your risk in check. This ensures you stay aligned with your predefined risk limits.
sbb-itb-46ae61d
Live Futures Stop Icebergs, ATR Reversions, GEX Levels and Real-Time Trade Management| Scott Pulcini
The ATR Calculation Formula
To use ATR effectively for position sizing, you first need to understand how it’s calculated. It starts with figuring out the True Range (TR) for a single period, then smoothing those values using Wilder’s method. With these steps clear, you can calculate the Average True Range (ATR).
How to Calculate True Range
True Range captures the full price movement of a single bar or candle, including overnight gaps – those jumps that occur when the market closes at one price and opens at another.
Here’s how you calculate True Range. Take the largest of these three values:
- (1) Current high minus current low
- (2) Absolute value of current high minus previous close
- (3) Absolute value of current low minus previous close
For example, let’s say ES closes at 5,000 on Monday. On Tuesday, it gaps to 5,020 and trades between 5,018 and 5,035. The standard range of 17 points (5,035 – 5,018) misses the 20-point gap from the previous close. True Range fixes this by comparing the current high (5,035) to the previous close (5,000), giving you 35 points.
Applying Wilder’s Smoothing to Get ATR
Once you’ve calculated True Range values, the next step is smoothing them over a lookback period to find the Average True Range. The most common setting is 14 periods – whether you’re analyzing daily bars, 5-minute charts, or something else[1][2].
Wilder’s method starts by averaging the first 14 TR values. After that, it uses this formula for updates:
(Prior ATR × 13 + Current TR) / 14
This approach creates a moving average that’s less sensitive to sudden price spikes compared to a simple moving average. It gives you a more stable view of market volatility.
Most trading platforms like TradingView and Tradovate or NinjaTrader handle this calculation for you automatically. But understanding the process is essential as we move into how ATR helps with position sizing.
The Position Sizing Formula Using ATR
ATR Position Sizing Formula Calculator for Futures Trading
This section dives into turning market volatility, measured by ATR, into a clear, risk-managed position size.
Breaking Down the Position Size Formula
Here’s the formula you’ll need:
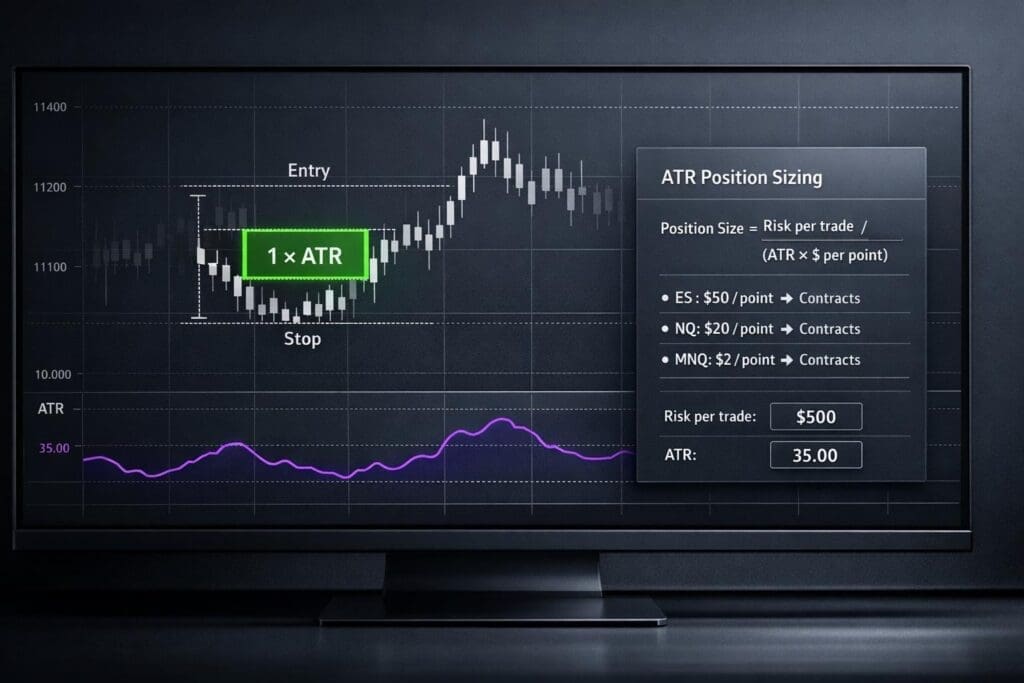
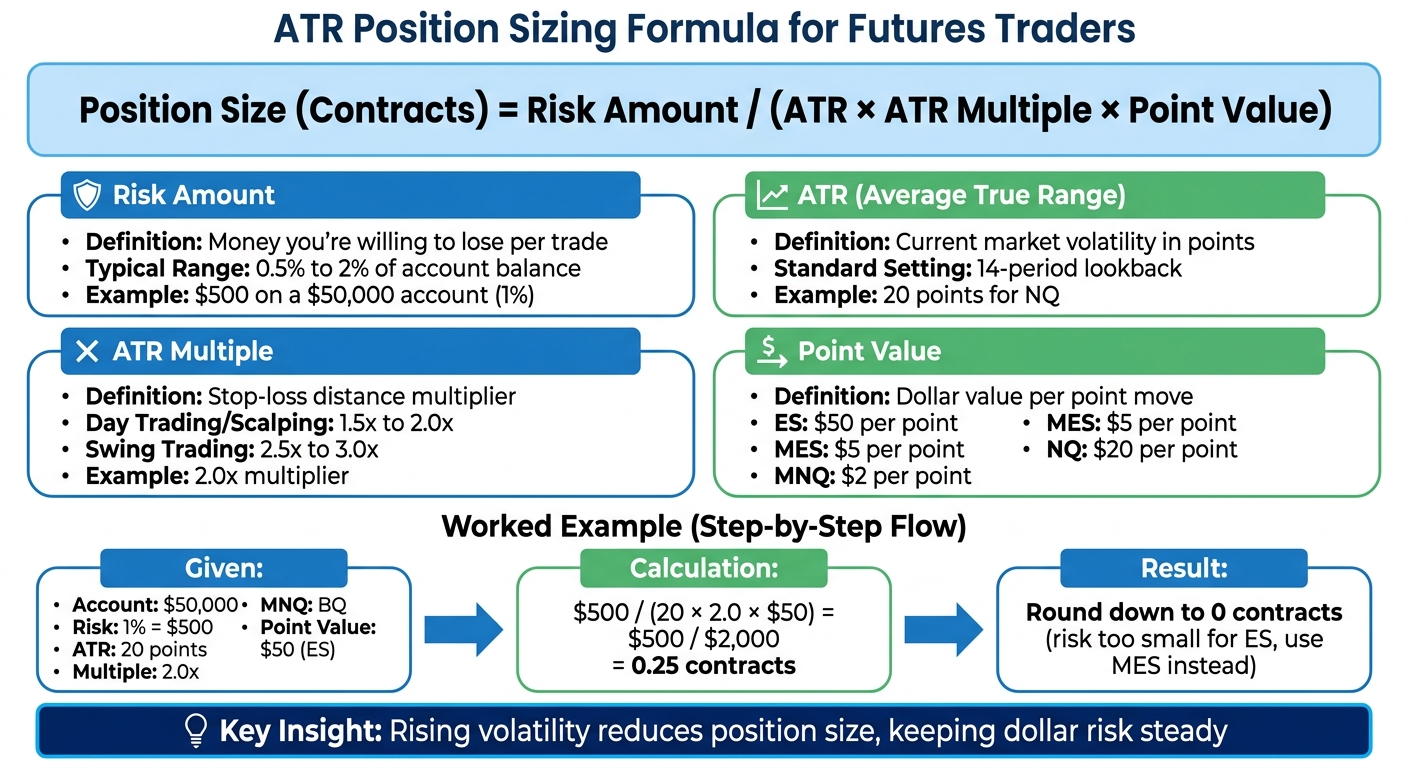
Position Size (Contracts) = Risk Amount / (ATR × ATR Multiple × Point Value)
Let’s break it down:
- Risk Amount: How much money you’re ready to lose on a trade – usually 0.5% to 2% of your account balance.
- ATR: The current volatility of the asset, shown in points.
- ATR Multiple: A multiplier that sets the distance for your stop-loss (common range: 1.5x to 3.0x).
- Point Value: The dollar amount tied to each point move of the contract.
Here’s an example: Say you’ve got a $50,000 account and decide to risk 1% ($500) on a trade. The asset has a 14-period ATR of 20 points, you’re using a 2.0x multiplier, and the point value for ES is $50. Plugging into the formula:
$500 / (20 × 2.0 × $50) = 0.25 contracts.
Since you can’t trade partial contracts, this means your risk is too small for a full ES contract. You could scale down to a smaller contract like MES or adjust your ATR multiple.
Now, let’s say you want to trade 1 full ES contract. To do that, you’d need to set your risk at $2,000 (20 × 2.0 × $50). If volatility increases and ATR rises to 24 points, your new position size becomes:
$2,000 / (24 × 2.0 × $50) ≈ 0.83 contracts.
This shows how rising volatility reduces your position size, keeping your risk level steady.
“Using ATR to adjust position size transforms risk management from a static discipline into a dynamic, adaptive system” [1].
Next up, let’s look at how to fine-tune your ATR multiple for better stop-loss placement.
How to Pick Your ATR Multiple
Your ATR multiple sets how much room your trade has before hitting the stop-loss. A smaller multiple tightens stops and increases position size, while a larger multiple widens stops and reduces position size.
- For day trading and scalping: Multiples between 1.5x and 2.0x are common. This keeps stops tight enough to protect your capital but loose enough to handle intraday price swings.
- For swing trading or trend-following: Multiples of 2.5x to 3.0x work well, as they help avoid getting stopped out by minor pullbacks.
Here’s a real-world example: In February 2026, trader Mike Rodriguez completed a $50,000 Topstep Combine, using a 2.0x multiplier for ES day trades and risking 0.6% per trade. Over 22 days, he made $3,180 with a 60% win rate, all while staying within 50% of his max drawdown limit.
Adjust your ATR multiple based on market conditions. When volatility spikes and ATR values climb into the top decile, a 3.0x multiple can give trades extra room to play out. On the flip side, in calmer markets, tightening to a 1.5x multiple allows for more aggressive position sizing. Here’s a quick sanity check: if the thought of a full loss at your calculated position size makes you too nervous, either increase your multiple or lower your risk percentage [6].
Position Sizing Examples for ES, NQ, and MNQ
Let’s dive into how the ATR formula plays out with different contract specs and how it impacts position sizing.
Example 1: Position Size for ES
Imagine you have a $50,000 account and you’re comfortable risking 1% of it ($500) on a single ES trade. The 14-period ATR is at 5.0 points, and you’re using a 2.0x multiplier for your stop-loss. With ES, each point is worth $50.
Position Size = $500 / (5.0 × 2.0 × $50) = $500 / $500 = 1 contract
Your stop-loss ends up 10 points away (5.0 ATR × 2.0 multiplier). If the trade hits your stop, you’ll lose exactly $500. Now, let’s say ATR bumps up to 6.0 points. Recalculate:
Position Size = $500 / (6.0 × 2.0 × $50) = $500 / $600 = 0.83 contracts
Since you can’t trade fractions of a contract, you round down to zero. That means ES becomes too volatile for your $500 risk limit unless you adjust. You’d have to either increase your risk tolerance, lower the ATR multiplier to 1.5x, or switch to MES (Micro E-mini S&P 500), where each point is worth just $5 instead of $50.
Example 2: Position Size for MNQ
Now, let’s look at MNQ. Say you’re still working with a $50,000 account and risking 1% ($500). The 14-period ATR is 20 points, your multiplier is 2.0x, and MNQ’s point value is $2.
Position Size = $500 / (20 × 2.0 × $2) = $500 / $80 = 6.25 contracts
You round down to 6 contracts. Your stop-loss lands 40 points away (20 ATR × 2.0 multiplier), and each contract risks $80 (40 points × $2). With 6 contracts, your total risk is $480 – comfortably under your $500 cap.
Now, if ATR jumps to 25 points, you’d need to adjust:
Position Size = $500 / (25 × 2.0 × $2) = $500 / $100 = 5 contracts
With the wider stop, you’d scale back to 5 contracts. This shows how ATR-based sizing works to keep your dollar risk steady, even as volatility changes.
Adjusting Position Sizes for Prop Firm Rules
When trading prop firm accounts, it’s not enough to just follow ATR-based position sizing for market volatility. You’ve also got to account for the specific rules set by these firms, like drawdown limits, consistency requirements, and daily loss caps. Poor risk management is one of the top reasons traders fail evaluations. If you’re not careful, you could blow up your account before you even get started.
Position Sizing for Apex Trader Funding Rules
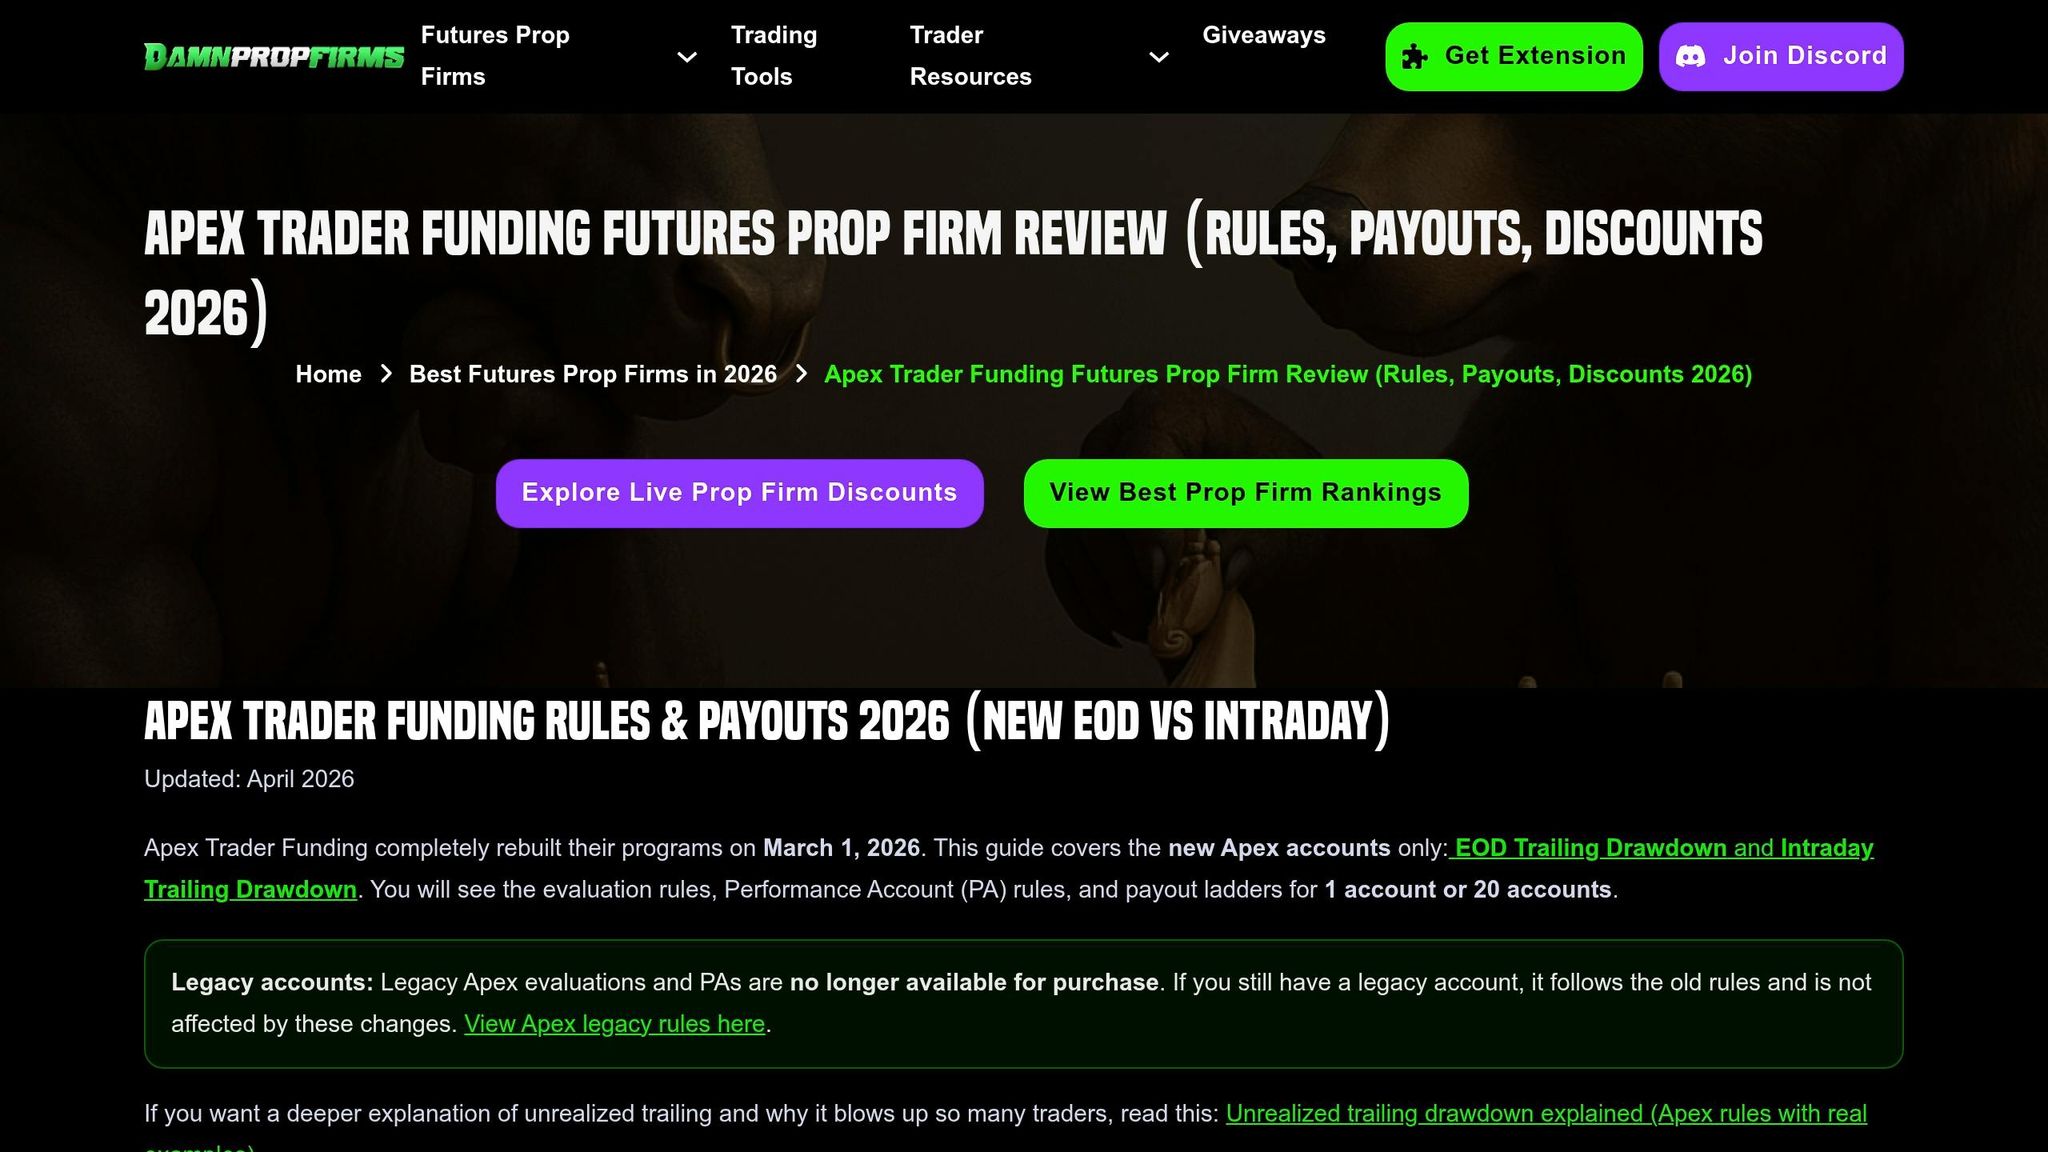
As of March 2026, Apex Trader Funding enforces a 50% consistency rule for new accounts. Legacy accounts purchased before this date still follow the older 30% rule. This means no single day can account for more than 50% of your total profit during the evaluation. If you’re using ATR-based stops and targets, you’ll need to manage your daily upside carefully to avoid one big day violating this rule.
Apex also offers two drawdown options: end-of-day (EOD) and the traditional trailing drawdown [5]. With the EOD drawdown, your drawdown floor updates only at the end of each session, giving you more flexibility intraday. In this case, you can use a tighter ATR multiplier, like 1.5x or 2.0x. But if you’re on the trailing drawdown, you’ll need wider stops – around 2.5x to 3.0x ATR – to avoid getting stopped out by normal market fluctuations [7].
A cautious approach here is to risk just 0.5–0.75% of your total drawdown per trade. For example, on a $50,000 Apex account with a $2,500 drawdown limit, this translates to $12.50–$18.75 risk per trade. Let’s say you’re trading MES with a 4.0 ATR and using a 2.0x multiplier, which sets your stop 8 points away. This would mean risking about $40 per contract – already over the 0.75% limit. To stay within the limit, you’d need to either drop your multiplier to 1.5x (reducing the stop to 6 points, or $30 risk) or rethink your entire setup.
Position Sizing for Topstep Rules
Topstep takes a different approach with its trailing drawdown, which follows your account’s high-water mark. As you make profits, the drawdown floor moves up, leaving you with less room to absorb losses. Kyle Kozlowski, Founder of Damn Prop Firms, explains:
“Trailing drawdown follows your highest account equity – very restrictive. Once profitable, risk tolerance shrinks as drawdown trails BUT only until you pass the max loss limit in profit.”
On Topstep accounts, you’ll need to be even more conservative with your ATR-based stops. Limit your risk to 0.5% of your trailing drawdown. For a $50,000 account with a $2,000 drawdown, that’s just $10 per trade. Now, consider trading ES with a 5.0 ATR and a 2.0x multiplier, which sets your stop 10 points away. That’s about $500 risk per contract – 50 times your allowable risk. To fix this, you’d need to switch to a lower-risk product like MES (where a 10-point move equals $50 risk per contract) or drastically tighten your ATR multiplier. But tightening stops too much can defeat the purpose of using volatility-based levels in the first place.
Topstep also has strict daily loss limits that reset each session. If you hit 50–60% of your daily cap, it’s time to stop trading for the day. Chasing losses by increasing position size is a common mistake, and it’s responsible for 60% of rule violations. Don’t forget to include slippage and commissions when calculating your worst-case risk scenarios [3].
Setting Up ATR Indicators on Trading Platforms
Getting ATR set up on your trading platform is the last piece of the puzzle for putting these risk management strategies into action. The good news? ATR is standard on all major futures trading platforms like TradingView, NinjaTrader, and Tradovate. While most traders stick with the default settings, tweaking them can fine-tune the indicator to match your trading style or meet prop firm requirements.
Adding ATR to TradingView Charts

To add ATR in TradingView, start by clicking the Indicators button, then type “Average True Range” into the search bar and select it. From there, you can adjust the settings – like changing the line color or modifying the lookback period. The default is a 14-period (Wilder’s Smoothing), but you might want to switch to 5 for day trading or go with 20–50 for swing trades[1].
For added clarity, you can draw horizontal reference lines at significant ATR levels or overlay the indicator directly on your price chart. TradingView also has some handy community-built scripts, like the “Prop Firm Position Sizer.” This script automates the math by factoring in your account size, risk percentage, and the current ATR reading to calculate the number of contracts you should trade. It’s a lifesaver for avoiding manual errors during live trading[5].
If TradingView isn’t your platform of choice, don’t worry – other platforms have comparable ATR tools.
Using ATR in NinjaTrader and Tradovate
NinjaTrader and Tradovate also come with built-in ATR indicators, but they bring some extra features to the table for managing risk dynamically. Both platforms include position size calculators and margin tracking tools, making it easier to avoid costly math mistakes when the market’s moving fast[3]. In NinjaTrader, you can even set custom alerts to adjust your position size on the fly when ATR hits specific thresholds.
Another key feature is server-side hard stops. These ensure your orders execute even if your internet connection drops – an absolute must when trading with strict drawdown limits. Just double-check that the platform uses Wilder’s Smoothing (RMA) for accurate ATR calculations.
If you’re trading with a prop firm – like Damn Prop Firms favorites such as Topstep or Apex Trader Funding – be sure to adjust your ATR settings to align with the firm’s drawdown rules. For example, accounts with unrealized trailing drawdowns might need a higher ATR multiplier to account for market noise, while end-of-day drawdown rules could let you use tighter stops.
Position Size Reference Tables for Futures Contracts
When the market’s moving fast, there’s no time for on-the-fly math. Pre-calculated reference tables help you standardize risk across different contracts and volatility levels without scrambling for your calculator.
The concept is straightforward: as ATR (Average True Range) goes up, your position size has to come down to keep your dollar risk steady. For example, at 5,000 index points, a single ES contract represents $250,000 in notional value – five times the size of a typical $50,000 prop account [5]. Mismanage your sizing, and one bad trade could erase weeks of gains. The tables below break down the key metrics for some of the most traded futures contracts.
These tables assume you’re risking 1% per trade and using a 2× ATR multiplier for stop placement. You can tweak these numbers based on your firm’s rules or your personal risk tolerance.
| Contract | Symbol | Point Value | ATR (Points) | Stop Distance (2× ATR) | Risk per Contract | Contracts for $500 Risk |
|---|---|---|---|---|---|---|
| S&P 500 E-mini | ES | $50 | 5.0 | 10.0 | $500 | 1 |
| S&P 500 Micro | MES | $5 | 5.0 | 10.0 | $50 | 10 |
| Nasdaq 100 E-mini | NQ | $20 | 20.0 | 40.0 | $800 | 0 (use MNQ) |
| Nasdaq 100 Micro | MNQ | $2 | 20.0 | 40.0 | $80 | 6 |
| Dow Jones Micro | MYM | $0.50 | 40.0 | 80.0 | $40 | 12 |
If you’re trading with a trailing drawdown account (like Apex Trader Funding or Topstep), base your risk on 1% of your remaining drawdown buffer instead of your total balance. This automatically scales your position size down as your buffer tightens, keeping you in the game longer.
Keep in mind, ATR values aren’t static – they change with market conditions. Recalculate these tables for every session to avoid getting caught off guard. Yesterday’s setup might be too risky today. As Adelin from Finaur puts it:
“Position sizing allows traders to convert uncertainty into a number they can control” [2].
FAQs
Which ATR timeframe should I use for position sizing?
The best ATR timeframe for position sizing really depends on how you trade and the market you’re working with. For most swing traders or anyone looking at general market volatility, ATR 14 is a go-to default. If you’re trading intraday, shorter periods might give you a better read on the action. On the other hand, if you’re into swing or position trading, something like ATR 20 can work better. The key is to align the ATR timeframe with your trading style and how much volatility you’re comfortable with.
How do I factor commissions and slippage into ATR-based risk?
To factor in commissions and slippage when using ATR-based risk management, you’ll need to tweak your calculations a bit. Add the estimated slippage and commissions to your stop distance before dividing by your ATR multiple. This way, your position size accounts for these real trading costs. It helps you stay within your planned risk per trade and keeps your risk exposure consistent.
How should I size trades when a prop firm uses trailing drawdown?
When managing a trailing drawdown, focus on your risk buffer rather than the total account balance. To keep things in check, calculate your risk as a percentage of the trailing drawdown limit. Then, divide that risk by your stop-loss distance, factoring in volatility with the ATR (Average True Range). This approach helps you stay within the drawdown limit and avoid heavy losses that could put your account at risk.