Footprint charts are a goldmine for traders who want to see what’s really happening inside each candle. They break down the tug-of-war between buyers and sellers at every price level, exposing areas where big players are active. Volume clusters, like High Volume Nodes (HVNs) or the Point of Control (POC), show where the most trading happened – key zones for support, resistance, or reversals. This guide gets straight to the point: how to read these clusters, what they mean, and how to use them for smarter trades. Let’s dive in.
Bookmap vs. Footprint Charts | Bruce Pringle
sbb-itb-46ae61d
Setting Up Footprint Charts for Volume Cluster Analysis
Getting your footprint chart set up correctly is essential for spotting clear volume patterns. Once your chart settings are dialed in, the next step is picking the right footprint mode.
Picking the Right Footprint Chart Type
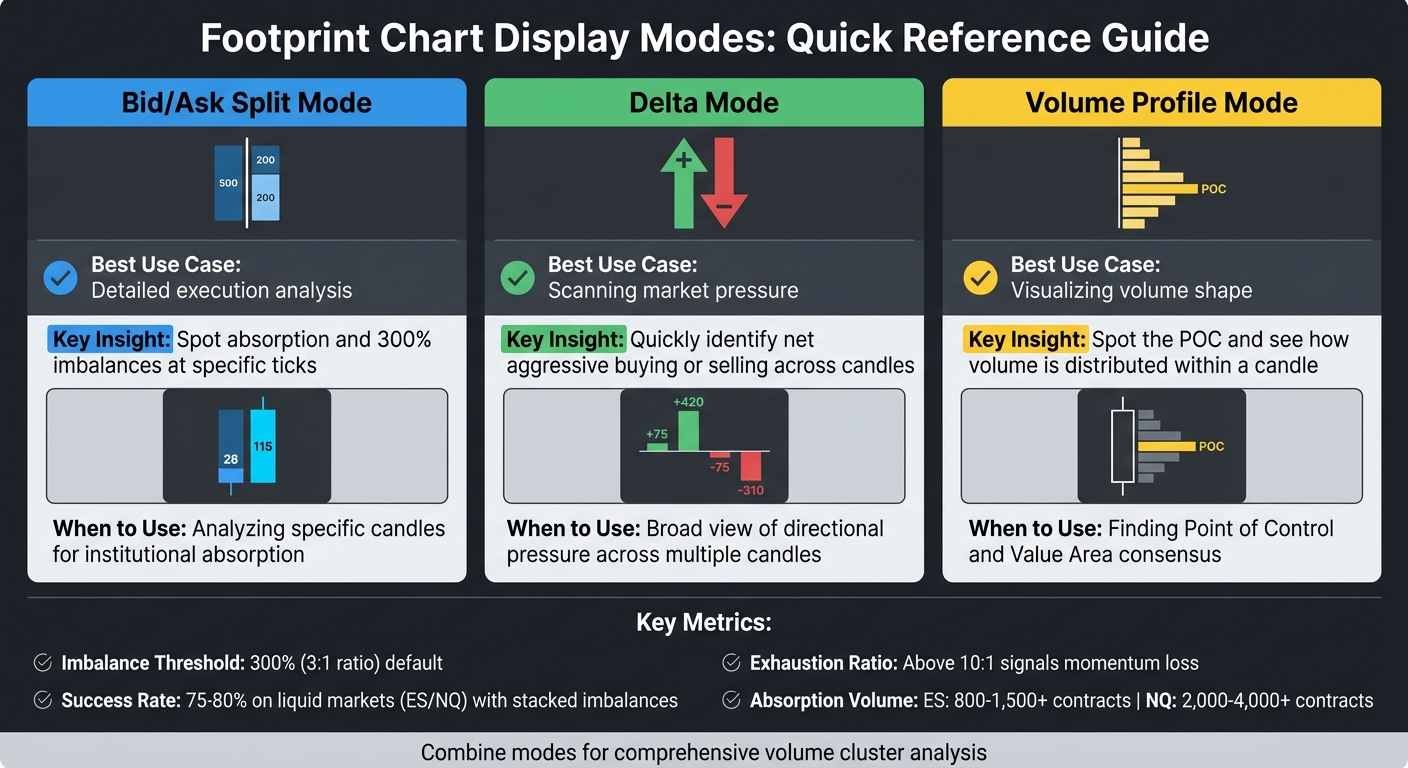
Choosing the right footprint chart mode is key to uncovering volume clusters. If you’re looking to identify areas of absorption or trapped traders, the Bid/Ask Split mode is your best bet. It shows sell volume on the left and buy volume on the right, making it easier to spot these clusters [1].
For a quicker look at overall buying or selling pressure across candles, Delta Mode is a simpler option. It shows the net difference between buy and sell volume at each price level but doesn’t reveal the full effort behind the move [1]. If you’re hunting for the Point of Control (POC) – the price level with the highest volume – Volume Profile (Cluster) Mode is the way to go. It uses horizontal bars to show total volume at each price level [1][4]. Lastly, Imbalance Mode highlights price levels where one side dominates the other by a set margin, often a 3:1 ratio, making it great for spotting "stacked imbalances" that suggest aggressive institutional activity [4].
Most platforms default to a 300% threshold (3:1 ratio) for marking volume imbalances. Stacked imbalances (three or more consecutive levels) at key support or resistance zones can have success rates of 75–80% on liquid markets like ES and NQ [1][4]. Traders also watch for "exhaustion ratios" above 10:1 at candle extremes, which often signal a move is losing momentum [1].
Adjusting Chart Settings
After selecting your chart type, tweaking the settings is just as important. Skip time-based charts like 5-minute bars for this kind of analysis. Instead, use tick-based charts (e.g., 512-tick for ES) or volume-based bars. These normalize activity and make volume clusters easier to read [4]. For fast-moving markets like the NASDAQ (NQ), set manual row sizes (4–5 ticks) to consolidate the data and reduce clutter [1].
Configure your platform to highlight zones where at least three consecutive price levels show an imbalance. This filters out minor noise. You can also apply a minimum volume filter, such as 50–100 contracts, to focus only on meaningful clusters [1][4]. For better visibility, disable color gradients so the raw volume data stands out. Highlight the POC with a bold, high-contrast color like yellow [1]. If you’re using TradingView, set the display type to "Cluster", select "Buy and Sell" for the type, and turn off "Gradient" to keep the focus on the numbers [1].
Trading Platforms That Support Footprint Charts
TradingView now includes "Volume Footprint" as a built-in chart type, offering cluster (bid/ask), delta, and profile views [1]. Optimus Flow, powered by Quantower, also offers customizable cluster charts and integrates order entry for Futures prop firm traders [5].
For more advanced order flow tools, ATAS (Advanced Trading Analytical Software) provides a wide range of cluster statistics and footprint modes, with pricing between $60 and $99 per month [4][6]. Sierra Chart is another popular choice, costing about $36 per month or $425 for a lifetime license, and it’s highly regarded by institutional traders for its reliability [4]. NinjaTrader, at around $60 per month for the necessary data package, combines a user-friendly interface with a manageable learning curve, making it a solid pick for newer traders [4].
Keep in mind, footprint charts rely on centralized exchange data. They work great for Futures (ES, NQ, CL) and Crypto but aren’t reliable for Spot Forex since there’s no centralized volume feed [1]. Setting up your platform this way ensures accurate volume cluster displays, giving you a solid foundation for smarter trading decisions.
How to Identify Volume Clusters on Footprint Charts
Now that your footprint chart is set up, it’s time to dig into the volume data and find those critical clusters that reveal what’s really happening in the market. Let’s break down how to spot these clusters and what they tell you about market activity.
"Every candlestick on your chart is a lie by omission. It tells you where price opened, where it closed, and the extremes it hit. What it does not tell you is who was fighting inside that candle" [1].
Finding Dense Executed Volume
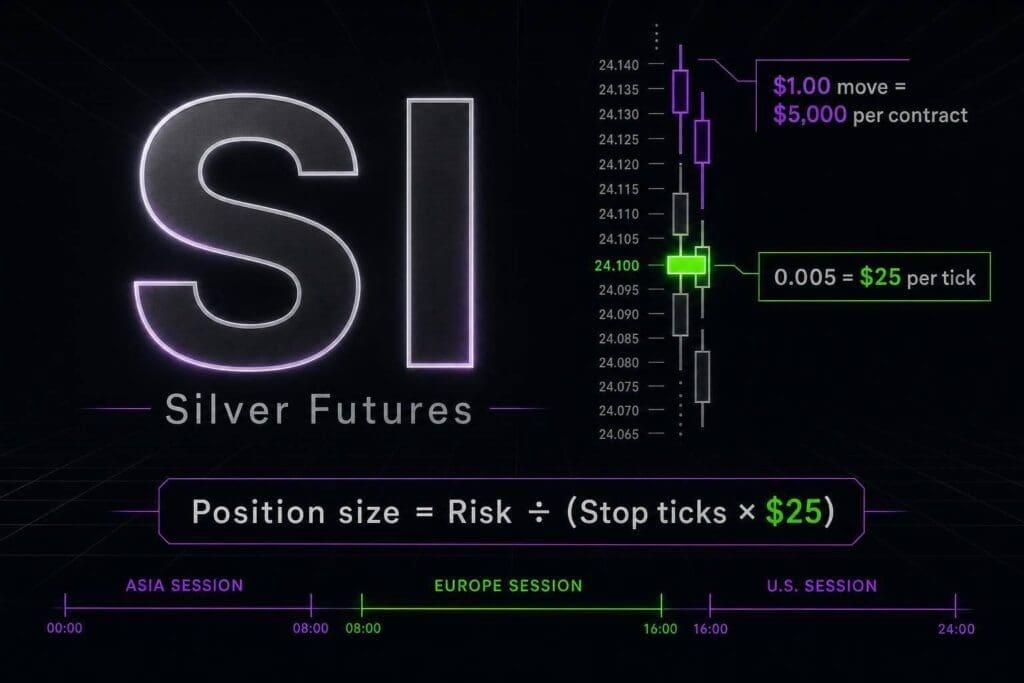
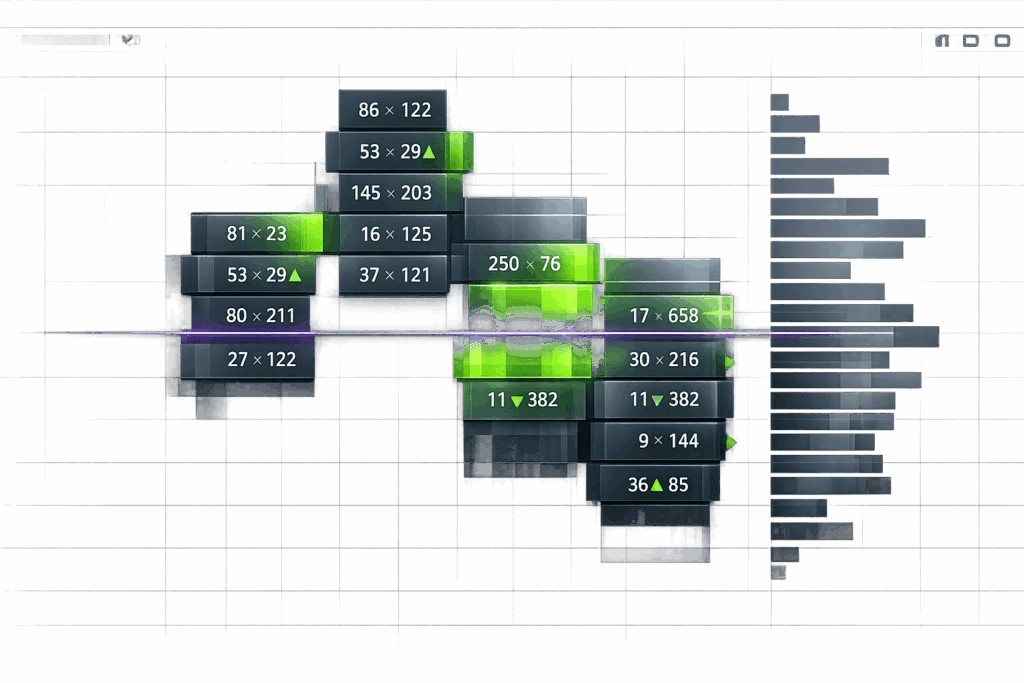
Start by scanning for areas where traded volume spikes. For example, if you see a single price tick with 150 contracts traded while nearby ticks only show 20–30 contracts, you’ve identified a volume cluster. On a 512-tick ES chart, a spike like 8,000 contracts at one price level with no price movement could indicate absorption – a sign that the market might reverse soon [1].
Pay close attention to clusters forming around key technical levels like session highs, lows, or order blocks. A random cluster in the middle of a range is often just noise, but when it lines up with a support or resistance zone, it’s worth investigating further [1]. Once you’ve identified these dense areas, dig deeper to understand their significance.
Recognizing High Volume Nodes
After spotting dense volume, shift your focus to High Volume Nodes (HVNs). These are price levels where the largest number of contracts were traded within a single candle. The Point of Control (POC) – the price level with the highest volume – often acts as support or resistance when the market revisits it [1][2]. On your footprint chart, you’ll spot the POC as the longest bar in Volume Profile mode or the largest number in Bid/Ask Split mode.
HVNs near session highs or lows are especially important. A "finished auction", where volume drops to near-zero at the extreme (e.g., 0x9 contracts), signals exhaustion and a potential turning point [1]. On the other hand, an "unfinished auction", where significant volume appears at the extreme (e.g., 15×19 contracts), suggests the market might revisit that level to resolve unfinished business [1][3].
Reading Delta Imbalances and Shifts
Delta imbalances show who’s dominating at each price level – buyers or sellers. Look for "stacked imbalances", where three or more consecutive price levels show imbalances on the same side. These often indicate strong institutional activity [1][2].
Pay attention to shifts in delta. For example, when the delta moves from consecutive negative to positive, it could signal a reversal [1][2]. Delta divergence is another key signal – if the price makes a new high but the delta shows weaker buying than the last peak, it’s a warning sign of exhaustion [1][2]. Keep in mind, imbalances are calculated diagonally, comparing the ask volume at one price level with the bid volume one tick above it, because the best bid and ask are always separated by at least one tick [1].
Step-by-Step Process for Spotting Volume Clusters
Footprint Chart Display Modes Comparison Guide
Let’s break down how to pinpoint volume clusters during live trading. This practical workflow builds on earlier concepts, helping you filter out the noise and focus on real institutional activity.
Scanning for Volume Outliers
Start by looking for volume spikes that stand out – these can signal key turning points. Use a threshold of 3x the average volume to identify potential clusters. For instance, if most ticks show 30–50 contracts and one spikes to around 150, flag it. Compare each tick only to its immediate neighbors to keep the context tight.
Pay attention to stacked imbalances – three consecutive levels moving in the same direction [1]. This helps cut through random noise and highlights "walls" of aggressive buying or selling. For fast-moving markets like NQ or Gold (GC), group 4–5 ticks per row manually. This consolidates the data into readable clusters instead of a mess of scattered numbers. Once you’ve flagged an outlier, cross-check it against historical volume patterns before acting on it, a technique often used when trading with top futures prop firms.
Using Volume Profile Overlays
Add a Volume Profile overlay to your footprint chart to see if your clusters align with historical High Volume Nodes (HVNs). The Value Area shows the price range where about 70% of the volume traded during a specific period [1][2]. If a cluster forms near a historical Value Area High (VAH) or Value Area Low (VAL), it’s likely significant.
Traders often treat the Point of Control (POC) as a "magnet" where price tends to gravitate [1][2]. If your volume cluster is forming near a historical POC, it could indicate institutional activity at a previously accepted fair value. Don’t trade clusters in isolation – look for confirmation at key levels like order blocks, VWAP, or session highs and lows [1].
Comparing Different Display Modes
Switching between display modes can reveal different aspects of volume clusters and help confirm your findings.
- Bid/Ask Split mode: Shows raw buy and sell volumes, perfect for spotting absorption [1].
- Delta mode: Highlights the net difference between buying and selling, great for scanning directional pressure across multiple candles [1].
- Volume Profile mode: Displays volume distribution as horizontal bars, making the POC and Value Area easy to spot [1][2].
| Display Mode | Best Use Case | Key Insight |
|---|---|---|
| Bid/Ask Split | Detailed execution analysis | Spot absorption and 300% imbalances at specific ticks [1] |
| Delta Mode | Scanning market pressure | Quickly identify net aggressive buying or selling across candles [1][2] |
| Volume Profile | Visualizing volume shape | Spot the POC and see how volume is distributed within a candle [1][2] |
Use Bid/Ask Split mode for detailed analysis of a specific candle, Delta mode for a broader view of market pressure, and Volume Profile to see where the market has reached consensus. Combining these views strengthens your understanding of volume clusters before making any trading decisions. For those looking to apply these strategies without a long evaluation, consider exploring prop firms with instant funding.
Using Volume Clusters to Make Trading Decisions
Once you’ve pinpointed volume clusters, the next step is applying them to your trade setups. These clusters help you understand how institutions interact with key price zones, giving you the edge to spot high-probability trades.
Volume Clusters as Support and Resistance
High Volume Nodes (HVNs) and the Point of Control (POC) mark crucial levels where institutional activity often creates support or resistance [3]. When the price revisits these zones, they tend to hold because they reflect areas of prior agreement on fair value between buyers and sellers. Pay attention to finished auctions at the edges of clusters – these are spots where volume drops to zero, signaling exhaustion. For example, zero volume at a candle high on the buy side or at a candle low on the sell side can indicate whether a level will hold. Exhaustion ratios above 10:1 are a strong sign that momentum is fading [1].
The Value Area High (VAH) and Value Area Low (VAL) are also critical testing zones. If a volume cluster forms near these levels, it highlights institutional interest and can set up solid retest entries [1].
Effort vs. Result Analysis
This is where pros separate themselves from amateurs. The idea is simple: measure the "effort" (traded volume and delta at a price level) and compare it to the "result" (the actual price movement) [1]. If you see heavy selling at a support level but the price barely moves, it’s likely because large passive orders are soaking up the selling pressure.
For example, on the ES, absorption often shows up as 800–1,500+ contracts trading at a single price without much movement. On the NQ, you’ll see similar patterns with 2,000–4,000+ contracts [4]. A case in point: in January 2026, the ES tested the previous day’s VAL at 5,875. The footprint showed 1,250 contracts of aggressive selling against just 180 contracts of buying. Despite this, the price only dipped slightly to 5,874.75 before bouncing back. Traders who went long at 5,876 with stops at 5,872 aimed for the POC at 5,888, setting up a clean 3:1 reward-to-risk trade [4].
Delta divergence is another key signal. If the price makes a new high or low but cumulative delta doesn’t follow suit (e.g., forming a lower high or higher low), it’s a sign the aggressive side is running out of steam. Combine this with stacked imbalances – three or more consecutive levels showing a 300%+ volume difference – and key zones like the VAL or POC. This combo can produce win rates in the 75–80% range [4].
Clusters Near Liquidity Zones
Liquidity zones, like round numbers, session highs/lows, or VWAP, add another layer of context to volume clusters. These zones often attract institutional orders, making them key areas to watch. The way volume clusters behave here can help you decide if you’re looking at absorption (a reversal signal) or the start of a breakout.
For absorption reversals, wait for a delta flip. This happens when aggressive volume in one direction fails to move the price and then reverses, trapping traders and forcing them to cover. For breakout setups, look for stacked imbalances breaking through a liquidity zone, paired with a sharp delta spike. This confirms strong institutional conviction [4].
Timing is everything. Footprint patterns during Regular Trading Hours (RTH) are more reliable since overnight Globex volume typically accounts for only 30–40% of RTH volume [4]. When setting stops, place them 4–6 ticks beyond the level of absorption or the extreme of the imbalance. And don’t chase imbalances mid-bar – always wait for the candle to close before making your move [4].
Common Mistakes and Advanced Techniques
Now that you’ve got the basics of using volume clusters down, let’s dive into some common mistakes traders make and explore advanced techniques that can set you apart from the crowd.
Avoiding False Clusters
Not every volume cluster is worth your attention. A cluster only matters if it lines up with key levels like the POC, VAH/VAL, or established support and resistance zones [1][4].
Another common mistake? Assuming heavy volume equals price direction. For example, if 8,000 contracts trade at a level but the price barely moves, that’s absorption – a signal that buyers are stepping in, not sellers taking control [1].
Timing is another red flag. Real breakouts don’t sit around. If a breakout stalls for 15–20 minutes despite high volume, it’s probably a fakeout [1].
Lastly, don’t clutter your screen with too much data. Stick to the essentials: large volume clusters, delta shifts, 300%+ imbalances, and absorption. Trying to interpret every single number is a fast track to analysis paralysis [1].
Once you’ve nailed these basics, you can step up your game by integrating order flow imbalances into your strategy.
Combining Clusters with Order Flow Imbalances
To sharpen your edge, pair volume clusters with order flow imbalance data. Stacked imbalances – where three or more price levels show a 300%+ volume difference in one direction – are a strong indicator of institutional activity [1][4]. When these imbalances show up at major levels like the VAL or POC, your win rate can hit 75–80% on liquid futures like ES and NQ [4]. For the NQ, consider raising your imbalance threshold to 4:1 or even 5:1 due to the market’s higher noise levels [4].
Delta divergence is another powerful tool. If the price makes a new low but the cumulative delta shows a higher low, it often signals that selling pressure is drying up [4]. Pair this with absorption – look for 800–1,500+ contracts on ES or 2,000–4,000+ contracts on NQ trading at a single price without much movement – to set up high-probability trades [4].
Use tick-based charts for precision (512-tick for ES, 233-tick for NQ) and wait for candle closures before acting on imbalances [4].
Scalping Strategies Using Volume Clusters
For day trading enthusiasts, scalping with volume clusters can give you precise entry and exit points. Start by focusing on absorption at round numbers and keep an eye out for delta flips. On the NQ, faster tick charts like 144-tick or 233-tick can help you spot absorption at key levels, such as 18,000 or 19,000 [4]. Once you see absorption followed by a delta flip, enter with stops placed 4–6 ticks (ES) or 6–10 points (NQ) beyond the level [1][4].
Pay attention to finished auctions at candle extremes. For instance, zero volume at the high (e.g., 0x9) or low signals exhaustion, increasing the odds that the level will hold [1]. Similarly, an exhaustion ratio above 10:1 – like 200 contracts versus 8 contracts at the extreme – indicates the move is running out of steam [1].
Finally, use an "Expected vs. Actual" approach. Before price reaches your target, define what you expect to see – absorption, a delta flip, or a stacked imbalance. If the footprint doesn’t match your expectations, it’s probably better to pass on the trade [1].
Trading Resources for Further Learning
Want to sharpen your volume cluster strategies? Here are some top resources to give you an edge.
DamnPropFirms Resources
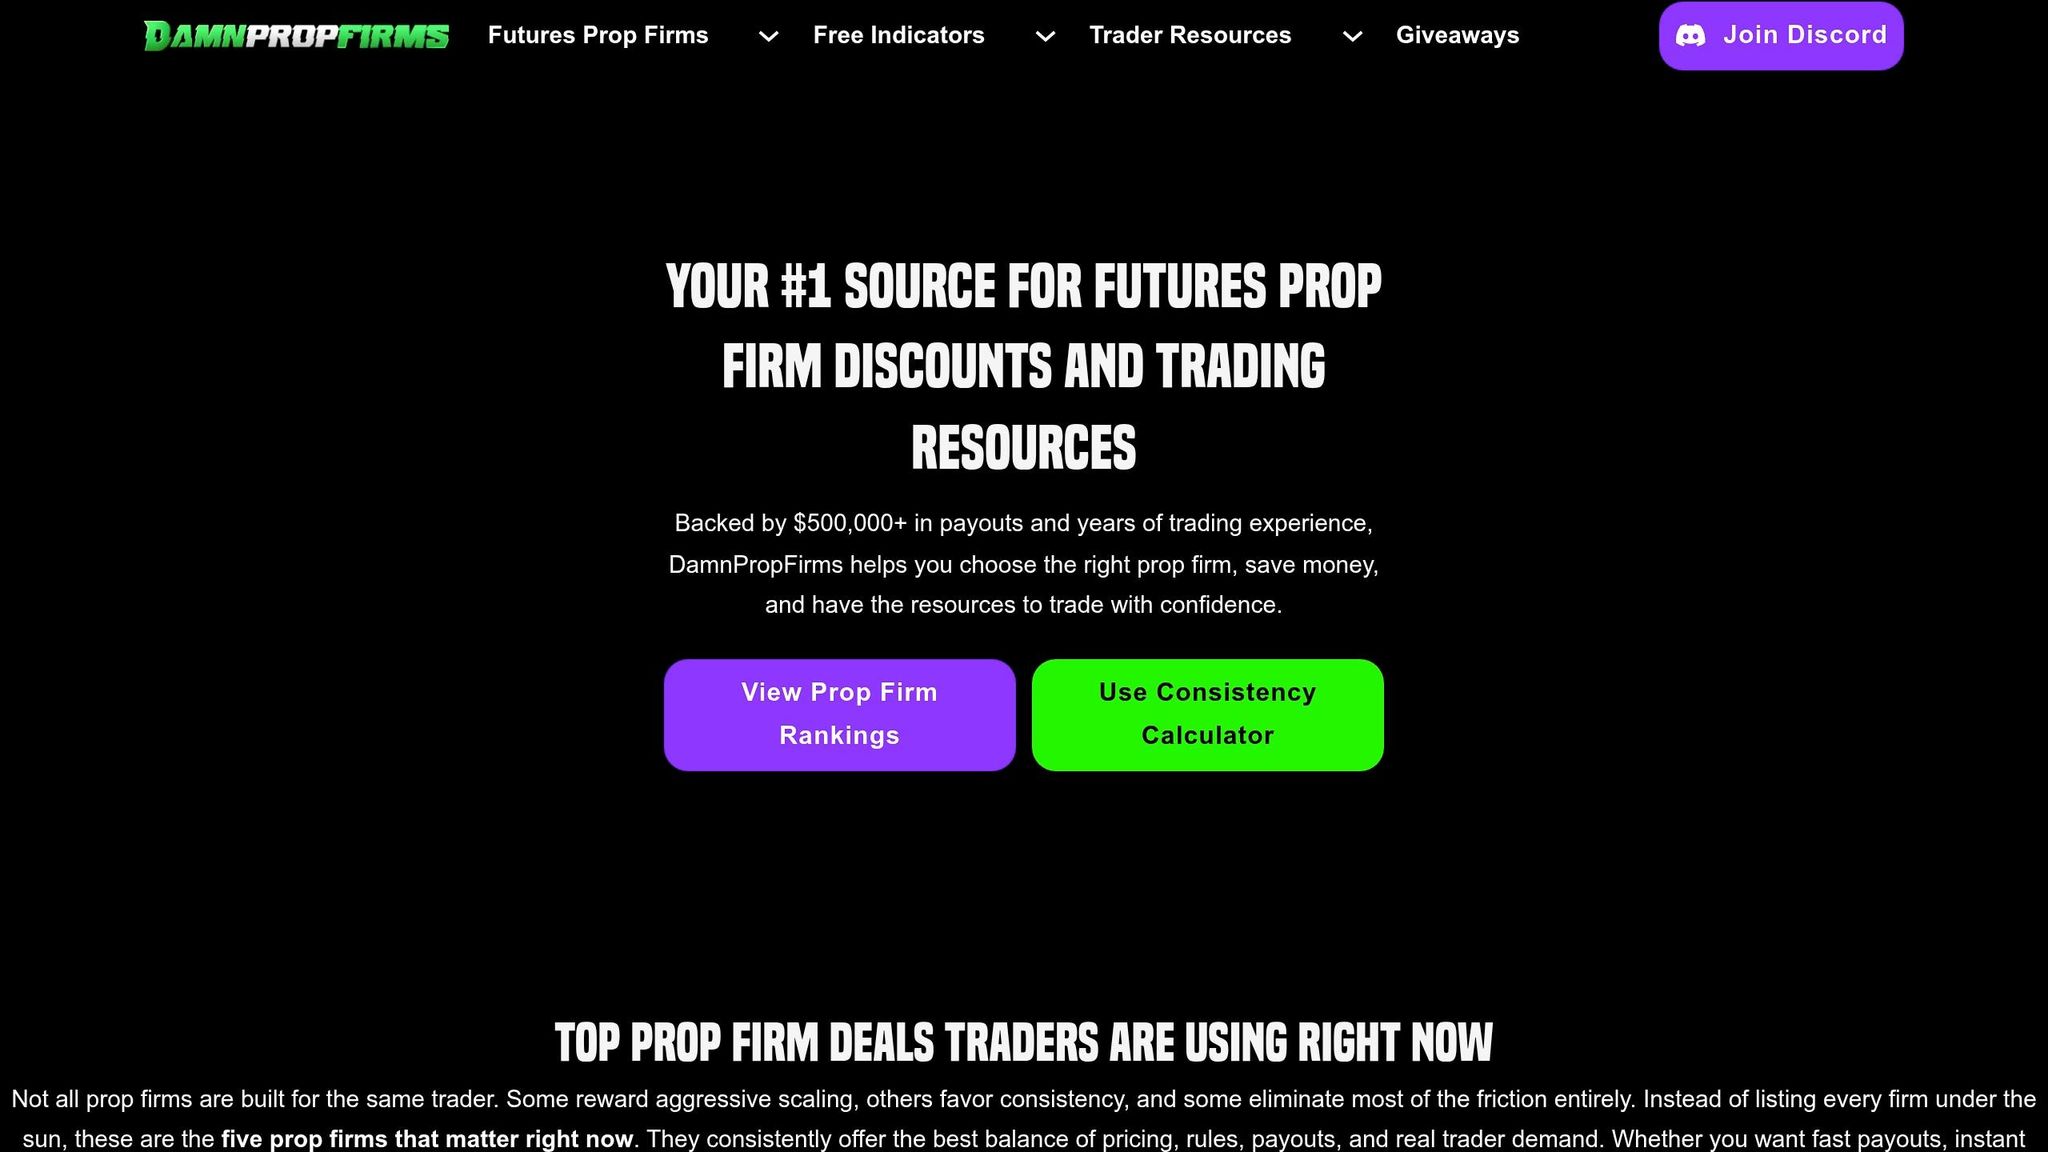
If you’re looking to trade volume clusters with funded capital, DamnPropFirms is a must-check. They’ve got verified reviews of leading futures prop firms like Apex Trader Funding, Topstep, TakeProfitTrader, and FundedNext Futures. Plus, they offer discount codes that can save you 40–80% on evaluation accounts. Many of these firms work with advanced platforms like Quantower, ATAS, and Sierra Chart, which are perfect for footprint and volume cluster analysis [4].
They also provide a Consistency Rule Calculator to help you manage profits and stick to the risk rules specific to each firm. If you’re targeting firms like Tradeify, Lucid Trading, or Alpha Futures, DamnPropFirms breaks down the rules, payout structures, and platform compatibility so you can pick the one that fits your trading style. They’ve got everything you need to pair the right prop firm with your volume cluster game.
Official Educational Resources
For a solid foundation in futures and volume trading, check out CME Group (cmegroup.com/education). They offer detailed guides on liquid contracts like ES, NQ, CL, and GC – key markets for volume cluster analysis [1]. Also, the National Futures Association (nfa.futures.org) is worth a visit for regulatory advice and safety tips. Before you go live, make sure you’re familiar with their resources. These tools will help you turn your volume cluster insights into actionable strategies in the markets.
FAQs
How do I tell absorption from a breakout on a footprint chart?
To tell the difference between absorption and a breakout on a footprint chart, pay close attention to volume and how the price behaves at key levels. Absorption happens when there’s a lot of volume, but the price barely moves. This usually means big players are soaking up orders without letting the market shift much. A breakout, on the other hand, comes with a sharp price move past support or resistance, combined with a spike in volume. This shows strong buying or selling pressure breaking through the absorption.
What tick size and imbalance ratio should I use for ES vs. NQ?
When it comes to tick size and imbalance ratios, these settings should match the liquidity and volatility of the instrument you’re trading. For ES (E-mini S&P 500), which tends to be less volatile, go with larger tick sizes and higher imbalance ratios. This approach helps you zero in on the major volume clusters. On the flip side, NQ (E-mini Nasdaq 100) is more volatile, so you’ll want to stick with smaller tick sizes and lower imbalance ratios to pinpoint the finer details of order flow. Always tweak these settings to fit your trading strategy, and test them to see what delivers the best results for your style.
How can I use the POC and HVNs to plan entries and stops?
You can use the POC (Point of Control) and HVNs (High Volume Nodes) on footprint charts to spot key trading levels. The POC shows the price where the most volume traded, while HVNs highlight zones of heavy volume that often act as support or resistance.
These levels are great for planning trades. Look to enter near them for solid risk-reward setups, and set your stops just beyond these areas to handle any price fluctuations.