The DOM is a timing tool, not a magic signal. It shows who’s sitting on the bid, who’s parked on the ask, and whether that liquidity is holding, getting hit, or vanishing right before price touches it. If you already use charts for levels, you’re in the right place. I’m going to strip this down to what matters: what the ladder is showing, which patterns matter in the moment, and how to use that read for entries, exits, and scratches without getting hypnotized by every flicker.
Bookmap Order Flow Context Composite View of the DOM, Time & Sales, and Price Action with Bruce
Table of Contents
- What Does the Depth of Market Show in Futures Trading?
- How to Read the DOM Ladder
- How Market Orders and Limit Orders Interact on the DOM
- DOM Patterns to Watch in Real Time
- How to Use the DOM for Better Entries and Exits
- Real-Time DOM Examples Traders Can Use
- DOM Reading Mistakes That Cost Traders Money
- Bottom Line
Introduction
The DOM is an execution tool. It helps you time entries, exits, and scratches with more precision than a chart by itself. But that only works if you can read the ladder the right way.
In ES, it’s normal to see hundreds of contracts sitting at one price during the U.S. cash session. In NQ, that same price might show only 10 to 20 contracts. That’s a big part of why NQ snaps around faster and feels harder to read than ES. Less depth. More jumpy movement. On short-term trades, that matters.
That’s why the ladder matters. The chart shows the level. The DOM shows the fight at that level.
Use the chart to decide where you want to trade, and use the DOM to decide when to pull the trigger.
This guide breaks down how to read the ladder, track live order flow, and use the DOM to time entries and exits in liquid futures like ES, NQ, and CL. First up: the bid, ask, and size columns.
What Does the Depth of Market Show in Futures Trading?
The DOM is the live ladder view of resting bids and asks at each price level. Charts show structure. The DOM shows near-term liquidity and execution pressure.
Next, break the ladder into bid, ask, and spread.
DOM vs. the Order Book
The DOM is the order book shown in ladder form. You’ll usually see the bid column on the left, the price axis in the middle, and the ask or offer column on the right [1][3]. Time and Sales shows what already traded. The DOM shows resting liquidity sitting there right now [1][3].
With the book defined, the next step is reading the ladder level by level.
Why DOM Matters for Short-Term Liquidity
Thicker books slow price. Thinner books let market orders punch through levels faster.
That matters a lot if you trade short-term. A thick book can act like a speed bump. A thin book can feel like price is falling down a staircase with missing steps.
Where Traders Use the DOM
DOM matters more when the book is deep and active. That’s why traders lean toward different futures contracts depending on the tape and how much movement they want to deal with.
| Instrument | Liquidity Profile | DOM Personality |
|---|---|---|
| ES (E-mini S&P 500) | Deep, thick | Deep; methodical; level defense is easier to see |
| NQ (E-mini Nasdaq-100) | Thin, volatile | Thin; fast; price can jump through empty levels |
| CL (Crude Oil) | Moderate depth | Moderate depth; catalyst-driven |
Source: [1]
How to Read the DOM Ladder
The DOM ladder is a vertical price ladder. You’ve got three main columns: bid on the left, price in the middle, and ask on the right [1][3]. Start there. Get those columns straight before you try to read the action at the inside market.
Bid, Ask, and Price Columns
The bid column shows resting buy limit orders sitting below the current market price. The ask column shows resting sell limit orders sitting above it. The price column is the anchor in the middle. Some DOMs also include executed volume in the center or in a separate column [3][2]. Simple version: the side columns show resting liquidity, while the center tells you what already traded.
That displayed size never sits still for long. Orders get added, pulled, and filled constantly.
Inside Bid, Inside Ask, and Spread
Once the columns make sense, the next thing to read is the inside market. The inside bid is the highest price a buyer is willing to pay right now. The inside ask is the lowest price a seller is willing to take [4]. Those two prices sit next to each other near the middle of the ladder, and the gap between them is the spread.
A tight spread usually means there’s active liquidity. When the spread gets wider, liquidity has dried up or volatility has kicked in. Market buys lift the ask. Market sells hit the bid [4][3]. And yeah, a wide spread is how you get slapped with more slippage.
What Size at Each Level Actually Means
The size you see on the DOM is resting limit liquidity. It is not a promise that buyers or sellers will defend that level [3][1]. Big displayed size does not automatically mean support or resistance. The only thing that matters is what that size does when price gets close.
Here’s the read:
- If size holds or builds as price approaches, that points to actual conviction.
- If size disappears right before price gets there, that’s often a liquidity vacuum dressed up as support or resistance [1].
- Big orders that stay on the book and absorb incoming market flow are the ones worth watching.
Next, see how market orders consume resting bids and offers on the ladder.
How Market Orders and Limit Orders Interact on the DOM
The DOM ladder shows resting bids and asks at each price level. That’s the parked liquidity. Price moves when market orders slam into that liquidity and chew through it. If you trade off the ladder, this is the whole game. You’re watching who’s sitting there, who’s getting hit, and how fast those levels disappear.
What Happens When a Market Buy or Sell Hits the Book
A market buy takes the best ask first. If there isn’t enough size there to fill the whole order, the rest spills into the next ask, then the next if needed. A market sell does the same thing on the bid side. It hits the best bid first, and if that size gets cleared out, it moves lower.
On the ladder, that’s the push and pull you’re reading in real time. Resting limit orders sit there. Market orders come in and force the issue.
Why Thin Liquidity Moves Price Faster
Thin depth near price means less resting size to chew through. So when a decent market order comes in, price can jump to the next level fast. Sometimes two or three ticks go in a blink.
Thick depth slows that down. There are more resting limit orders in the way, so price has to trade through more size before the ladder shifts. That’s where DOM reading gets interesting. You start to spot whether size is getting absorbed, whether orders are getting pulled before they trade, or whether the move is just ripping straight through with continuation.
A thin book tends to move fast. A thick book tends to make price work.
How Order Entry Works on DOM Platforms
Most DOM platforms let you place orders straight from the ladder. You click the bid or ask column at a price level to park a limit order there. For market orders, you’re hitting into the current best bid or ask and taking what’s available.
The reason traders like DOM entry is simple: it’s fast, direct, and tied to the exact price levels you’re watching. If you scalp, that matters. A lot.
sbb-itb-46ae61d
DOM Patterns to Watch in Real Time
DOM Trading Patterns: Stacking, Pulling & Absorption Explained
Once you understand how market and limit orders clash, the next step is reading the ladder for patterns that show up again and again. The DOM changes every tick, so if you stare at every flicker, you’ll just fry your brain. Most of the noise doesn’t matter. What does matter is absorption, pulling, stacking, and spoof-like behavior. Start with absorption. Then pay close attention to how size shows up and disappears near the inside market.
Absorption
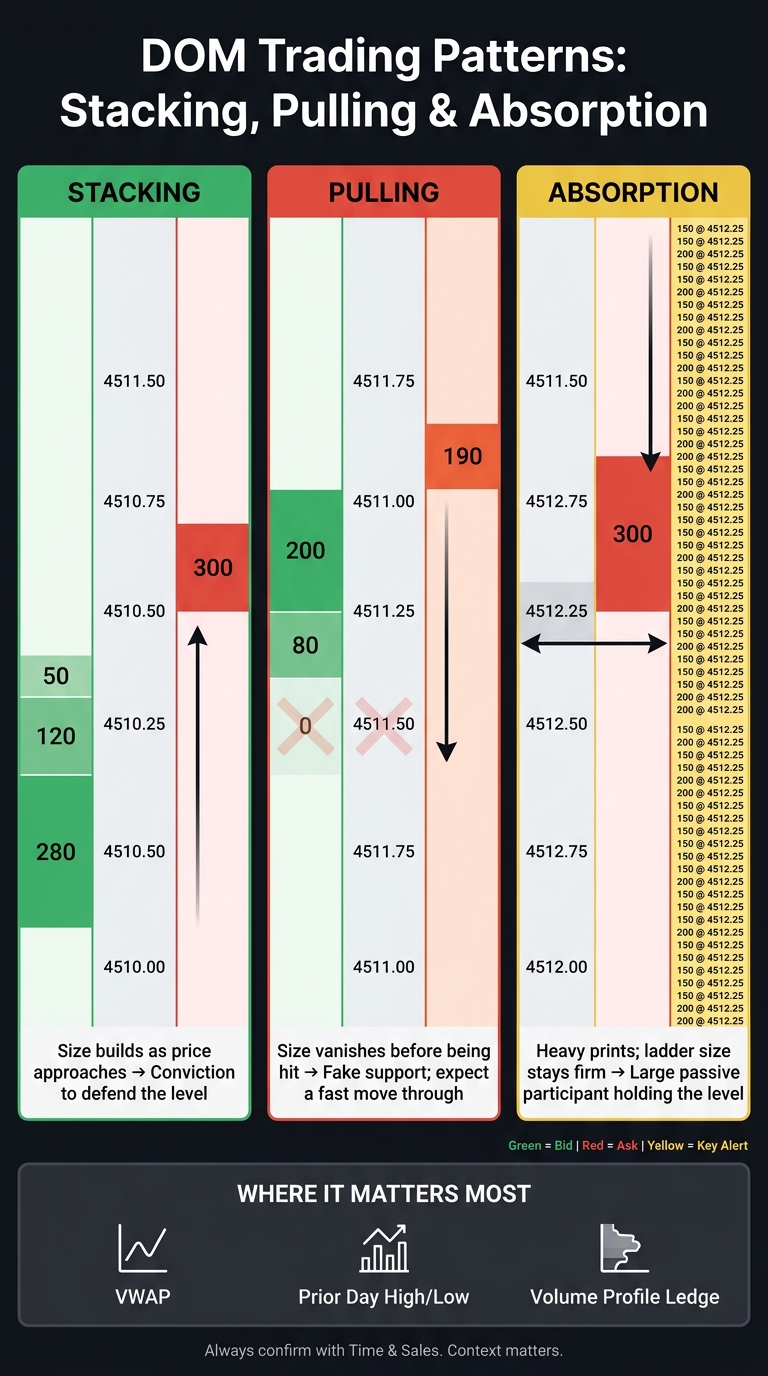
Absorption happens when aggressive market orders keep hitting one price, but price just won’t move. On Time & Sales, you’ll see repeated prints at the same level while the displayed size on the DOM barely changes. That’s the tell. If hundreds of contracts trade at one price and the bid size stays flat, there’s a good chance a passive participant is refilling that level as fast as it gets hit. In NinjaTrader’s SuperDOM, the middle column shows executed trades, which makes this easier to spot in real time. [1][3]
Absorption matters most when it shows up at a level that already means something. Think VWAP, the previous day’s high or low, or a key Volume Profile ledge. At that point, you’re not just seeing orders trade. You’re seeing whether liquidity is still holding the line or getting chewed through quietly.
Pulling and Stacking
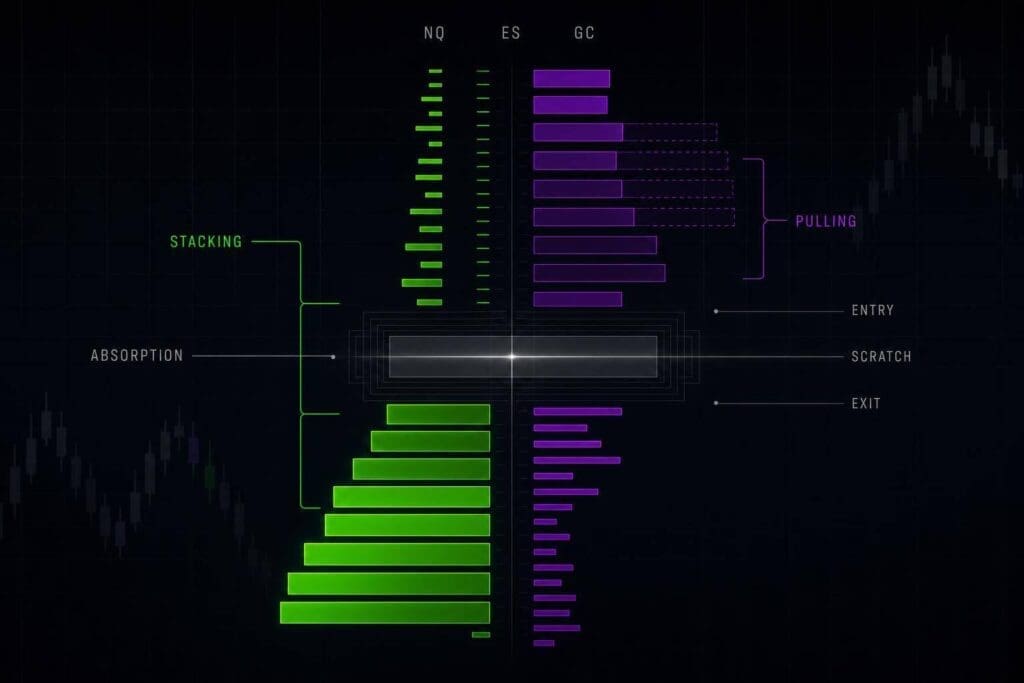
Stacking is simple: size builds at a bid or ask as price gets close, which suggests traders want to defend that area. Pulling is the flip side. Orders get canceled as price approaches, and the size shrinks or vanishes. When that happens, the ladder can turn thin fast. Less resting liquidity means price can rip through those empty levels in a hurry.
| Pattern | What You See on the Ladder | What It Suggests |
|---|---|---|
| Stacking | Size increases as price approaches | Conviction to defend the level |
| Pulling | Size shrinks or disappears before being hit | Lack of conviction; expect a fast move through |
| Absorption | Heavy tape volume; ladder size stays firm | Large passive participant holding the level |
Don’t read these in a vacuum. Stacking at a random level in the middle of nowhere isn’t the same as stacking right under prior highs. Context matters. A lot.
Spoof-Like Behavior
Big orders don’t always mean much. Sometimes a large wall of size shows up a few ticks away from the market, grabs attention, and disappears the second price gets close. That’s spoof-like behavior, and the whole point is to bait traders into leaning one way. [1]
If size keeps pulling or shifting away as price approaches, treat it like bait. Not confirmation. If the order stays put and trades actually start printing into it, that interest is more likely real.
Use spoof-like behavior as context. Not as an entry trigger.
How to Use the DOM for Better Entries and Exits
Once you can read stacking, pulling, and absorption, the DOM stops being just a flashing ladder. It becomes a timing tool. That’s the job here: use it to decide when to get in, get out, or scratch the trade when the level isn’t doing what it should.
Timing Entries Around the Inside Market
Don’t smash a market buy straight into a big resting sell wall unless aggressive buyers are already chewing through it. If that wall holds, you’re buying right into absorption and handing yourself a bad entry.
A better read is this: as price moves toward support, watch whether bids hold or start to build. That kind of stacking tells you passive buyers are stepping in with intent. Different story if bids keep getting pulled while price drops. That’s a vacuum. Thin books move fast, and price can slice through levels before you get a clean reaction.
Heavy prints hitting the bid while displayed size doesn’t change often point to absorption. If that’s the flow on the tape, trade with it, not against it. [1]
Managing Targets, Stops, and Scratches
Put targets just in front of visible liquidity. If there’s a big resting sell order above, setting your target a few ticks ahead of it gives you a better shot at getting filled before price stalls or snaps back. [1][3]
Stops belong just outside liquidity that matters. If that wall gets eaten through or pulled, the trade idea is dead. No need to overthink it. [2]
Scratches need to be fast. If you got long because bids were stacking and then those bids vanish as price gets there, get out at or near breakeven if you can. Waiting for the full stop after the reason for entry disappears is just donating. The level failed. [1]
Pairing the DOM with Your Chart
The chart tells you where the level is. The DOM tells you if that level is doing its job.
Mark the level on the chart first. Then use the DOM to time the entry or exit. If you see stacking, absorption, or pulling at that spot, you get a much cleaner read on whether the level is holding or starting to crack. [1]
Real-Time DOM Examples Traders Can Use
Use these snapshots to turn absorption, pulling, and stacking into live trade decisions. This is what those patterns look like when the ladder is flying.
Absorption at a Nearby High or Low
Picture ES pushing into a nearby level during the U.S. cash session, like the prior day’s high. Buyers keep lifting the ask with market orders, and the tape keeps printing size at that same price. But the ladder barely budges. The visible ask keeps refilling instead of clearing out.
That’s absorption. Buyers are pressing, but price isn’t going anywhere and the ask keeps reloading. Read that as defense, not breakout fuel. Don’t chase the move. Wait.[1][3]
Pulling Before a Fast Move
Now switch to NQ. Price is coming into a bid that looks like support. Then the size starts to dry up. Hardly anything trades there, but the displayed liquidity keeps disappearing. By the time price gets to the level, the bid is gone.
That’s pulling. If the size disappears before price even touches it, that bid was fake support. In a thin book, that often leads to a fast flush through empty levels. If you’re long and the bid you were leaning on suddenly vanishes, scratch the trade right away. Don’t sit there hoping.[1][3]
Stacked Size Breaking and Price Accelerating
Back to ES. Sellers stack size above price, and buyers keep hitting into it. Price stalls while the tape shows repeated aggression at the same ask.
Once that wall gets eaten, price can jump into the next size cluster. If the wall breaks or gets pulled, act fast. Set your next target at the next visible pocket of size, not some fixed tick target.[1]
DOM Reading Mistakes That Cost Traders Money
Once you know the common DOM patterns, the next job is cutting out the bad reads that warp them. Most DOM mistakes come from treating noise like signal. That screws up the exact things you’re trying to spot: absorption, pulling, and stacking.
Treating Displayed Size as Confirmed Support or Resistance
Displayed size is not proof. It can be spoofed, pulled, or masked by iceberg behavior. Use Time and Sales to check whether that size is getting hit or disappearing.[1]
If 500 contracts print at a level but the displayed bid still shows 25, that can be an iceberg buyer.[1] If the size disappears before price even gets there, that level was likely pulled, not holding as actual support or resistance.[1] Simple point: confirmation beats size by itself.
Reacting to Every Flicker on the Ladder
The ladder is always moving. Most of that movement means nothing. What matters is size that stays put as price gets close, and the clearest tells usually show up at the inside market, not five levels deep in the book.[1]
If you react to every flicker, you’ll overtrade. Fast. Watch what holds, what gets pulled, and what actually gets consumed. That’s the stuff that matters. In thin or fast markets, the noise gets worse.
Ignoring Session Conditions and Volatility
Fast sessions make static DOM reads less dependable.[2] A bid that looks solid in a quiet session can disappear in a second during a fast market or a data release.[1] NQ often shows only 10 to 20 contracts per level, which makes the book thinner and tougher to read.[1]
So yeah, the same ladder shape can mean very different things based on volatility and liquidity. Context is what stops the DOM from lying to you.
Bottom Line
Once you’ve read the ladder, the job shifts to execution. That’s where the DOM earns its keep. It shows the live inside market, so you can time entries, exits, and trade management with a lot more precision than a chart alone.
Focus on what’s happening at the inside bid and ask. Watch for stacking, absorption, and size that pulls before price even gets there. That stuff matters. It tells you whether buyers or sellers are still standing firm, or if they’re faking interest and backing off.
The DOM should confirm a chart level, not replace it. Mark your level on the chart first. Then use the DOM to see if order flow lines up with the trade. If the level looks good on the chart but the ladder says buyers are getting stuffed or sellers keep reloading, take the hint.
If order flow shifts, shift with it. Tighten the stop, move the target, or just scratch the trade and get out. That’s the whole point of the DOM: timing, confirmation, and trade management. Not prediction.
FAQs
Can beginners use the DOM without overtrading?
Yes, if they use the DOM as an execution tool, not the only thing they trust.
That’s the key. The DOM gives you fast, tick-by-tick detail, but that speed can mess with newer traders. Stare at the ladder too long and every little move starts to look like a setup. That’s how you get impulsive entries, late chases, and revenge clicks after a loss.
New traders should learn market structure first on standard charts. Get used to price context. Know where the market is rotating, where it’s breaking, and where it’s just chopping people up. Then bring in the ladder to fine-tune execution.
A trading journal helps too. Not the fluffy kind. A real one that shows patterns in your behavior, like:
- chasing price after the move already happened
- overtrading after a red trade
- clicking just because the DOM got busy
Used that way, the DOM can help. Used by itself, it can bait beginners into bad habits fast.
How do I spot real absorption from spoofing?
Absorption is when aggressive market orders keep slamming into a big passive limit order, but price just sits there. You’ll usually see heavy volume and fast tape while the ladder refuses to budge at a key level.
Spoofing is a different animal. The big order gets pulled or shifted once price comes near it. That’s a tell: the order was likely there to bait traders, not to take fills.
Which futures markets are easiest to read on the DOM?
ES is the easiest market to read on the DOM for most traders. The reason is simple: it has deep liquidity and a cleaner, more orderly price structure, especially during the U.S. cash session.
Other markets behave differently. ZN has massive depth. CL can print clean directional moves and often shows clear institutional participation. NQ and GC are usually thinner and more jumpy, which makes them tougher for newer DOM traders than ES.