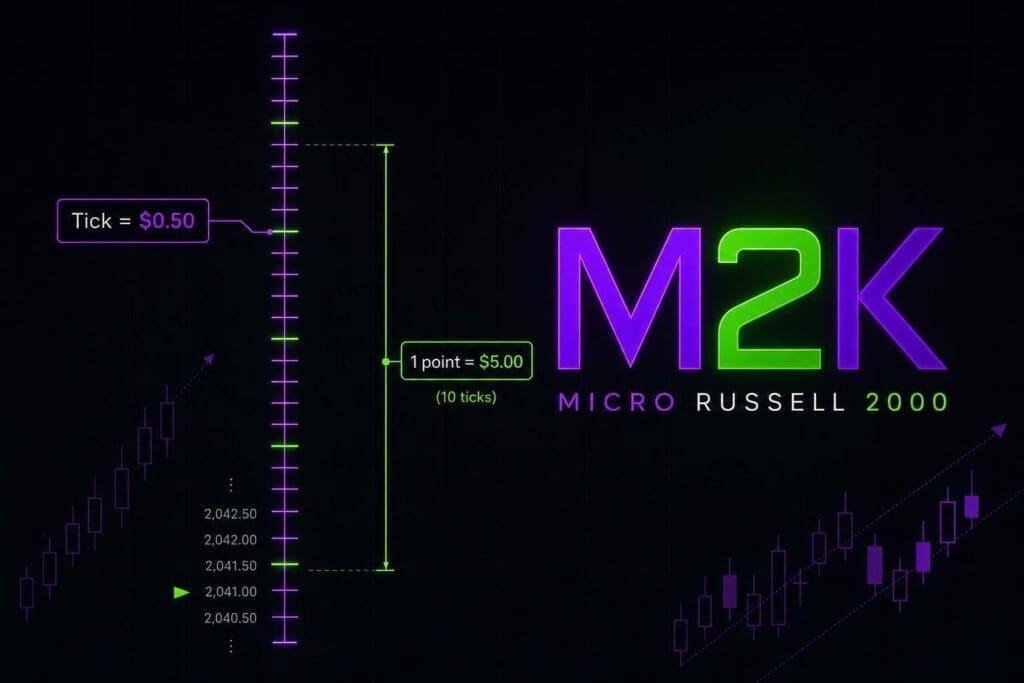
M2K is simple on paper: $0.50 per tick, $5.00 per point, per contract. That’s the number you need before you set a stop, stack contracts, or flirt with a drawdown limit. If you trade micros, this is the part that keeps your risk math clean.
I’ll keep it tight here. You’re in the right place if you want the contract specs that matter, the dollar math behind M2K moves, and the risk numbers you should know before clicking buy or sell. No fluff. Just the contract, the math, and what it means for sizing.
Trader’s Edge: Using Micro E-mini Equity Futures for Precision Trading
sbb-itb-46ae61d
Introduction
The Micro E-mini Russell 2000 (M2K) is a CME Globex futures contract tied to the Russell 2000 Index. The part that matters fast is the $5 multiplier. That’s what turns index movement into actual dollars, so every point and tick hits your P&L in a clean, direct way. The risk math below comes straight from those contract specs. [1][2]
M2K has quarterly expirations in March, June, September, and December. It’s cash-settled, which means no shares get delivered when the contract expires. [1][3]
Trading runs from Sunday at 6:00 p.m. ET to Friday at 5:00 p.m. ET, with the usual 5:00 p.m. to 6:00 p.m. ET daily maintenance break. [2]
Next up: contract specs, P&L math, and how to turn ticks and points into dollar risk. This is a core component of scaling funded accounts safely.
Table of Contents
- What Is the M2K Tick Value?
- Official M2K Contract Specs
- How M2K Price Movement Converts Into Profit and Loss
- How to Calculate Risk, Stop Distance, and Position Size on M2K
- How M2K Fits Into Futures Prop Trading
- Bottom Line
What Is the M2K Tick Value?
One M2K tick is worth $0.50 per contract[1]. If the Micro E-mini Russell 2000 moves one tick, your open trade gains or loses exactly fifty cents per contract.
M2K Tick Size, Tick Value, and Point Value
M2K moves in 0.10-point steps. One tick is $0.50. A 1.0-point move is 10 ticks, which means $5.00 per contract[1]. The contract uses a $5 multiplier, so every 1.0-point move changes your P&L by $5.00 per contract.
| Unit | Size | Dollar Value |
|---|---|---|
| 1 Tick | 0.10 index points | $0.50 |
| 1 Full Point | 1.0 index point | $5.00 |
| 10 Points | 10.0 index points | $50.00 |
Why M2K Tick Value Matters for Prop Traders
This is where M2K gets useful for prop traders. Risk rules always come back to dollars. If each tick is only $0.50, it’s easier to fine-tune risk without chewing through your drawdown buffer too fast.
Say you’re trading a $50,000 evaluation account with a $2,000 drawdown limit. A 10-point move against you on one M2K contract costs $50. That’s only 2.5% of the total drawdown buffer[1]. That smaller tick value gives you more room to use a wider stop while still staying inside a fixed dollar risk cap.
Next, use those numbers to read the full CME contract specs.
Official M2K Contract Specs
CME’s core M2K specs are below[2].
| Specification | Detail |
|---|---|
| Exchange | CME (CME Globex) |
| Symbol | M2K |
| Underlying Index | Russell 2000 |
| Multiplier | $5 per index point |
| Tick Size | 0.10 index points |
| Tick Value | $0.50 |
| Point Value | $5.00 |
| Settlement | Cash |
| Contract Months | March (H), June (M), September (U), December (Z) |
| Trading Hours | Sun–Fri, 6:00 PM – 5:00 PM ET |
Exchange, Symbol, Underlying Index, and Settlement
The table gives you the basics: exchange, symbol, underlying index, and how the contract settles. The part that matters most at expiration is this: M2K is cash-settled, so no shares change hands[2].
Contract Size, Notional Value, and Contract Months
Each M2K point is worth $5 per contract[2][3]. So if M2K is trading at 2,200, one contract gives you $11,000 in notional exposure. That number matters because it sets the scale for your risk.
M2K trades on the standard quarterly cycle: March, June, September, and December[1][3]. Most traders stick with the front-month contract because that’s usually where volume is best and spreads are tighter[1].
Trading Hours, Expiration, and Margin Notes
CME Globex lists M2K from Sunday through Friday, 6:00 PM to 5:00 PM ET, with a one-hour daily maintenance break starting at 5:00 PM ET[2][3]. M2K expires on the third Friday of the contract month[1].
CME-required initial margin for M2K is about $1,191.30 as of July 2026[2].
With the specs locked in, the next section turns M2K movement into dollar P&L.
How M2K Price Movement Converts Into Profit and Loss
This is the part that turns chart movement into actual dollars.
For M2K, the math is simple: P&L per contract = signed ticks × $0.50 or signed points × $5.00. [1][2][3]
If you’re long, up ticks mean profit and down ticks mean loss. If you’re short, it’s the opposite. Either way, the contract math stays the same.
Basic P&L Formulas for M2K
Long or short, P&L per contract = signed tick move × $0.50 or signed point move × $5.00.
Same rule every time. No fancy spreadsheet needed.
Worked Examples Using Ticks and Points
12-tick move (long): You buy 1 M2K contract and price moves up 1.2 points. That’s 12 ticks, so the math is 12 × $0.50 = $6.00.
5-point move (short): You sell 1 M2K contract and price drops 5.0 points. That gives you 5.0 × $5.00 = $25.00.
10-contract example: If you’re holding 10 contracts and M2K moves up 5.0 points, the math is 10 × 5.0 × $5.00 = $250.00.
This is why contract count matters so much. A move that looks small on the chart can get expensive fast once you size up.
M2K vs RTY Tick Value
| Feature | M2K (Micro) | RTY (E-mini) |
|---|---|---|
| Tick Size | 0.10 points | 0.10 points |
| Tick Value | $0.50 | $5.00 |
| Point Value | $5.00 | $50.00 |
| Multiplier | 5 | 50 |
Here’s the big one: a 5-point move pays $25.00 on 1 M2K contract, but $250.00 on 1 RTY contract.
That 10x jump changes everything. Size, risk, and margin all hit harder on RTY, even though the chart move is the same.
These dollar values feed straight into stop distance and position sizing.
How to Calculate Risk, Stop Distance, and Position Size on M2K
Once you’ve got the $0.50 tick value and $5.00 point value locked in, the next job is simple: turn your stop distance into actual dollar risk.
Dollar Risk Per Trade Formula
You can calculate risk with ticks or points. Same result either way.
Dollar risk = ticks × $0.50 × contracts, or points × $5.00 × contracts
A couple of quick examples:
- 10 points on 1 contract = $50
- 5 points on 3 contracts = $75
In prop accounts, size your trade to the drawdown limit, not the account balance.[1]
Position Sizing Examples With Fixed Risk Budgets
If you want to know how many contracts you can take, just flip the formula:
Position Size = Risk Budget ($) ÷ (Stop Distance in Ticks × $0.50) [1][3]
Then round down to the nearest whole contract.[3]
Risk Table Mapping Points, Ticks, and Dollars
Use this table before the trade, not after. It makes sizing dead simple.
| Stop Distance (Points) | Stop Distance (Ticks) | Dollar Risk (1 Contract) | Max Contracts ($50 Budget) | Max Contracts ($100 Budget) |
|---|---|---|---|---|
| 1.0 | 10 | $5.00 | 10 | 20 |
| 2.0 | 20 | $10.00 | 5 | 10 |
| 5.0 | 50 | $25.00 | 2 | 4 |
| 10.0 | 100 | $50.00 | 1 | 2 |
| 20.0 | 200 | $100.00 | 0 (Too large) | 1 |
At a 20-point stop, a $50 budget is insufficient for even one contract.
M2K is thinner than ES or NQ, so ultra-tight stops get chopped up more often by noise and slippage. That’s the whole appeal here: the smaller dollar value lets you keep risk tight without getting stupid with size.
How M2K Fits Into Futures Prop Trading
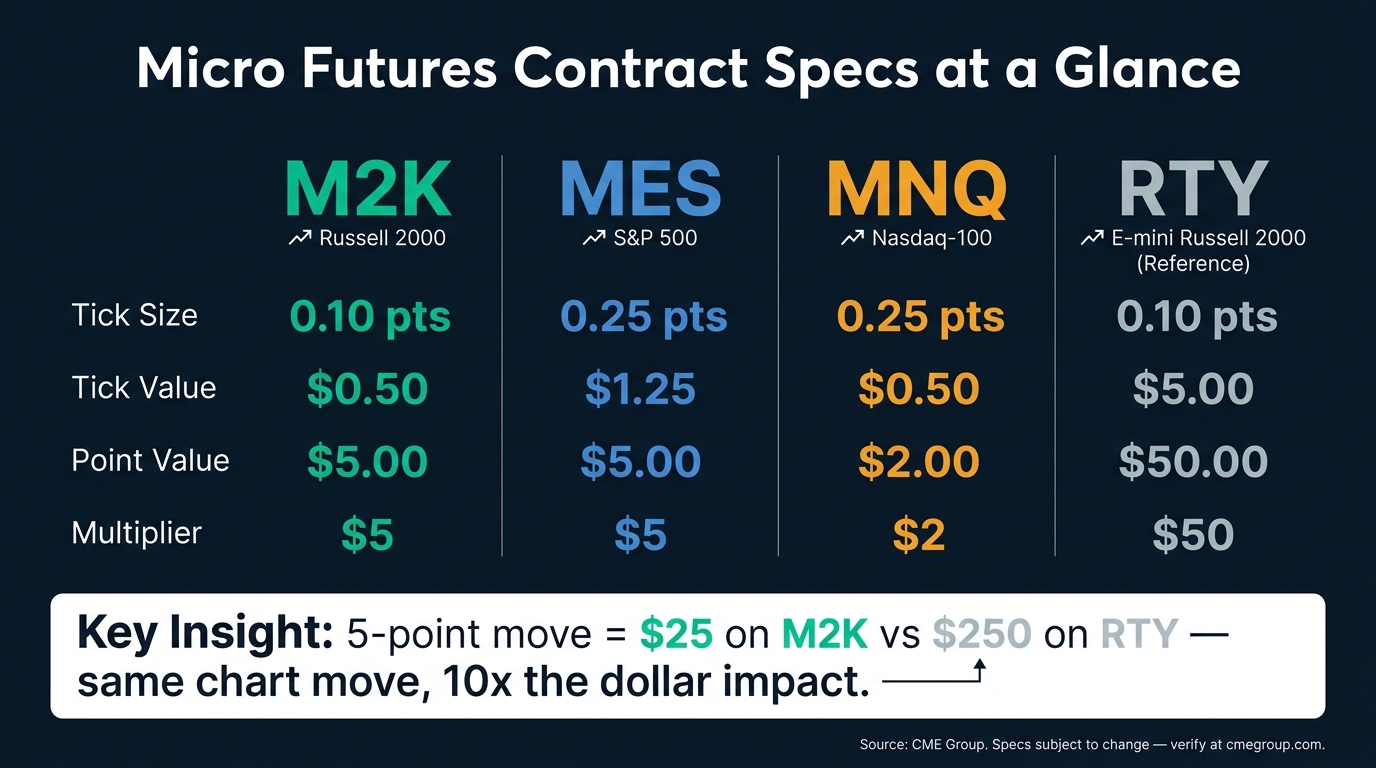
M2K vs RTY vs MES vs MNQ: Micro Futures Contract Specs Compared
Building on the risk math above, M2K earns its spot in prop trading for one simple reason: tighter dollar-risk control. If you’re trading a funded account, that’s the whole game. The smaller contract value makes it easier to scale in and out one or two contracts at a time, keep P&L smoother instead of leaning on oversized trades, and stay inside trailing drawdown limits without blowing a chunk of your risk budget on one move.[1]
Why Traders Use Micro Contracts in Evaluations
M2K lets you trade Russell 2000 price movement with smaller dollar swings than the full-size RTY contract. That lower exposure per tick gives a trade more breathing room before the account floor starts getting squeezed, and it helps with consistency rules by keeping position-level risk easier to map out.[1]
M2K vs MES and MNQ for Drawdown Control
All three micro equity index contracts work off the same basic idea, but they don’t trade the same way.
| Contract | Symbol | Tick Size | Tick Value | Point Value |
|---|---|---|---|---|
| Micro S&P 500 | MES | 0.25 pts | $1.25 | $5.00 |
| Micro Nasdaq-100 | MNQ | 0.25 pts | $0.50 | $2.00 |
| Micro Russell 2000 | M2K | 0.10 pts | $0.50 | $5.00 |
That gap matters. M2K gives you smaller, cleaner risk steps. MES tracks broad large-cap movement. MNQ is the wild one of the three. M2K follows small-cap stocks, and those can split hard from large-cap indexes during risk-off stretches. M2K also trades with less volume than MES or MNQ, so you need a bit more patience on execution.[1]
Use those contract differences to check whether your stop distance actually fits your drawdown rules. Before you trade M2K, run your stop size and contract count through a position-size calculator.
Bottom Line
M2K risk is $0.50 per tick and $5.00 per point.[1]
Before you place a trade, check the current contract specs on cmegroup.com. Then size in dollars, not just by contract count. That’s how you keep every M2K trade tied to current specs and a fixed dollar risk.
FAQs
How do fees affect M2K tick profits?
Fees like commissions and exchange costs come straight out of your net on M2K trades. And since M2K only pays $0.50 per tick per contract, those costs hit harder than they do on bigger contracts.
That’s the part a lot of traders gloss over. A few bucks in round-turn costs doesn’t sound like much until you stack it against a contract with small dollar movement. On M2K, fees can chew up a big chunk of a winning trade fast.
If you trade a lot, this adds up in a hurry. More entries, more exits, more drag on your P&L. Keeping fees down matters because it lets you keep more of those smaller M2K gains instead of handing them back on every trade.
When should I roll an M2K contract?
Roll your M2K contract on the Monday before the third Friday of the expiration month: March, June, September, or December.
M2K expires quarterly, so moving to the new front month by then usually keeps fills cleaner and helps you avoid the usual expiration mess. If you want the exact rollover and expiration dates, check CME.
Why does M2K feel slower than MNQ?
M2K often feels slower than MNQ for three simple reasons: volatility, liquidity, and what each contract is tracking.
MNQ usually snaps around more because the Nasdaq-100 tends to move harder and react faster. You’ll also see quicker liquidity sweeps there, so the tape feels more active.
M2K is tied to small-cap stocks, and that market has a different rhythm. It also tends to carry a wider bid-ask spread, usually 2-3 ticks, while MNQ often sits at a 1-tick spread. That alone can make M2K feel more sluggish, even when it is moving.