Trading Nasdaq-100 (NQ) breakouts can be tricky, with 87% of breakout strategies failing. Many traders fall into common traps like chasing "safe" breakouts, ignoring volume confirmation, or over-leveraging. These mistakes often lead to losses, especially in fast-moving markets like NQ futures. But with the right approach, you can identify real breakouts, manage risk effectively, and avoid falling into these pitfalls.
Key Takeaways:
- Why Traders Fail: FOMO, poor risk management, and misreading technical signals.
- How to Succeed: Confirm breakouts with volume, use proper stop-loss levels, and follow a structured entry/exit plan.
- Risk Management: Limit risk to 0.25%-1% per trade and use tools like ATR for stop adjustments.
- Prop Firm Tips: Stick to daily loss limits, avoid oversized trades, and focus on consistent performance.
This guide simplifies NQ breakout trading with actionable steps to improve your strategy, manage risk, and meet prop firm requirements. Let’s dive in.
Why Many Futures Traders Struggle With Breakout Trading (And How to Approach It)
Why Traders Fail at NQ Breakouts
NQ breakout failures often stem from predictable patterns tied to trader psychology, poor risk management, and missteps in technical analysis. These recurring issues highlight the mental, risk-related, and analytical mistakes that undermine success in NQ breakout trading.
Mental Mistakes That Lead to Losses
One of the most common psychological pitfalls in NQ trading is FOMO, or the Fear of Missing Out. Many traders rush into sharp market moves, only to enter just as the buying pressure starts to fade. As Rayner Teo aptly explains:
"When it feels ‘right’ to buy a breakout, it’s usually the worst thing you can do… in the short-term, the buying pressure is exhausted."
This impulsive behavior often traps traders in a cycle of bad decisions. After taking a loss, some double down by re-entering trades in an attempt to recover their money, which only worsens their results. Another common mistake involves jumping into obvious breakouts alongside the crowd. This inadvertently provides liquidity for professional traders, who then move the market in the opposite direction. For some, trading becomes more about chasing the thrill than waiting for validated setups, which can lead to repeated losses.
Risk Management Errors in NQ Futures
Beyond mindset, weak risk management is another major roadblock. NQ futures are highly volatile, and their leverage magnifies every price movement. Traders often over-leverage, rely on arbitrary stop-loss levels instead of technical ones, and fail to account for slippage during high-volatility periods.
Experienced traders suggest risking no more than 0.25% to 1% of account equity per trade to endure market swings. However, many traders skip setting daily loss limits, which means one bad trading day can wipe out weeks of progress. Emotional attachment to losing positions is another common problem – traders hold on to bad trades, hoping for a reversal, instead of cutting their losses.
The math is straightforward: with a minimum 2:1 reward-to-risk ratio, even a 40% win rate can be profitable. Without proper position sizing and stop-loss discipline, even the most promising strategies are bound to fail.
Misidentifying Real Breakouts
A frequent technical mistake is entering trades based on price movement alone, without confirming volume. True breakouts are usually accompanied by a strong surge in volume. If volume is low, it could signal a lack of institutional involvement, which is a red flag. Another error is entering too early, before a "buildup" – a tight consolidation pattern that signals buying support – has formed.
Legitimate breakouts often feature momentum candles that are 2–3 times larger than previous candles and close decisively beyond a key level. On the other hand, candles that merely "wick" through a level often reverse quickly. False breakouts are especially common in ranging markets, where professional traders may intentionally trigger stop-losses to create liquidity for their own positions in the opposite direction.
Data shows that approximately 87% of breakout strategies fail when they rely on just a single confirmation signal. The difference between falling into a trap and catching a trend lies in discipline and thorough confirmation – waiting for the candle to close, checking volume, and respecting the broader market structure. Understanding these errors is the first step toward adopting the structured approach covered in the next sections.
How to Trade NQ Breakouts: Step-by-Step
NQ Breakout Trading Strategy: 3-Step Confirmation Process
Navigating the challenges of trading NQ breakouts requires a disciplined, systematic approach. The key to avoiding false breakouts and capitalizing on genuine moves lies in following a structured process. This involves multiple confirmations, clear entry and exit rules, and adapting strategies to different timeframes.
Confirm Breakouts with Volume and Patterns
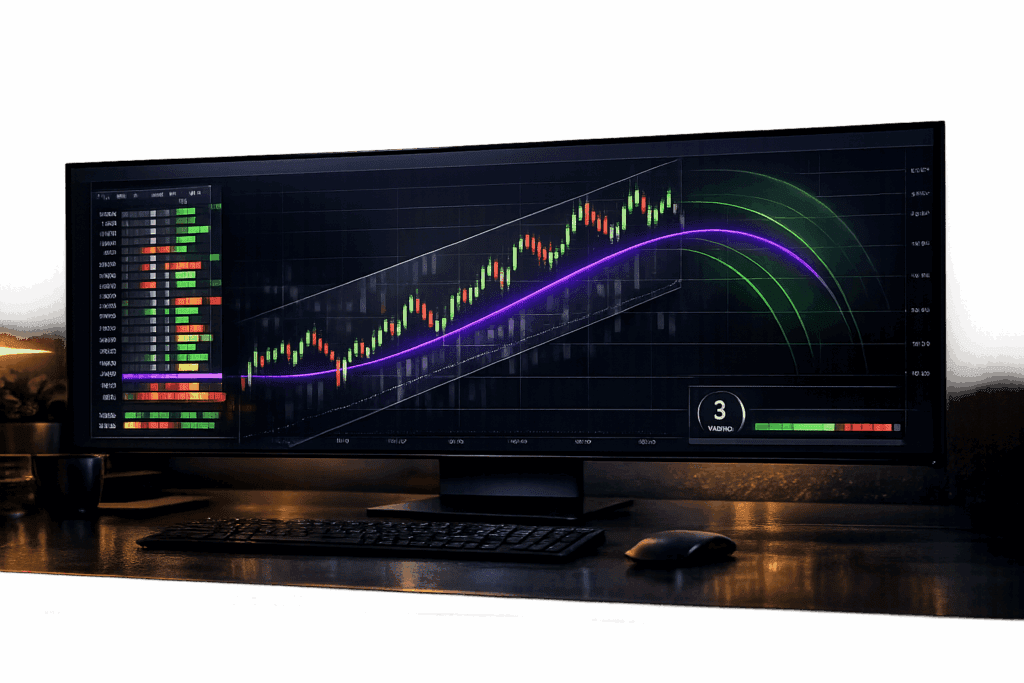
Before jumping into any NQ breakout trade, it’s crucial to confirm the move with multiple signals. Start by analyzing the trend using tools like the 50-period Exponential Moving Average (EMA), the 30-period Simple Moving Average (SMA), or the Volume Weighted Average Price (VWAP). When the price stays above the VWAP, it often signals institutional support for an upward trend. Conversely, a price below the VWAP suggests bearish momentum.
Look for a buildup – a tight consolidation near a key level. This indicates that buyers and sellers are reaching equilibrium before the next significant move. As renowned trader Richard Dennis once said:
"Whatever method you use to enter trades, the most critical thing is that if there is a major trend, your approach should assure that you get in that trend."
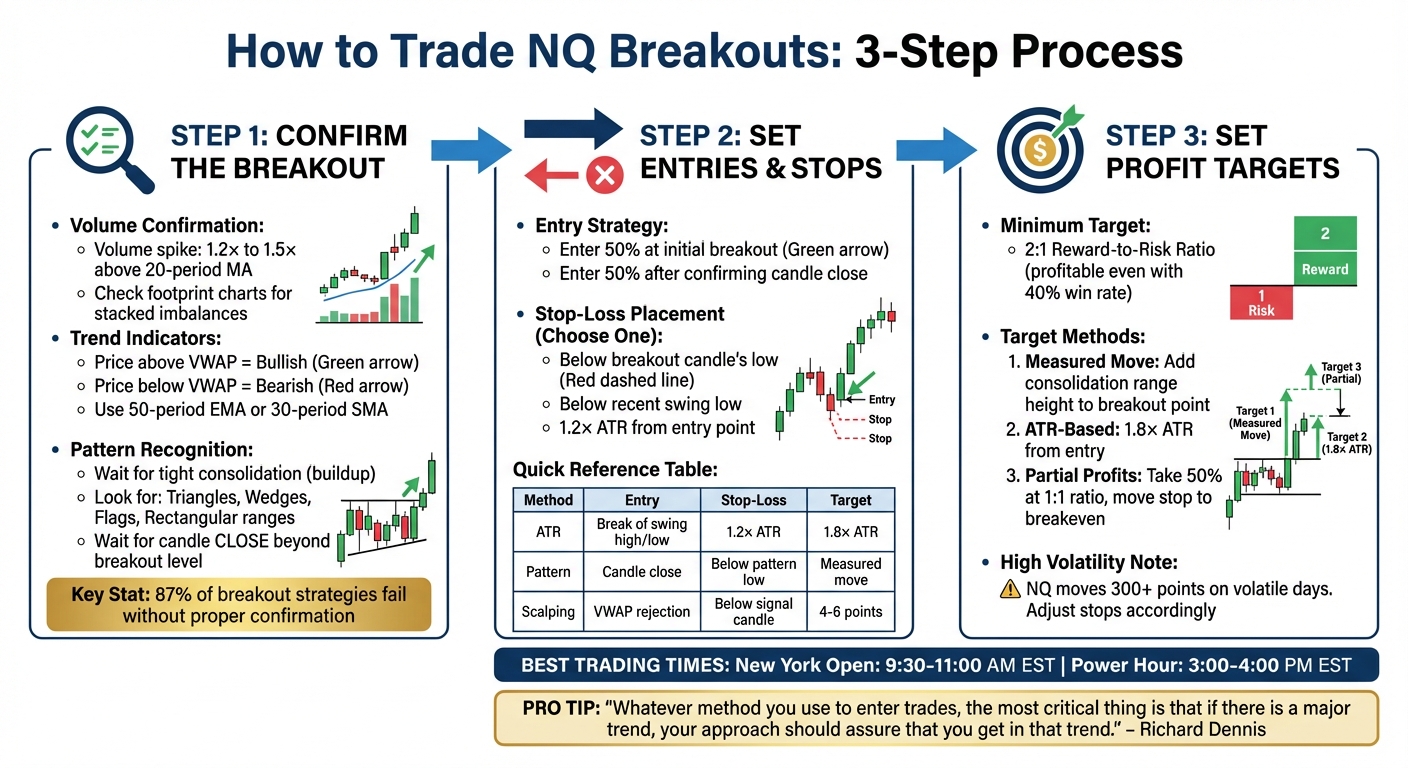
Volume is another critical factor. A legitimate breakout is typically accompanied by a volume spike – 1.2× to 1.5× above the 20-period moving average. Without this surge, the move might lack conviction. Footprint charts can help by showing stacked imbalances, which are clusters of aggressive buying or selling at the breakout level.
Patience is key. Wait for a candle to close beyond the breakout level instead of entering as soon as the price touches it. Watch for specific chart patterns like ascending and descending triangles, wedges, bull and bear flags, or rectangular ranges. The Opening Range Breakout (ORB) strategy is particularly effective for NQ, as the first 30 minutes of the U.S. session often set the tone for the day.
Once you’ve confirmed the breakout, focus on precise execution with well-defined entries, stops, and profit targets.
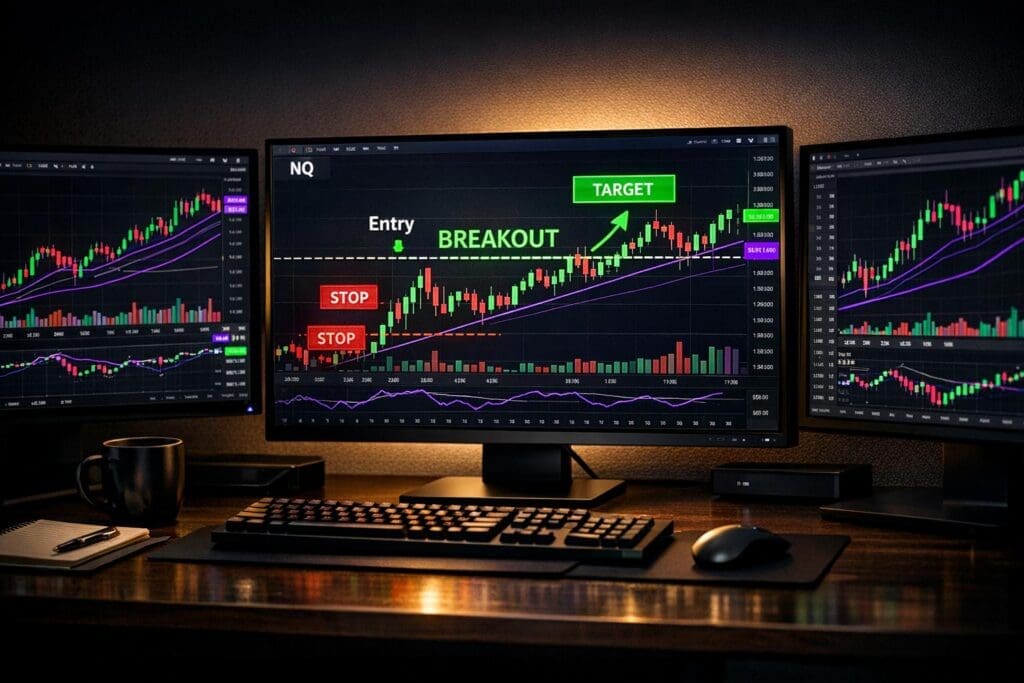
Set Your Entries, Stops, and Targets
Timing your entry is critical to avoid chasing false moves. A good approach is to enter half your position at the initial breakout and the other half after a confirming candle closes beyond the breakout level. This strategy balances the risks of missing a fast move and entering prematurely. As Ed Seykota explained:
"If I were buying, my point would be above the market. I try to identify a point at which I expect the market momentum to be strong in the direction of the trade."
For stop-losses, you can place them below the breakout candle’s low or the most recent swing low. A volatility-adjusted stop uses the Average True Range (ATR) with a 1.2× multiplier from your entry point. Given that NQ often sees moves of 300+ points on high-volatility days, your stops should be wide enough to account for fluctuations without skewing your risk-reward ratio.
Profit targets should aim for at least a 2:1 reward-to-risk ratio, ensuring profitability even with a lower win rate. One method involves using the measured move technique – adding the height of the pre-breakout consolidation range to the breakout point. Alternatively, you can set ATR-based targets with a 1.8× multiplier from your entry. To manage risk, consider taking partial profits at a 1:1 ratio and moving your stop to breakeven.
| Method | Entry Point | Stop-Loss Level | Profit Target |
|---|---|---|---|
| ATR Method | Break of previous swing high/low | 1.2× ATR from entry | 1.8× ATR from entry |
| Pattern Method | Breakout candle close | Below the pattern low | Measured move (pattern height) |
| Scalping Method | VWAP rejection + Order flow | Tight stop below signal candle | 4–6 points or next liquidity zone |
With your entries and risk parameters in place, tailor these principles to fit your chosen timeframe.
Adjust Your Strategy for Different Timeframes
Adapting your breakout strategy to different timeframes is essential for consistent results. Scalpers, for example, should focus on peak NQ volume during the New York Open (9:30–11:00 AM EST) and Power Hour (3:00–4:00 PM EST). Combine VWAP rejections with footprint chart imbalances to pinpoint entries, aiming for quick moves of 4–6 points. Keep stops tight, just below the breakout candle’s low.
Swing traders working on 4-hour or daily charts need a broader perspective. Start by identifying major support and resistance levels on higher timeframes, then zoom into lower timeframes for precise entries. Use a 20- or 50-period EMA to confirm the trend, and set stops 1 ATR below swing lows instead of individual candles. Profit targets should align with previous swing highs or lows on the daily chart.
For example, in early 2023, a back-tested NQ breakout above a previous high resulted in a sustained rally, delivering a 15% gain over two months. This highlights how longer timeframes, while requiring patience, can yield larger rewards.
Regardless of the timeframe, always apply an ATR filter. If the current ATR falls below your minimum threshold, avoid breakout trades – low volatility increases the likelihood of false signals. Using momentum filters across multiple timeframes can also enhance breakout reliability, emphasizing the importance of aligning your strategy with market conditions.
sbb-itb-46ae61d
Risk Management for NQ in Prop Firms
Once you’ve nailed breakout setups, the next step is mastering risk management – especially in the world of prop firms. These firms have strict rules around drawdowns and trading consistency. A single oversized trade or a losing streak can end your evaluation before you’ve even had the chance to let your trading edge shine. Let’s dive into how you can fine-tune position sizing, set effective stop-losses, and meet the requirements prop firms demand.
Position Sizing and Stop-Loss Strategies
Managing your risk per trade is non-negotiable. In prop firms, it’s recommended to risk only 0.25%–1% of your account equity per trade, which helps you stay in the game longer. For example, on a $50,000 account, risking 1% would equate to a $500 stop-loss. If your daily loss limit is 5%, this means you can only afford five consecutive losing trades at 1% risk per trade. Reducing your risk to 0.5% doubles your survival to 10 trades.
Prop Firm Plus emphasizes:
"Stay in the game long enough for your edge to play out over time."
When trading the NQ, consider the 14-day ATR (Average True Range), which recently hovered around $263.87. Use this as a guide to widen your stops to handle NQ’s natural volatility. If risk limits are tight, trade MNQ contracts instead. Since MNQ contracts are 1/10th the size of standard NQ contracts (tick value: $0.50 vs. $5.00), you can set technical stops without exceeding your risk cap. For instance, a 30-point stop would risk $600 on an NQ contract, but only $60 on MNQ.
Always trade with bracket orders. These automatically lock in your stop-loss and take-profit levels as soon as you enter a trade. This automation helps you resist the urge to move stops during volatile market swings. Stick to a three-loss rule: stop trading for the day after three consecutive losses to avoid revenge trading. Also, steer clear of opening positions 5–15 minutes before or after major news events, like FOMC or CPI reports. Slippage during these volatile periods can lead to losses far beyond your expectations.
By following these position sizing and stop-loss strategies, you align your trading approach with the rules and constraints of prop firms.
How to Meet Prop Firm Requirements
Prop firms typically enforce two main rules: drawdown limits and consistency rules. Many firms use a trailing drawdown system, which adjusts upward with your highest equity, including unrealized profits. However, it never moves back down. This can be tricky – if an open trade’s profit raises your drawdown threshold, a reversal could leave you with less margin for error.
As MyFundedFutures warns:
"Prop firms don’t tolerate holding and hoping – a trailing drawdown can wipe you out fast if you move stops."
To stay safe, set a personal daily loss limit that’s 30–50% below the firm’s cap. For instance, if the firm has a 5% daily loss limit, stop trading if you hit 3%. This buffer protects you from slippage and emotional mistakes. If your drawdown reaches -5%, take a week off to reset and refocus.
Consistency rules are just as important. Many firms disqualify traders whose biggest profit day accounts for more than 30–40% of their total earnings. This signals reliance on occasional big wins rather than a steady, repeatable strategy. Tools like the DamnPropFirms Consistency Rule Calculator can help you monitor your daily profits and ensure you’re within the firm’s guidelines. To calculate position size, divide your maximum dollar risk by the product of your stop distance (in ticks) and tick value.
The best prop traders don’t chase massive wins – they focus on preserving capital and executing consistently. By carefully managing risk, leveraging MNQ contracts for finer adjustments, and respecting both firm-imposed and personal limits, you can build the resilience needed to turn a funded account into a reliable income source.
Tools and Platforms for NQ Breakout Trading
Once you’ve fine-tuned your breakout and risk management strategies, having the right tools can make all the difference. Specialized software not only helps you separate genuine NQ breakouts from false signals but also ensures precise backtesting, real-time order flow analysis, and quick execution.
Charting and Analysis Software
One standout tool for NQ breakout trading is NinjaTrader 8. This platform is invaluable for testing breakout strategies, thanks to features like Tick Replay, which reconstructs price movements tick-by-tick, and Intrabar Granularity, which simulates order fills within each bar. For example, a backtested NQ breakout strategy on a 1-minute MNQ chart from August 2024 to November 2025 yielded a net profit of $12,736, with a maximum drawdown of $2,364.
For order flow analysis, platforms such as ATAS, Bookmap, and Sierra Chart are excellent choices. These tools provide footprint charts, delta, and imbalance data, helping traders identify institutional breakouts while avoiding false signals. Pairing these platforms with high-quality data feeds like Rithmic or CQG can reduce slippage, especially during high-volatility periods like the New York Open (9:30–11:00 AM EST).
When deciding between NQ and MNQ contracts, consider that MNQ contracts are 1/10 the size of standard NQ futures. This makes MNQ particularly useful for testing new strategies or managing tighter risk limits, especially during prop firm evaluations. You’ll still get the same Nasdaq exposure but with significantly lower margin requirements.
In addition to these technical tools, leveraging resources specifically designed for prop traders can further enhance your strategy.
DamnPropFirms Resources for Funded Traders

For traders navigating prop firm evaluations, DamnPropFirms offers a range of resources to simplify the process. Their platform features verified reviews of leading futures prop firms, including Apex Trader Funding, Take Profit Trader, and Tradeify. These reviews allow you to compare rules, payout structures, and commission rates before committing to an evaluation.
One particularly handy tool is the Consistency Rule Calculator, which helps funded traders stay within guidelines. Many prop firms disqualify accounts if a single profit day exceeds 30–40% of total earnings. This calculator ensures you can monitor daily profits and maintain compliance. Additionally, the platform offers discount codes to lower evaluation costs, boosting your return on investment when testing NQ breakout strategies across multiple accounts.
For traders managing several funded accounts, TradeSyncer is a game-changer. This tool enables seamless trade copying across platforms, reducing the risk of manual entry errors. To top it off, the DamnPropFirms Discord community, with over 3,000 members, provides a space to exchange real-time insights on NQ setups, prop firm experiences, and risk management techniques. It’s a valuable resource for staying connected and informed.
Conclusion
Mastering NQ breakout trading hinges on three core elements: maintaining psychological discipline, managing risk effectively, and following a consistent, repeatable strategy. To improve your chances of success, confirm breakouts with strong volume and wait for a buildup to manage risks more tightly. This approach creates a solid foundation for navigating the high-pressure world of prop firm trading.
Even a strategy with a 50% win rate can lead to long-term profitability if paired with a 2:1 reward-to-risk ratio. As Richard Dennis wisely pointed out:
"Whatever method you use to enter trades, the most critical thing is that if there is a major trend, your approach should assure that you get in that trend".
To meet the demands of prop firms, implement disciplined risk controls. This includes using precise position sizing, setting stop-losses in advance, and leveraging bracket orders for every trade. Keep a detailed trading journal, complete with screenshots and notes on your mindset, to identify whether losses are due to flaws in your strategy or emotional missteps.
For traders looking to bridge the gap between theory and execution, DamnPropFirms offers a range of tools to help turn plans into results. These include a Consistency Rule Calculator, vetted reviews of prop firms, and a supportive Discord community designed to simplify your journey toward securing funded accounts.
Maximize your trading opportunities by focusing on high-volume periods like the New York Open (9:30–11:00 AM EST) and Power Hour (3:00–4:00 PM EST). Combine this timing with order flow tools to confirm market conviction and enhance your decision-making.
FAQs
What are the most common psychological mistakes traders make when trading NQ breakouts?
Traders often face psychological challenges when dealing with Nasdaq-100 (NQ) breakouts, largely due to the contract’s notorious volatility. Among the most common pitfalls is FOMO (fear of missing out), where traders rush into positions without waiting for proper confirmation. Another frequent mistake is loss aversion – the tendency to hold onto losing trades longer than planned, simply to avoid the discomfort of realizing a loss. Then there’s the fear-and-greed cycle, which can push traders to exit winning trades prematurely or, worse, double down on losing positions in the hope of an eventual recovery.
Other traps include overconfidence and the herd mentality. After a string of wins, some traders start increasing their position sizes beyond what their risk tolerance allows, convinced they’re on a winning streak. Similarly, jumping into trades just because "everyone else is buying" often leads to poorly timed decisions that lack a solid strategy. To navigate NQ breakouts successfully, traders need to stay disciplined and stick to a clear, rule-based plan.
How can traders confirm if an NQ breakout is genuine?
To identify a genuine Nasdaq-100 (NQ) breakout, pay close attention to price action, volume, and trend alignment. A breakout is considered valid when the price clearly moves above a resistance level (or below a support level) and closes beyond it on the chart. A candle close is far more reliable than a quick intrabar spike, as it provides stronger evidence of the move. Keep an eye on volume too – if it’s 1.5 to 2 times higher than the recent average, it typically indicates enough buying or selling pressure to support the move.
It’s also essential to verify that the breakout matches the overall trend by analyzing higher time frames. For instance, check if the price is trading above a rising 50-EMA or VWAP, or if the trend structure (like higher highs or lower lows) is consistent. To minimize the chances of falling for a false breakout, consider waiting for a retest of the breakout level before entering your position. Be sure to place your stop just beyond the breakout level to safeguard against potential reversals.
What are the key risk management strategies for prop firm traders?
Effective risk management is a cornerstone of success in prop trading, especially when dealing with firm capital. A common guideline is to limit risk to 1–2% of your account balance per trade. This approach helps shield you from significant losses while keeping you in the game. To further manage risk, tools like stop-loss orders are indispensable, and setting clear take-profit targets is equally important. Aim for a risk-to-reward ratio of at least 1:2, ensuring that your potential rewards outweigh your risks over time.
Beyond managing individual trades, maintaining a detailed trading journal is a game-changer. It allows you to document your decisions, spot recurring patterns, and fine-tune your strategies. Another key practice is to regularly stress-test your trading system by simulating tough market conditions. This helps confirm that your risk limits can withstand unexpected volatility. Lastly, prioritize quality over quantity – avoid the trap of overtrading and focus only on setups that meet your strict criteria. These habits foster discipline and help reduce the likelihood of large drawdowns.