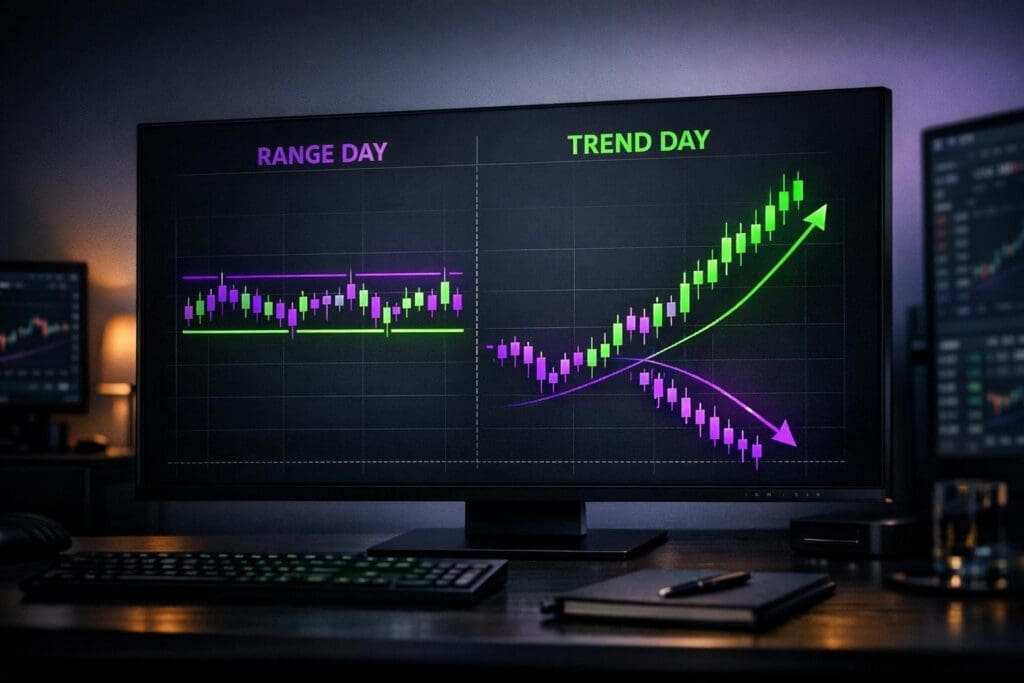
Trading the ES (E-mini S&P 500) requires knowing whether you’re dealing with a range day or a trend day. Misreading the market can lead to losses, especially if you’re using the wrong strategy. Here’s what you need to know:
- Range Days: Price oscillates between support and resistance, with low volatility and frequent pullbacks. Mean-reversion strategies work best here.
- Trend Days: Price moves decisively in one direction, with minimal retracements and high volatility. Breakout or momentum strategies are ideal.
Key Tools to Identify Market Type Before the Open:
- ATR (Average True Range): Compare short-term ATR to long-term averages to gauge volatility. Low ATR often signals a breakout, while high ATR suggests choppy conditions.
- Pre-Market Volume: Rising volume indicates potential trend days; flat volume often points to range days.
- Opening Range Analysis: A small opening range followed by a breakout often signals a trend day.
- Moving Averages: Consistent slope and alignment of moving averages suggest a trend, while frequent crossovers point to a range.
Pro Tip: Trend days are rare (about once a month) but can account for most of a trader’s profits. Missing them – or trading against them – can ruin your month. Use tools like ATR benchmarks, pre-market volume, and opening range analysis to align your strategy with the market type.
Avoid costly mistakes by tailoring your approach to the market environment. Whether you’re trading with a prop firm or on your own, understanding these dynamics can make all the difference.
An Easy Way to Recognize Trend Days
Range Days vs Trend Days on ES: The Basics
Range Days vs Trend Days ES Trading Comparison Chart
What Are Range Days?
Range days occur when the ES price moves back and forth between support and resistance without establishing a clear trend. During these sessions, the market tests the highs, retreats to the lows, and often repeats this cycle throughout the day. This back-and-forth action frequently leads to multiple failed breakouts at both ends as buyers and sellers battle for control.
On range days, volatility tends to shrink, meaning the Average True Range (ATR) is lower than usual. Price activity clusters within the range, often closing near where it opened. Volume also tends to concentrate in this middle zone, creating what traders refer to as the "Value Area".
What Are Trend Days?
Trend days, on the other hand, are characterized by decisive movement in one direction. These sessions typically start near one extreme and finish near the opposite extreme, with minimal pullbacks along the way. Linda Bradford Raschke, President of LBRGroup, captures this dynamic well:
"A trend day occurs when there is an expansion in the daily trading range and the open and close are near opposite extremes."
During trend days, the ES often hits a series of new highs (in an uptrend) or new lows (in a downtrend) as the session progresses. The first 30 minutes of trading usually account for less than 10% of the day’s total range, with momentum picking up later. Volume increases as the price breaks out, and retracements are rare. These days are relatively infrequent, often occurring about once a month in S&P 500 futures, but they can contribute significantly to a trader’s monthly gains. Statistical studies even show that the strongest trend days may feature 45–50 one-minute bars setting new session extremes.
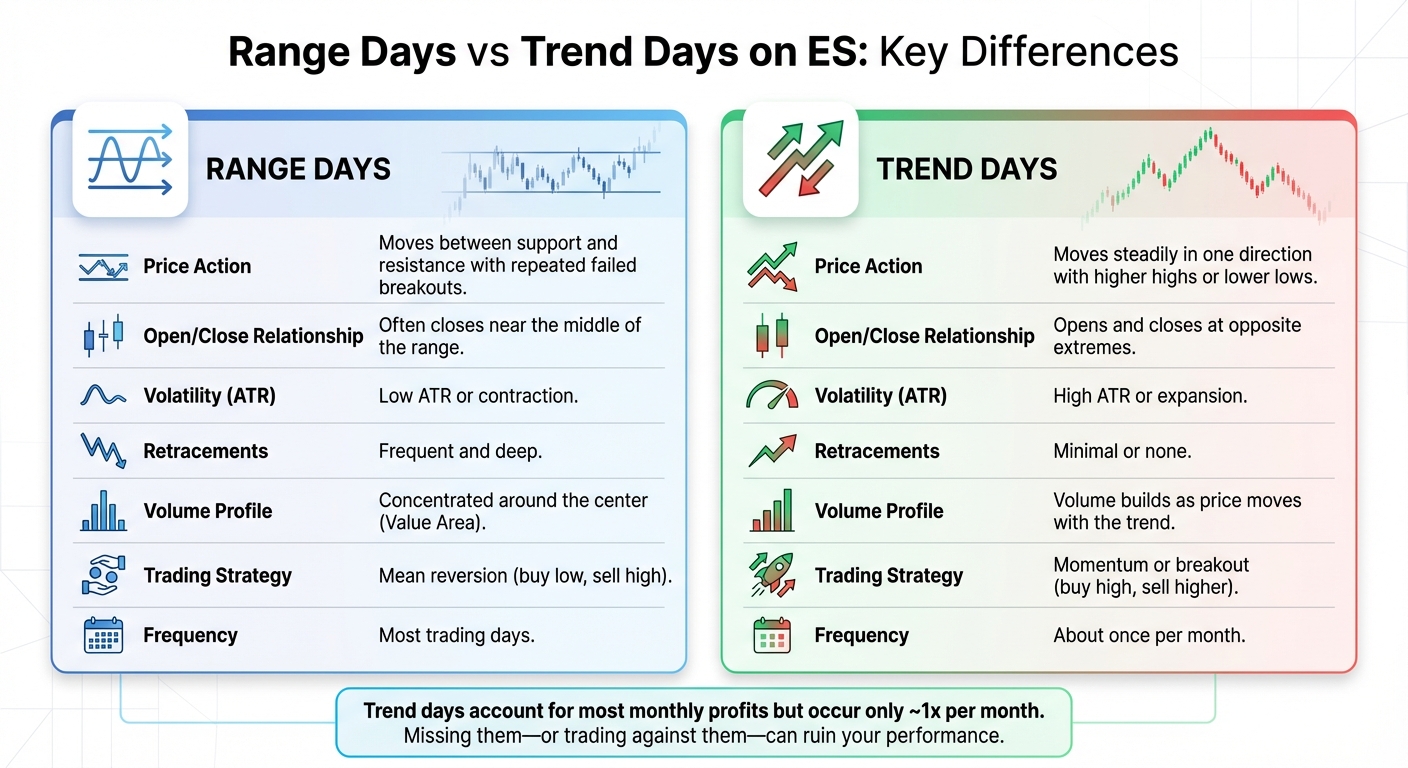
How Range Days and Trend Days Differ
The key distinctions between range and trend days lie in their volatility, price movement, and volume distribution. Range days involve contraction and oscillation, while trend days are marked by expansion and directional moves. These differences require traders to adopt distinct strategies.
| Feature | Range Day | Trend Day |
|---|---|---|
| Price Action | Moves between support and resistance with repeated failed breakouts | Moves steadily in one direction with higher highs or lower lows |
| Open/Close Relationship | Often closes near the middle of the range | Opens and closes at opposite extremes |
| Volatility (ATR) | Low ATR or contraction | High ATR or expansion |
| Retracements | Frequent and deep | Minimal or none |
| Volume Profile | Concentrated around the center (Value Area) | Volume builds as price moves with the trend |
| Trading Strategy | Mean reversion (buy low, sell high) | Momentum or breakout (buy high, sell higher) |
Adam Grimes, Chief Strategist at MarketLife, highlights the defining traits of trend days:
"Trend days generally open and close at opposite ends of the day, see few major intraday reversals, and have a larger range than other days."
Markets naturally alternate between these two states. A series of narrow range days often sets the stage for a powerful trend day. Traders keep an eye out for volatility compression patterns, like the "NR7" (narrowest range in the past seven days), as an early indicator of an impending breakout. In the next section, we’ll dive into methods for identifying these patterns before the trading day begins.
How to Identify Range vs Trend Days Before the Open
Successful traders know the importance of reading market conditions before the opening bell. By spotting key pre-market signals, you can fine-tune your strategy early and steer clear of mistakes like fading a trend or chasing breakouts during a range day.
Using ATR to Gauge Market Conditions
The Average True Range (ATR) is a powerful tool for assessing market volatility before the session starts. But here’s the trick: instead of focusing on the raw ATR number, compare short-term ATR readings to long-term averages.
For example, track the 14-day ATR against the 200-day ATR in a spreadsheet. If the 14-day ATR dips below the 200-day average, it signals "cheap" volatility, meaning the market is primed for a breakout. On the flip side, when the 14-day ATR runs significantly above the 200-day level, it suggests the market may be overextended, often leading to choppy, range-bound behavior.
John Seguin of Market Taker Mentoring explains it well:
"If recent day and week ranges are far below the benchmark (long-term average), odds increase for a breakout or onset of a trend."
Patterns like the NR7 – where the previous day’s range is the narrowest in the past seven days – are reliable indicators of an upcoming trend day. Similarly, two or three consecutive days of tight ranges often hint at an imminent breakout.
To set breakout levels, calculate a percentage of the 1–3 day ATR and apply it to the previous day’s close or the opening price. If the market hits these levels early in the session, it could confirm a shift from range to trend, helping you align your strategy accordingly.
While volatility is a key piece of the puzzle, pre-market volume patterns can provide additional clarity.
Interpreting Pre-Market Volume Patterns
Volume is the lifeblood of price movement. Without sufficient volume, the market often struggles to sustain directional moves, leading to range-bound conditions. Pre-market volume trends offer valuable clues about the day ahead.
Flat or declining pre-market volume typically points to a range day, as the lack of participation makes it harder for the market to break key levels. Conversely, rising or consistently high pre-market volume – especially after a period of low activity – often signals institutional involvement, a hallmark of trend days.
The day of the week also matters. For instance, Mondays on the ES futures market generally see the lowest average volume and range, with an 88% chance that price will stay within the 14-day ATR. In contrast, midweek – especially Wednesdays – tends to bring higher volume and greater chances of exceeding the daily ATR. If you’re targeting trend days, focusing on midweek sessions can be more rewarding.
Periods of low volume paired with narrow ranges often set the stage for sharp vertical moves, signaling the start of a trend day. Recognizing these conditions in advance can help you adjust your strategy.
Analyzing Pre-Market Price Action
To complete the picture, pre-market price action provides insights into the market’s intentions. Consolidation patterns, for instance, can be strong indicators of trend days. Look for "inside days", where the current range is entirely within the previous day’s range – these often set up high-probability scenarios for the next session.
Another useful metric is the opening range – the first 15 to 60 minutes of trading. If this range is smaller than the 15–30 day average, it’s often a sign of consolidation before a major move. As Linda Bradford Raschke puts it:
"Price expansion tends to follow periods of price contraction, the phenomenon being cyclical. The market alternates between periods of rest or consolidation and periods of movement."
Keep an eye out for "hook days", where the market opens outside the previous day’s range but quickly reverses into consolidation. This pattern frequently leads to a trend. Similarly, large price moves in one direction during the first 15 minutes of trading – sometimes called an "Early Entry" signal – often indicate a strong likelihood of trend continuation.
Lastly, try the range box technique. Draw a box around the high and low of the first two 15-minute candles. If the price breaks and holds outside this box within the first hour, it’s a strong indication that the market is transitioning into a trend day. This technique allows you to position yourself early in the move.
sbb-itb-46ae61d
Tools and Indicators to Confirm Market Type
Before committing capital, it’s essential to confirm your market view using reliable tools. Indicators like moving averages, oscillators, and risk calculators can help you determine the market type with greater confidence.
Moving Averages and Alignment
Moving averages are a straightforward way to gauge whether the ES is trending or ranging. For instance, a consistently sloping 20 SMA often signals a trend day. On the flip side, if the price repeatedly crosses this moving average without establishing a clear direction, the market is likely range-bound.
Another useful signal is the interaction between a 3-period EMA and an 8-period EMA. When the 3 EMA crosses above the 8 EMA, it often indicates resuming momentum. As Linda Bradford Raschke aptly notes:
"A trader caught off guard will often experience his largest losses on a trend day as he tries to sell strength or buy weakness prematurely."
To adapt, when moving averages align and slope consistently, shift your focus from fading extremes to trading in line with the prevailing momentum. For a more comprehensive analysis, confirm moving average signals with oscillator readings.
RSI and MACD Divergences
RSI and MACD divergences are invaluable for spotting momentum shifts or confirming trend strength. Regular divergence occurs when the price makes a new extreme, but the indicator does not, signaling weakening momentum. This is particularly useful for identifying reversals in range-bound markets. For example, if the ES hits a higher high while RSI forms a lower high, it could indicate the rally is losing steam, with the market potentially reverting to its range mean.
Hidden divergence, on the other hand, suggests trend continuation. When the indicator reaches a new extreme that the price fails to confirm, it reinforces the strength of the underlying trend. In trending markets, spotting bullish hidden divergence during pullbacks can provide a solid basis for adding to positions with more confidence.
RSI can also help identify overextended conditions, with levels above 70 signaling overbought conditions and below 30 indicating oversold zones. Pair these readings with MACD crossovers to confirm momentum shifts. For the best results, start by analyzing divergences on higher timeframes – like the daily or 4-hour chart – and then refine your entries on shorter timeframes, such as the 5-minute chart.
DamnPropFirms Consistency Rule Calculator

Risk management tools play a crucial role in complementing your technical analysis. The Consistency Rule Calculator on DamnPropFirms.com can help you align your position sizing with the market type while adhering to prop firm guidelines. By incorporating ATR analysis, this tool ensures your setups are risk-adjusted, minimizing the chances of breaching firm rules or triggering a margin call.
Trend trading often requires a "right or out" approach, using tight stops and risking between 1.5% and 2% of capital per trade. Range trading, however, may call for smaller position sizes and a larger buffer to handle price fluctuations. The calculator allows you to balance these strategies, fine-tune your profit targets, and adjust your positions based on the identified market type.
For more information on prop firm guidelines and risk management strategies, take a look at our detailed reviews of leading futures prop firms, including our comprehensive profile on Apex Trader Funding.
Checklist and Tips for Futures Traders
Daily Identification Checklist
Use this checklist to quickly analyze the day’s market type by applying pre-market techniques:
- Compare pre-market range to the previous day’s range: If today’s range is entirely within the prior day’s high and low (known as an "inside day"), it could signal compressed volatility, often a precursor to a strong trend day.
- Check the opening 30-minute candle size: If it’s smaller than your 15–30 day average, it may indicate consolidation.
"On trend days, the opening range tends to be smaller than average. It represents a period of consolidation before the real move begins."
- Look for moving average alignment: Confirm indicators like a 3EMA/8EMA crossover after the opening breakout.
- Analyze the ATR (Average True Range): A recent 14-day ATR that’s notably lower than the 200-day ATR increases the likelihood of a breakout.
- Monitor 1-minute highs and lows: Frequent new highs or lows with minimal reversals often point to a trend day.
Once you’ve identified the market type, adjust your trading strategy accordingly, especially if you’re working with prop firms.
Tips for ES Traders at Prop Firms
- Adjust position size in high-volatility environments: When ATR is high, reduce your position size to manage risk more effectively.
"ATR-based stop-losses can help you avoid getting stopped out too soon by normal market ‘noise’ in a high-volatility environment."
- Use dynamic trailing stops: Instead of fixed stops, set trailing stops at 1.5× ATR to avoid exiting prematurely on trend days.
- Avoid fading trend days: As Linda Bradford Raschke cautions:
"The worst catastrophes come from trying to average losing trades on trend days."
- Switch to breakout strategies on trend days: If you spot a trend day early, pivot from mean-reversion strategies. Place buy stops just above the morning high or sell stops just below the morning low after the first 45–120 minutes.
- Leverage tools like DamnPropFirms’ Consistency Rule Calculator: This can help you align your trading on trend days with firm-specific guidelines. Since trend days in the S&P 500 futures typically occur about once a month, make the most of them without exceeding your risk limits.
Conclusion
Understanding the difference between range days and trend days on the ES (E-mini S&P 500) is essential for protecting your capital and maintaining consistent trading results. For intraday traders, the majority of monthly profits often come from just one or two standout trend days. On the flip side, trying to fade strong moves on these days can lead to mounting losses.
The strategies discussed in this guide provide a solid framework for identifying market conditions early in the session. Tools like ATR benchmarks, opening range analysis, pre-market volume, and price action are invaluable for reading the market. For instance, spotting volatility compression through patterns like inside days or the NR7 can signal an impending trend day. On the other hand, if prices repeatedly test key support and resistance levels, it’s likely a range day – perfect for applying mean-reversion strategies. By tailoring your approach to match these conditions, you can make more informed decisions and maximize the insights shared throughout this guide.
For futures traders, especially those at proprietary firms, early identification of trend days is even more crucial. Since trend days in S&P 500 futures tend to occur roughly once a month, capitalizing on them while following consistency rules is key. Tools like the DamnPropFirms Consistency Rule Calculator can help adjust your positions to ensure payouts remain secure.
Markets naturally cycle between consolidation and movement. By using ATR to set dynamic stops, keeping an eye on moving average alignment, and adjusting position sizes based on volatility, you can align your trading strategy with the market’s rhythm instead of fighting against it. Start applying these techniques now to refine your decision-making and safeguard your capital.
FAQs
How can I tell if it’s going to be a range day or a trend day in the ES before trading starts?
To gauge whether the ES (E-mini S&P 500) is gearing up for a range day or a trend day, keep an eye on three essential pre-market signals:
- Volatility levels
Take a look at the Average True Range (ATR) compared to its 20-day average. If the ATR is noticeably lower – say, less than 70% of the average – it could mean the market is "coiled" and ready to break into a trend day. On the flip side, if the ATR is at or above the average, you’re likely looking at choppier, range-bound conditions. - Overnight price action
Pay attention to where the market opens in relation to the prior session. If it opens outside the previous session’s high or low and the point of control (POC) hasn’t been tested, this often signals a potential trend day. However, if the open stays within the prior session’s range and the POC has already been tested, it’s a sign that a range day might be on the horizon. - Opening range behavior
Watch how the market behaves in the first 30 minutes after it opens (9:30–10:00 AM EST). If the price range is tight – less than 10% of the expected daily range – and sticks near one extreme, it could point toward a trending session. But if the range is wider, around 30–40% of the expected daily move, and the price bounces between levels, it’s more indicative of a range day.
By analyzing these factors before or shortly after the market opens, you can better tailor your trading approach to the day’s dynamics and steer clear of unnecessary risks.
What are the best indicators to identify trend days when trading ES futures?
Spotting trend days in ES (E-mini S&P 500) futures often comes down to recognizing a few key indicators:
- Average True Range (ATR): When the ATR is high, it usually points to increased volatility, which can pave the way for a trend day.
- Opening Range Breakouts: If the opening range is unusually tight – especially tighter than the 15-30 day average – and then breaks out strongly in one direction, it might signal the onset of a trend day.
- Clean Price Action: Look for steady movement in one direction with minimal intraday reversals. This kind of price action is a hallmark of trend days.
By layering these tools with a close watch on trading volume and overall market sentiment, traders can better anticipate trend days and fine-tune their strategies to align with the market’s momentum.
How can I adjust my trading strategy for range days versus trend days when trading ES futures?
On a trend day, the ES market usually starts near one end of the price spectrum and finishes close to the other, driven by strong momentum with little to no intraday reversals. In this case, momentum-based strategies, like trading breakouts, are your best bet. Use wider stop losses to accommodate the larger price swings and aim for bigger profit targets to capture the full extent of the trend. For instance, entering a trade after the price breaks a key level – such as the opening range or a significant swing point – can position you to ride the trend effectively.
On a range day, the market typically moves within a tighter high-low range, with prices frequently reversing between support and resistance levels. A mean-reversion strategy works better here. Focus on trading around well-defined levels, use smaller position sizes, and set tighter stops with modest profit targets. If the price action seems particularly erratic, it might be smarter to scale back your activity or even sit out, as most monthly profits often come from trend days. Tools like the Average True Range (ATR) can provide insight into whether the market is leaning toward a trending or consolidating phase, helping you tailor your strategy accordingly.