Footprint charts provide a detailed view of market activity by breaking down executed trade volumes at each price level. Unlike traditional candlestick charts, they reveal the dynamics of aggressive buying and selling, helping traders identify bid-ask imbalances, absorption, and key market levels like the Point of Control (POC) and Value Area. These insights are critical for understanding market sentiment and making informed trading decisions.
Key Takeaways:
- What Are Footprint Charts?
They split each bar into bid (left) and ask (right) volumes, showing aggressive selling vs. buying activity. - Why Bid-Ask Imbalances Matter:
Highlight strong buying or selling intent, with stacked imbalances (3+ levels) often signaling institutional activity. - Core Chart Types:
- Bid/Ask Footprint: Raw bid-ask volumes for spotting imbalances.
- Delta Footprint: Net difference (Ask – Bid) for buying/selling pressure.
- Volume Footprint: Total traded volume at each price level.
- Patterns to Watch:
- Stacked Imbalances: Indicate strong directional conviction and potential breakouts.
- Absorption: Signals reversals when aggressive orders fail to move prices.
- Delta Divergence: Weak price moves when delta doesn’t confirm, hinting at reversals.
- Trading Strategies:
Use stacked imbalances for breakout setups or absorption signals for reversals, often achieving win rates around 70–80% on liquid futures like ES and NQ.
Footprint charts are especially useful for traders working with the best futures prop firms, as they enable precise risk management and compliance with strict drawdown limits. Platforms like Apex Trader Funding and Alpha Futures offer tools and funding opportunities tailored to these strategies.
Ultimate Guide to Footprint Charts Trading: How to Use + Strategy Ideas
sbb-itb-46ae61d
Core Components of Footprint Charts
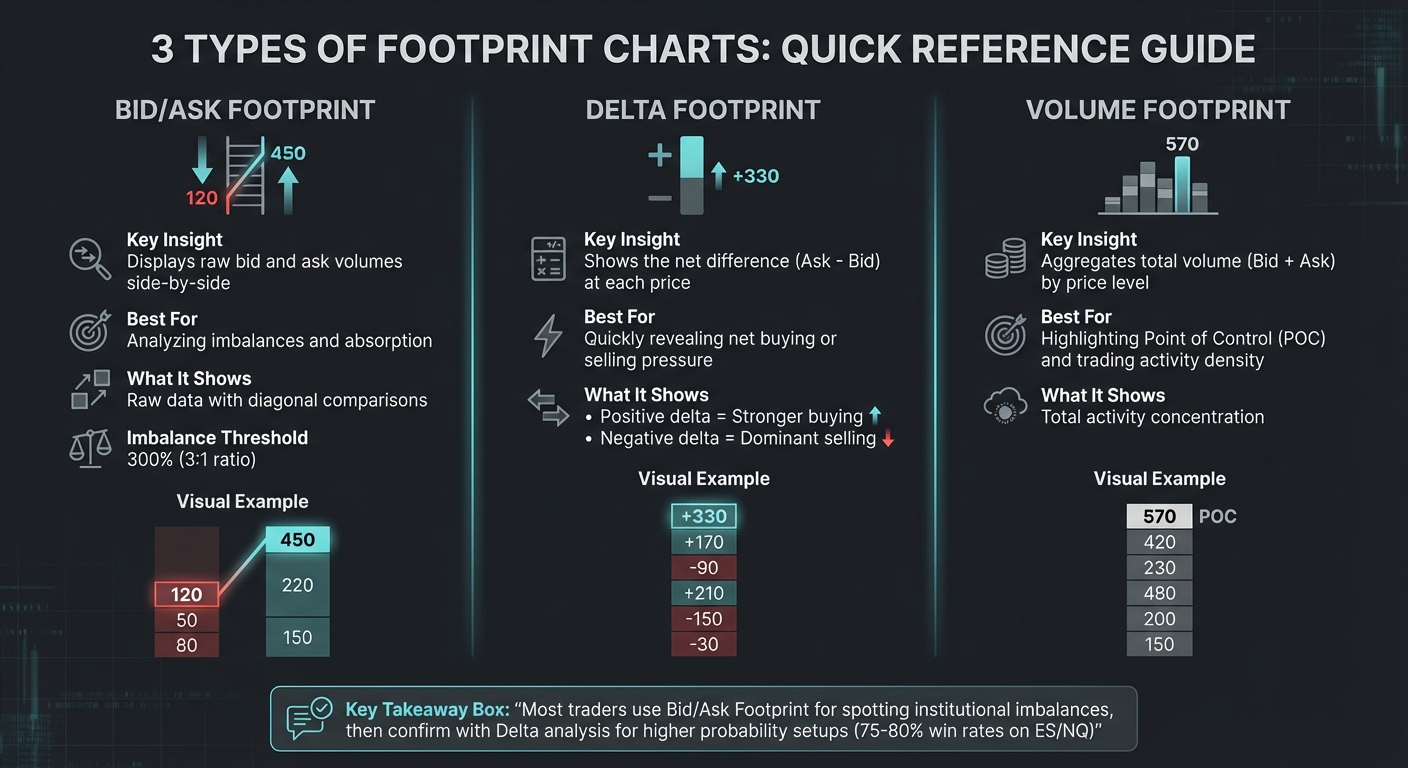
Footprint Chart Types Comparison: Bid/Ask vs Delta vs Volume
To effectively use footprint charts, it’s important to understand their key elements. These components reveal the order flow dynamics that drive price movement.
Bid Volume vs. Ask Volume
At the heart of footprint charts is the distinction between aggressive sellers and buyers. The left column represents bid volume (aggressive selling), while the right column shows ask volume (aggressive buying). This setup separates passive limit orders from the market orders that actively move prices. For instance, if the ask side shows 450 contracts and the bid side has 120 at a given price, you’re seeing aggressive buying outweigh aggressive selling by nearly 4:1.
A diagonal comparison is used for imbalances: the ask volume at a specific price (P) is compared to the bid volume at the price one tick below (P-1). This method highlights upward buying pressure versus downward selling pressure.
Grasping these volume relationships is essential when choosing the right footprint chart format.
Types of Footprint Charts
Footprint charts come in a few formats, each offering a unique perspective for analysis:
| Chart Type | Key Insight | Application |
|---|---|---|
| Bid/Ask Footprint | Displays raw bid and ask volumes side-by-side | Ideal for analyzing imbalances and absorption |
| Delta Footprint | Shows the net difference (Ask – Bid) at each price | Quickly reveals net buying or selling pressure |
| Volume Footprint | Aggregates total volume (Bid + Ask) by price level | Highlights Point of Control (POC) and trading activity density |
The bid/ask footprint is the go-to for spotting imbalances since it retains the raw data needed for diagonal comparisons. The delta footprint condenses this information, showing whether buyers or sellers are more aggressive at each price level. Positive delta indicates stronger buying, while negative delta points to dominant selling. Meanwhile, the volume footprint focuses on total activity, helping identify the Point of Control (POC) – the price level with the most volume during a specific period.
Futures platforms like Topstep often use a 300% threshold (a 3:1 ratio) to flag a price level as imbalanced. When three or more of these imbalances appear consecutively, it often signals strong institutional activity, which can lead to high-probability trade setups.
Breaking down these components is essential for spotting bid-ask imbalances and gaining insights into market sentiment.
How to Identify Bid-Ask Imbalances
Footprint charts are a go-to tool for spotting institutional activity amidst market noise. By focusing on volume patterns, you can pinpoint areas where the market shows clear signs of aggressive buying or selling pressure. Here’s how to identify these imbalances effectively.
Spotting Single Imbalances
A single imbalance happens when buying or selling pressure clearly dominates at a specific price level. To identify this, compare the ask volume at a price (P) with the bid volume one tick below (P-1). This diagonal comparison helps reveal the true strength of market participants because the best bid and ask prices are always at least one tick apart.
Most trading platforms highlight imbalances when one side significantly outweighs the other. For instance, if the ask volume exceeds the bid volume by three times or more at the tick below, that’s a buy imbalance. These imbalances are often color-coded, with stronger ratios displayed in brighter colors. To filter out minor market noise, set your software to flag imbalances at a minimum threshold of 300%. Some professional traders even focus on extreme ratios, like 10:1, especially at candle highs or lows, as these can indicate exhaustion – essentially a signal that a price move may be losing momentum [1].
While single imbalances are useful, stacked imbalances often carry even greater significance.
Recognizing Stacked Imbalances
Stacked imbalances occur when three or more consecutive price levels within a single bar display imbalances on the same side. On a footprint chart, this appears as a vertical cluster of highlighted cells, forming a "wall" that represents strong market conviction in one direction.
"Stacked imbalances are the most powerful: 3+ consecutive price levels showing imbalances in the same direction signals institutional conviction." – FuturesHive [4]
These stacked imbalances are especially meaningful when they occur near important levels like the Value Area Low (VAL), Point of Control (POC), or VWAP. For example, imbalances forming at structural levels such as the previous day’s high or low often have win rates of around 75–80% on liquid futures prop firm markets like ES and NQ [4]. However, it’s crucial to wait for the footprint bar to close before making a trade decision, as acting mid-bar can result in false signals [4].
Analyzing Delta Divergence
Delta divergence is another key signal, often pointing to weak price conviction. This occurs when the price reaches a new high or low, but the net delta – essentially the difference between aggressive buying and selling – fails to follow suit. For example, if the price hits a new high but the net delta is lower than during a previous peak, it suggests that buying pressure is waning, potentially signaling an upcoming reversal [4][2][5]. Similarly, if the price reaches a new low but the delta is less negative than before, it points to weakening selling pressure.
Combining delta divergence with footprint data can significantly improve accuracy. For instance, pairing divergence with signs of absorption or stacked imbalances can lead to win rates exceeding 70–75% [4]. Always check the total delta of a candle against visible imbalances. A large buy imbalance in a candle with a negative total delta might indicate absorption by a passive seller rather than genuine buying strength [2].
Interpreting Bid-Ask Imbalances for Market Sentiment
Now that we’ve covered how to identify bid-ask imbalances, let’s dive into interpreting them to uncover market sentiment. The goal is to turn these imbalances into actionable insights by understanding what they reveal about institutional activity and potential market direction.
Using Stacked Imbalances to Predict Breakouts
Stacked imbalances – three or more consecutive price levels showing strong buying or selling – are a clear sign of institutional involvement. These patterns often indicate a strong commitment to driving prices through key levels. For instance, stacked buy imbalances forming during an upward trend near critical levels suggest that large players are supporting the breakout [4].
"Stacked imbalances are multiple imbalances spread across a few price increments in a tight range… Large buy imbalances will tend to act as support if price retraces back to test the level."
- Adam, Founder, Jumpstart Trading [3]
These zones not only signal potential breakouts but also leave a lasting impact on the market. Stacked buy imbalance zones often act as support during pullbacks, while stacked sell imbalance zones can serve as resistance. However, context matters. Avoid trading imbalances that appear in the middle of a range; instead, focus on areas like previous day highs, lows, or the Point of Control (POC).
While stacked imbalances are great for predicting breakouts, absorption patterns tell a different story – they can signal reversals.
Identifying Absorption and Sentiment Reversals
Absorption patterns complement breakout signals by highlighting shifts in market sentiment. Absorption happens when aggressive market orders hit a wall of passive limit orders, causing the price to stall despite heavy volume. For example, on the E-mini S&P 500 (ES) using futures prop firm discounts, absorption often shows as 800–1,500+ contracts trading at a single price level without further price movement. On the Nasdaq-100 (NQ), the range is higher, typically 2,000–4,000+ contracts [4].
This creates a liquidity trap where aggressive traders get stuck. When prices fail to break through, these traders are forced to exit, often triggering sharp reversals.
"When a breakout stalls despite heavy volume, someone is on the other side… Those aggressive sellers who pushed into a wall of passive buying are now underwater. They are trapped."
To confirm a reversal, look for a delta flip. For instance, if you notice heavy selling (negative delta) at a support level without a price breakdown, watch for the delta to turn positive. This flip indicates that sellers have given up and buyers are stepping in. Recognizing these sentiment shifts can give you a valuable edge in trading.
Trading Strategies Using Footprint Charts
Footprint charts provide a detailed view of order flow dynamics, making it easier to turn imbalances into actionable trading setups.
Stacked Buy Imbalances for Long Entries
Stacked buy imbalances occur when three or more consecutive price levels show buying outweighing selling by at least a 3:1 ratio. This often signals strong bullish momentum, especially around key levels like the Value Area Low (VAL), Point of Control (POC), or previous session extremes. On high-liquidity contracts like the ES and NQ (common in top futures prop firms), filtered setups of this kind have shown win rates of approximately 75–80% [4].
"When you see 3+ levels of aggressive buying stacked together, institutions are COMMITTED to pushing price higher."
- FuturesHive [4]
To trade this setup, wait for the footprint candle with the stacked imbalance to close. Alternatively, place a limit order at the candle’s POC to catch a pullback. Use a stop-loss 4–6 ticks below the lowest point of the imbalanced range and aim for the next significant volume profile level, such as the session POC or the Value Area High (VAH), which often acts as support during retests.
Now, let’s explore how to take advantage of situations where selling momentum fades.
Fading Exhausted Sell Imbalances
Exhausted sell imbalances happen when extreme sell orders (often exceeding a 10:1 ratio) are followed by minimal volume on the final tick, signaling that selling pressure is losing steam. In these cases, an unfinished auction – marked by heavy volume on both sides – often pulls the price back to complete the discovery process.
For this setup, wait for a delta flip at a support level before entering a long position. Set your stop-loss 4–6 ticks beyond the exhaustion candle, and target unfinished auction levels. When these setups align with major structural levels, such as the VAL or previous day’s lows, absorption fade strategies have demonstrated win rates of around 70–75% [4].
Combining Imbalances with Delta for Confirmation
Delta analysis adds an extra layer of confirmation to imbalance signals, helping traders filter out false moves. While imbalances reveal aggressive activity at specific price levels, delta indicates whether that activity is shifting market control. For instance, if you see several buy imbalances but delta is stalling or price remains flat, it could mean a large passive seller is absorbing the orders.
Delta divergence is another reliable setup. For example, when the price hits a new low but cumulative delta forms a higher low, it suggests the move lacks strong institutional support. These divergence setups at critical levels have also shown win rates of about 70–75%. In highly volatile markets like the NQ, you might want to increase the imbalance threshold to 4:1 or 5:1 to account for market noise. Always wait for the footprint bar to close before acting, as signals mid-bar can be misleading, especially in fast-moving conditions.
| Signal Type | Footprint Appearance | Delta Behavior | Market Context |
|---|---|---|---|
| True Breakout | Stacked Imbalances | Sharp Delta Surge | Breaking through LVN/VAH [2][4] |
| Absorption (Reversal) | High Volume Imbalances | Delta Divergence/Stall | At key S/R or VWAP [1][5] |
| Exhaustion | Low Volume at Extreme | Delta Flipping to Neutral | End of Extended Move [2][1] |
| Failed Breakout | Imbalances Present | Delta Divergence | Price Reclaims Range [2][5] |
Scaling Trading with Futures Prop Firms
Footprint charts are a powerful tool for traders aiming to refine their strategies and improve accuracy. By pinpointing precise absorption levels and highlighting bid-ask imbalances, these charts allow for tighter stop-losses – often just 4–6 ticks on ES. This precision is crucial for staying within the strict drawdown limits imposed by prop firms. Interestingly, it’s estimated that 80–90% of traders fail their initial evaluations, not because of poor strategies but due to inadequate risk management [8]. Footprint charts provide the clarity needed to maintain tight risk controls, helping traders align with prop firm requirements and scale their accounts effectively.
Top Futures Prop Firms for Funded Accounts
When it comes to scaling with funded accounts, selecting the right prop firm is key. Many of the top-rated firms validate strategies that emphasize risk management, often leveraging footprint data for better results. DamnPropFirms offers verified reviews and discounts, making it easier for traders to choose the right platform. Some standout options include:
- Apex Trader Funding: Rated 4.4/5 and labeled "Most Popular."
- Alpha Futures: Holds a 4.9/5 rating.
- Take Profit Trader: Rated 4.4/5, known for immediate payouts.
- FundedNext Futures: Rated 4.5/5, offers 24-hour payouts [6].
For example, Apex Trader Funding provides a $50,000 evaluation, costing between $37 (with an 85% discount) and $131, plus an activation fee of about $109 [6][7]. Tools like the Consistency Rule Calculator are also available to help traders navigate each firm’s specific requirements, such as ensuring no single day’s profit exceeds 40–50% of total profits [7][8].
Using Footprint Charts to Meet Prop Firm Rules
Footprint charts can be instrumental in meeting the strict rules set by prop firms. For instance, stacked imbalances at key levels like the Value Area Low (VAL) or Point of Control (POC) often yield win rates of 75–80% on ES and NQ [4]. This high-probability approach allows traders to reach profit targets while adhering to drawdown limits. The "Expected vs. Actual" framework, which uses footprint data, provides a structured way to make decisions at critical levels, helping to reduce emotional trading that often leads to violations [1].
For more volatile contracts like NQ, traders can apply higher imbalance thresholds (4:1 or 5:1) alongside faster tick charts (144-tick or 233-tick) to pinpoint entries with 6–10 point stops [4]. Waiting for delta flips at major support levels before entering reversals adds an extra layer of confirmation, particularly when nearing daily loss limits. These strategies not only help traders comply with firm rules but also position them to maximize profits through instant funding opportunities.
Maximizing Payouts with Instant Funding Options
Instant funding firms provide an excellent opportunity for traders to start generating income right away. Firms like Lucid Trading (4.7/5 rating, 15-minute payouts), Tradeify (4.6/5 rating, daily payouts), and Purdia Capital are popular choices [6]. For instance, Lucid Trading offers a $50,000 account for $65 (with a 50% discount) and no activation fee, while Tradeify charges $97 with a 30% discount [6].
Footprint charts play a crucial role here too. By identifying "unfinished auctions" (areas with volume on both bid and ask at session extremes), traders can set logical take-profit targets that consistently meet payout criteria [3]. Absorption patterns, where high volume (1,000+ contracts on ES) trades without price movement, have proven to deliver 70–75% win rates, making them a reliable setup for funded account trading [4]. Additionally, trade copying software can help manage multiple funded accounts simultaneously, but it’s important to verify each firm’s consistency rules to stay compliant [7][8].
Conclusion
Footprint charts offer a detailed view of executed volume at each price level, helping traders understand both the actions and motivations behind market moves. By automatically pinpointing diagonal imbalances (often at a 3:1 ratio), these charts reveal aggressive institutional activity. This precision is invaluable for timing entries at key structural levels like VWAP, the Point of Control (POC), and Value Area boundaries [4]. These insights form the backbone of strategies favored by traders in funded proprietary accounts.
The real advantage of footprint charts lies in their ability to highlight patterns like absorption, exhaustion, and delta divergence – signals that can lead to actionable setups. These patterns are especially important for traders aiming to meet the strict risk management and consistency standards demanded by futures prop firms.
Platforms like DamnPropFirms simplify the process of scaling funded accounts by offering verified reviews, discounts, and tools such as the Consistency Rule Calculator. Whether you’re pursuing evaluation-based firms like Apex Trader Funding and Alpha Futures, or instant funding options like Lucid Trading and Tradeify, the platform provides resources to align your footprint-based strategies with the right firm. This alignment of advanced charting techniques and prop firm requirements gives traders the tools they need to achieve consistent performance.
FAQs
What’s the easiest way to confirm a real breakout vs. a fakeout with footprint charts?
To verify a real breakout using footprint charts, pay close attention to order flow and volume at critical price levels. True breakouts typically show sustained bid-ask imbalances, steady delta signals, and robust volume profiles, all pointing to genuine buying or selling pressure. In contrast, a fakeout often reveals brief imbalances or rapid absorption without solid volume backing. The key is to watch for consistent pressure and substantial volume at the breakout points, signaling genuine market commitment.
How do I choose the right imbalance ratio (3:1 vs. 4:1 vs. 5:1) for ES or NQ?
Choosing the right imbalance ratio – whether it’s 3:1, 4:1, or 5:1 – for trading ES or NQ largely depends on your strategy and how much market strength you want to identify. A higher ratio, like 5:1, points to stronger buying or selling pressure, while a lower ratio, such as 3:1, reflects more moderate market movements. To fine-tune this, try experimenting with different ratios to see which one best matches your risk tolerance and the market conditions you’re working with. This can help you identify clearer signals that suit your trading approach.
Where should I place stops and targets when trading stacked imbalances or absorption?
When using footprint charts to trade stacked imbalances or absorption, it’s essential to position your stops and targets strategically. Place your stop-loss just beyond the level where the pattern becomes invalid – this typically means outside the imbalance or absorption zone. For profit targets, focus on key support or resistance levels highlighted by the footprint data. These areas often represent high-volume zones or points of institutional interest, making them logical exit points. This method helps align your stops with market structure changes while ensuring your targets are grounded in meaningful price levels.