Tracking your trade win rate is critical if you’re a funded trader. It’s not just about knowing how many trades you win – it’s about proving you have a consistent, repeatable strategy. Prop firms like Apex Trader Funding and Take Profit Trader evaluate traders based on metrics like win rates, profit distribution, and adherence to rules like drawdown limits. Without tracking these, even profitable traders risk losing payouts.
Here’s what you need to know:
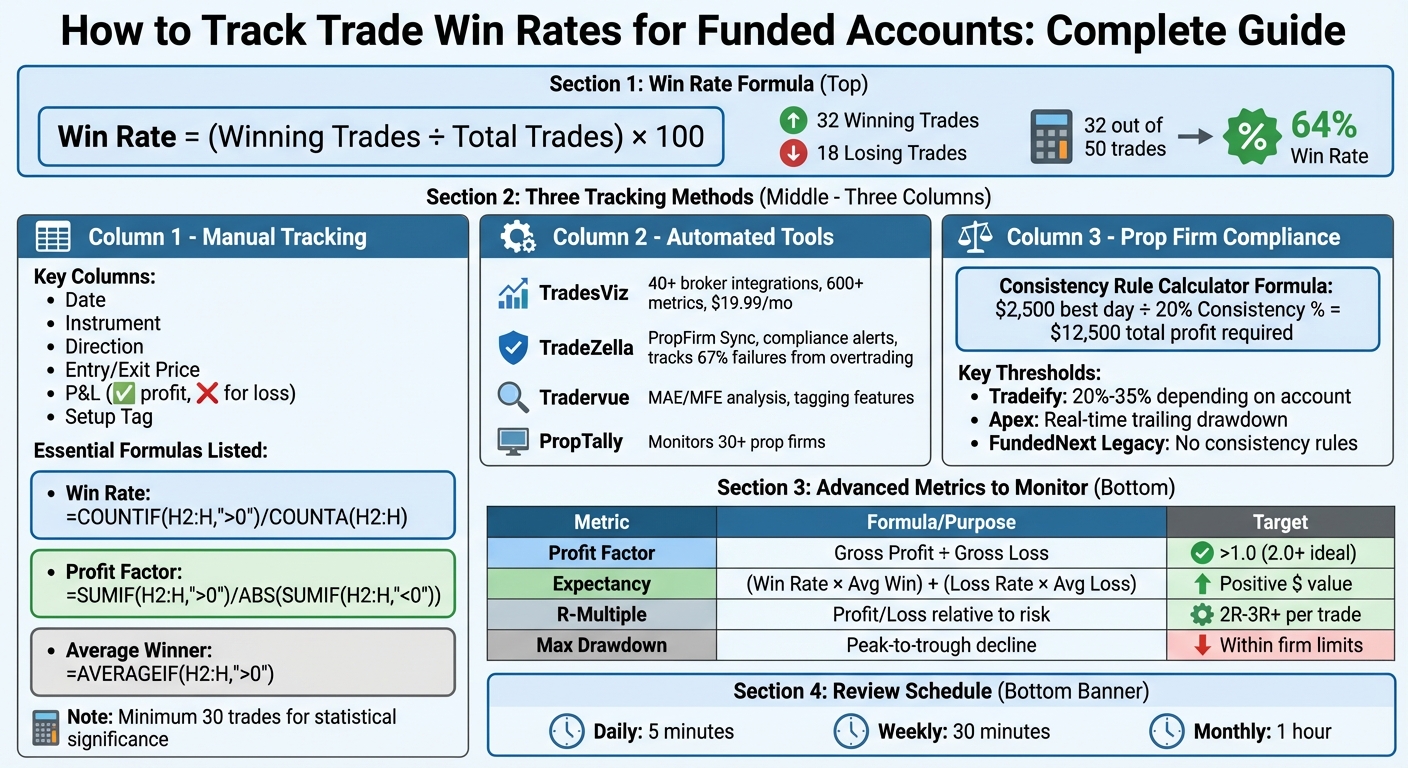
- Win Rate Formula:
(Winning Trades ÷ Total Trades) × 100. For example, 32 wins out of 50 trades = 64% win rate. - Manual Tracking: Use a spreadsheet with columns for trade details (e.g., date, P&L, setup type) and formulas for metrics like win rate and profit factor.
- Automated Tools: Platforms like TradesViz, TradeZella, and Tradervue sync with brokers to track performance automatically and provide insights like MFE/MAE, expectancy, and compliance alerts.
- Prop Firm Rules: Many firms enforce consistency thresholds (e.g., profits spread across days) and drawdown limits. Tools like the Consistency Rule Calculator can help ensure compliance.
Complete Guide to Tracking Trade Win Rates for Funded Accounts
Most important metrics and statistics about your trading
sbb-itb-46ae61d
What Are Trade Win Rates?
Trade win rate refers to the percentage of your trades that are profitable. It’s a critical metric that helps determine whether your trading success stems from a repeatable strategy or sheer luck [[4]](https://www.tradesviz.com/brokers/Topstep Funded Accounts). This measurement serves as the starting point for deeper performance evaluations, especially those required by proprietary (prop) trading firms.
Prop firms don’t just care about how much money you’ve made – they’re more interested in how you’ve made it. For instance, a trader with a 60% win rate who consistently generates profits is far more appealing than someone with a 30% win rate who relies on a few high-risk, massive wins to meet profit targets. These firms prioritize traders who use disciplined, repeatable strategies over those who gamble with their trades [1].
How to Calculate Win Rate
The formula for calculating your win rate is simple:
Win Rate = (Number of Winning Trades ÷ Total Number of Trades) × 100
Let’s say you completed 50 trades during an evaluation period, and 32 of those trades were profitable. Your win rate would be calculated as follows:
(32 ÷ 50) × 100 = 64%.
This percentage reflects a consistent trading edge, which is highly valued in the trading world.
If you’re using automated journaling tools like TradesViz or Trademetria, they can do the math for you. These tools sync with your broker data and provide instant performance metrics, including your win rate, along with access to over 100 other key performance indicators [3] [[4]](https://www.tradesviz.com/brokers/Topstep Funded Accounts).
Why Win Rates Matter for Funded Traders
Your win rate doesn’t just measure your success – it also illustrates your trading discipline, which is a big deal for prop firms. It helps these firms separate skilled traders from those who rely on luck. That said, a high win rate alone won’t guarantee a payout. Firms like Apex Trader Funding and Take Profit Trader evaluate win rates alongside other metrics, such as profit factor and adherence to prop firm consistency rules, to assess a trader’s overall performance [[4]](https://www.tradesviz.com/brokers/Topstep Funded Accounts) [1].
"Firms want to see that your profits are distributed across multiple trading days, demonstrating a repeatable edge rather than gambling behavior."
- ThePropFirmGuide [1]
Maintaining a stable win rate, combined with consistent position sizing, often helps traders stay within the 20–40% consistency thresholds that many firms enforce [1]. This is essential because even if you hit your profit target, uneven profit distribution can delay your payout. Prop firms want to see steady, disciplined trading before they reward you [1].
How to Track Win Rates Manually
Skip the hassle of software subscriptions by using a straightforward, well-organized spreadsheet.
Creating a Trade Tracking Spreadsheet
Start by setting up 12 essential columns: Date, Instrument, Direction (Long/Short), Entry Price, Stop Loss, Exit Price, Size, P&L ($), R-Multiple, Setup Tag, Session, and Notes [5]. These categories cover all the critical details of your trades without overcomplicating things.
To minimize errors, use dropdown menus for fields like "Direction" (Long/Short). Keep your raw data separate from a "Dashboard" tab to safeguard formulas, and freeze the top row to keep headers visible as you scroll through your trades.
For quick insights, apply conditional formatting to the P&L column – green for profits, red for losses. If you’re working with a funded account, consider adding a "Followed Plan (Y/N)" column to monitor discipline. Even the best strategies can fail without consistent execution.
Once your spreadsheet is set up, you can incorporate formulas to calculate win rates and other performance metrics.
Formulas for Calculating Win Rates
To calculate your win rate, use this formula:
=COUNTIF(H2:H,">0")/COUNTA(H2:H)
This assumes your P&L data is in column H. For better readability, you can name your P&L column "PnL" and rewrite the formula as:
=COUNTIF(PnL,">0")/COUNTA(PnL)
Here are additional formulas to track key metrics:
| Metric | Formula Syntax | Purpose |
|---|---|---|
| Win Rate | =COUNTIF(H2:H,">0")/COUNTA(H2:H) |
Percentage of trades that were profitable |
| Profit Factor | =SUMIF(H2:H,">0")/ABS(SUMIF(H2:H,"<0")) |
Gross profit divided by gross loss |
| Average Winner | =AVERAGEIF(H2:H,">0") |
Average profit per winning trade |
| Expectancy ($) | =(WinRate * AvgWinner) + (LossRate * AvgLoser) |
Expected profit or loss per trade |
| Running P&L | =SUM($H$2:H2) |
Tracks cumulative profit for equity curve charting |
For funded traders, the R-Multiple metric is particularly valuable because it standardizes returns based on the risk taken. Use this formula:
=IF(C2="Long",(F2-D2)/(D2-E2),(D2-F2)/(E2-D2))
Wrap it with IFERROR to avoid errors in empty rows.
"You’ll need a minimum of 30 trades under your belt to achieve statistical significance. In simpler terms, drawing conclusions from fewer trades than this would be premature."
- Daniel Larsen, Trader and Mentor [6]
Set aside time each week – either Friday or Sunday – for a performance review. Use Pivot Tables to filter and analyze your results by Setup Type or Session. This habit helps you pinpoint which strategies are delivering and which ones need adjustment. Plus, manual tracking keeps you disciplined and compliant with the requirements of funded accounts.
Best Tools for Automated Win Rate Tracking
Manual spreadsheets might give you control, but automated tools take win rate tracking to the next level by directly syncing with broker data. These platforms integrate seamlessly with futures prop firms like Apex Trader Funding, Topstep, and others, offering a centralized view of performance across multiple funded accounts. Here’s a breakdown of three top platforms that make tracking win rates easier.
TradesViz
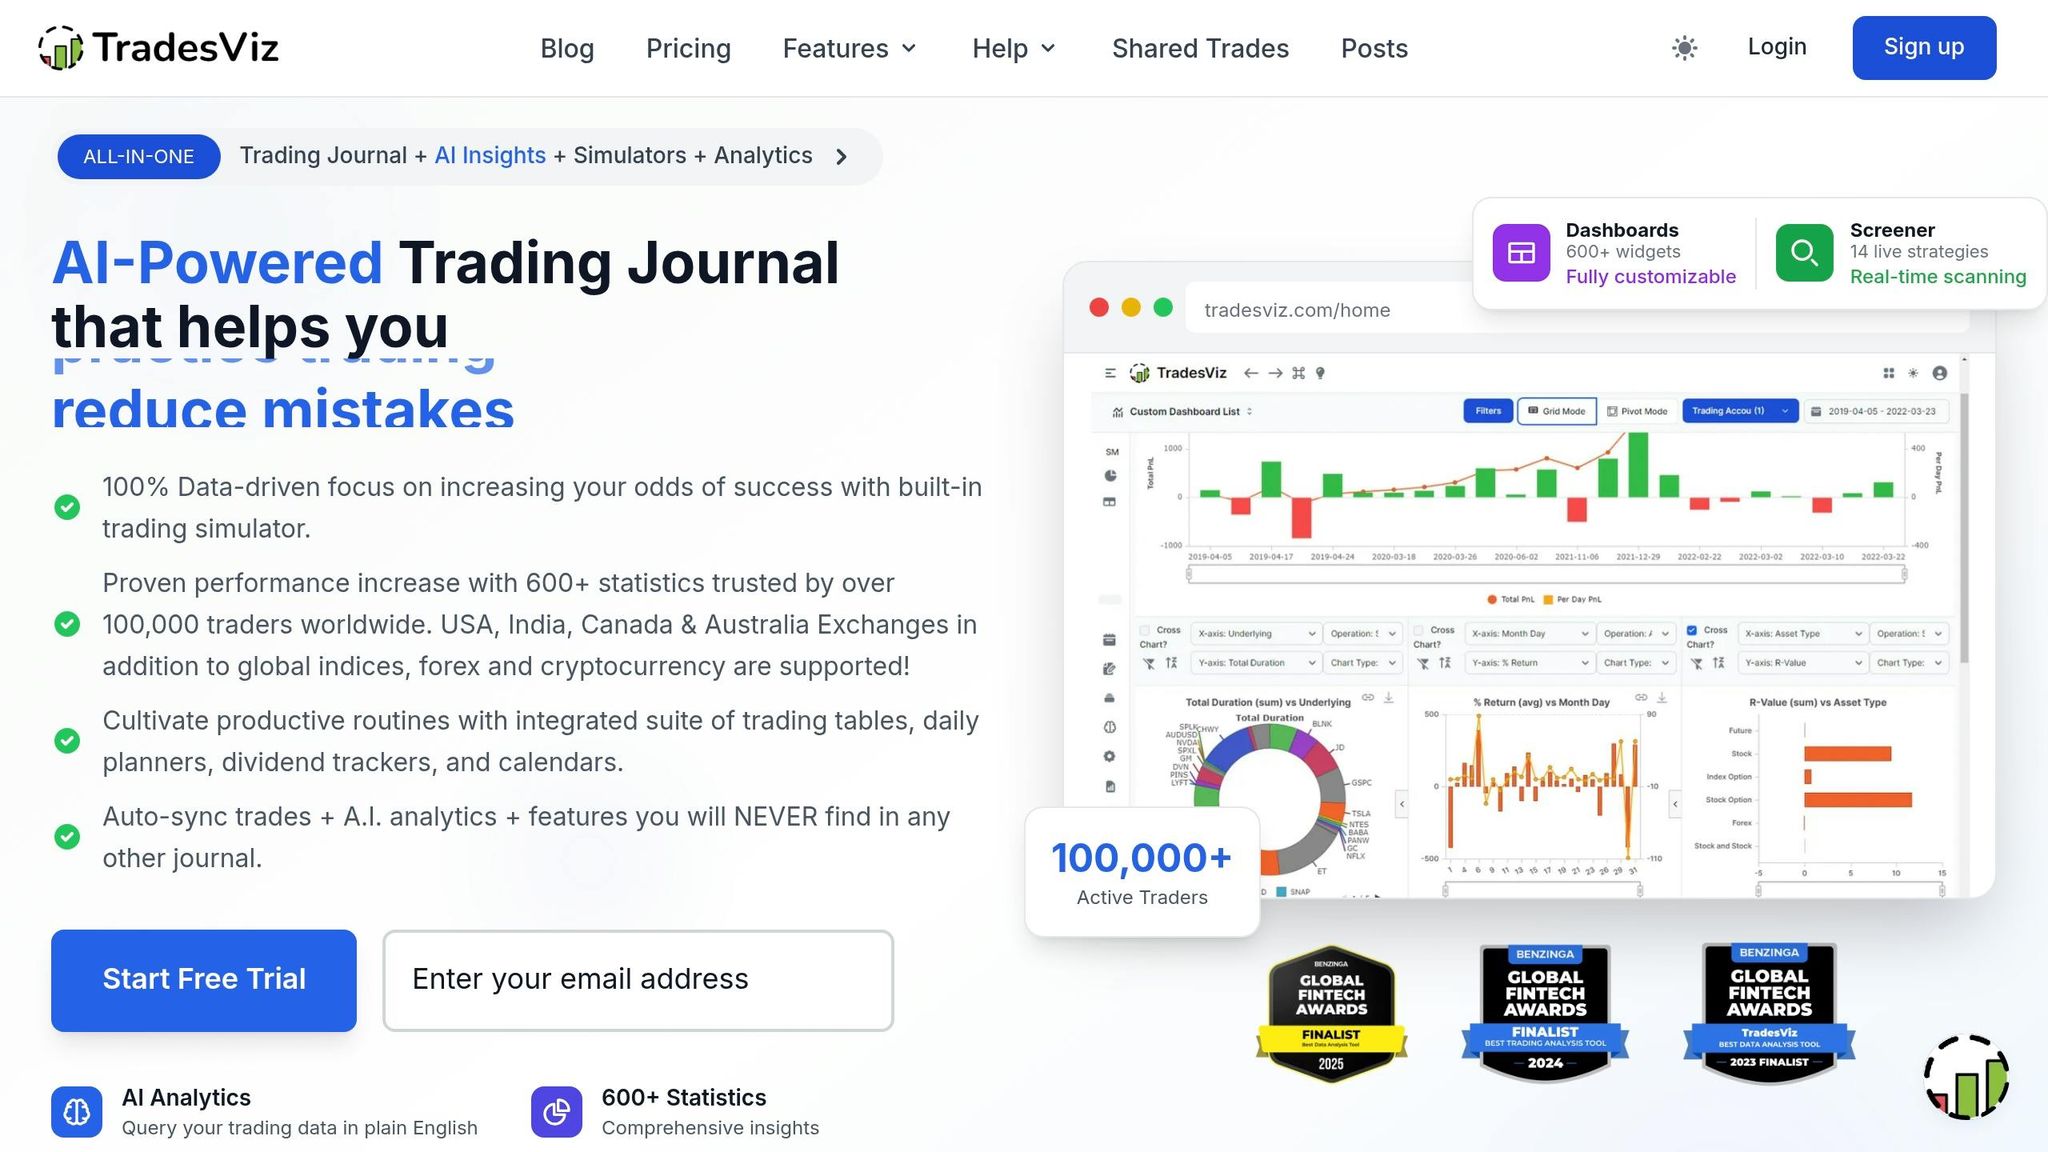
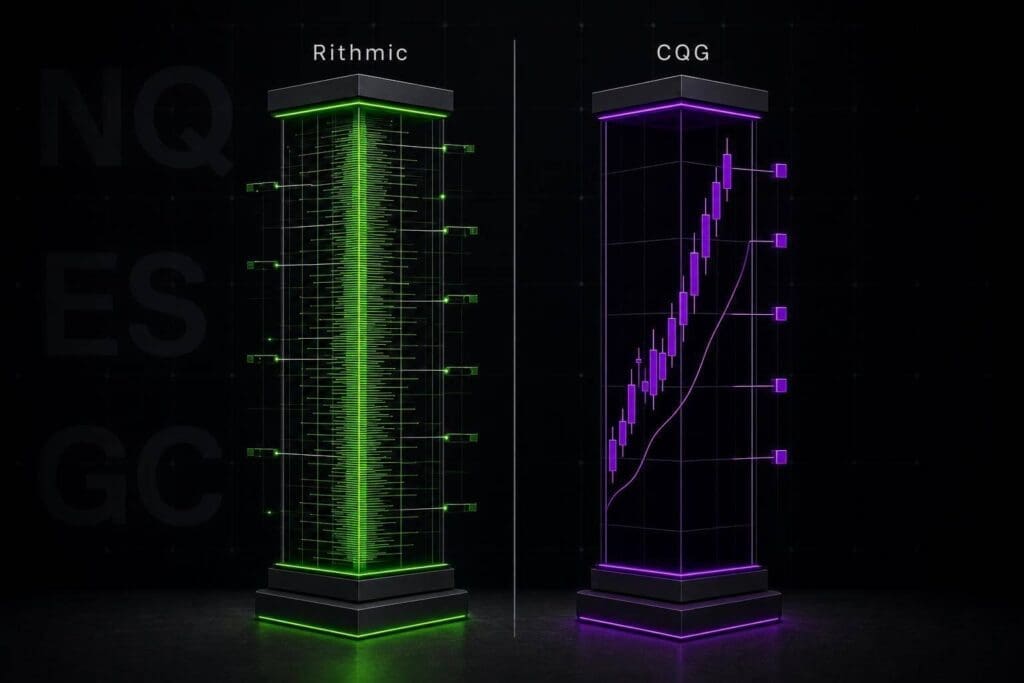
TradesViz stands out with its 40 auto-sync integrations, connecting to brokers and platforms like Rithmic, Tradovate, NinjaTrader, and Interactive Brokers. It offers over 600 charts and metrics, covering everything from basic win rates to advanced analytics like MFE/MAE (Maximum Favorable/Adverse Excursion) and exit efficiency. For traders juggling multiple funded accounts, TradesViz consolidates all data into one dashboard, making it easy to monitor win rates, drawdowns, and consistency side-by-side. Its second-by-second trade replay and sub-minute charting provide a detailed view for refining exit strategies.
Here’s what one trader had to say:
"The level of detail and ability to really dig deep on metrics is unparalleled. This tool has helped me so much in defining my trading strategy and where my edge is."
- Jeremy, Trader [7]
TradesViz was also a finalist in the Benzinga FinTech Awards for "Best Data Analysis Tool." Pricing starts with a free Basic plan (up to 3,000 executions per month), while the Pro plan costs $19.99/month (or $14.99/month billed yearly), and the Platinum plan is $29.99/month (or $22.49/month billed yearly) [7].
TradeZella
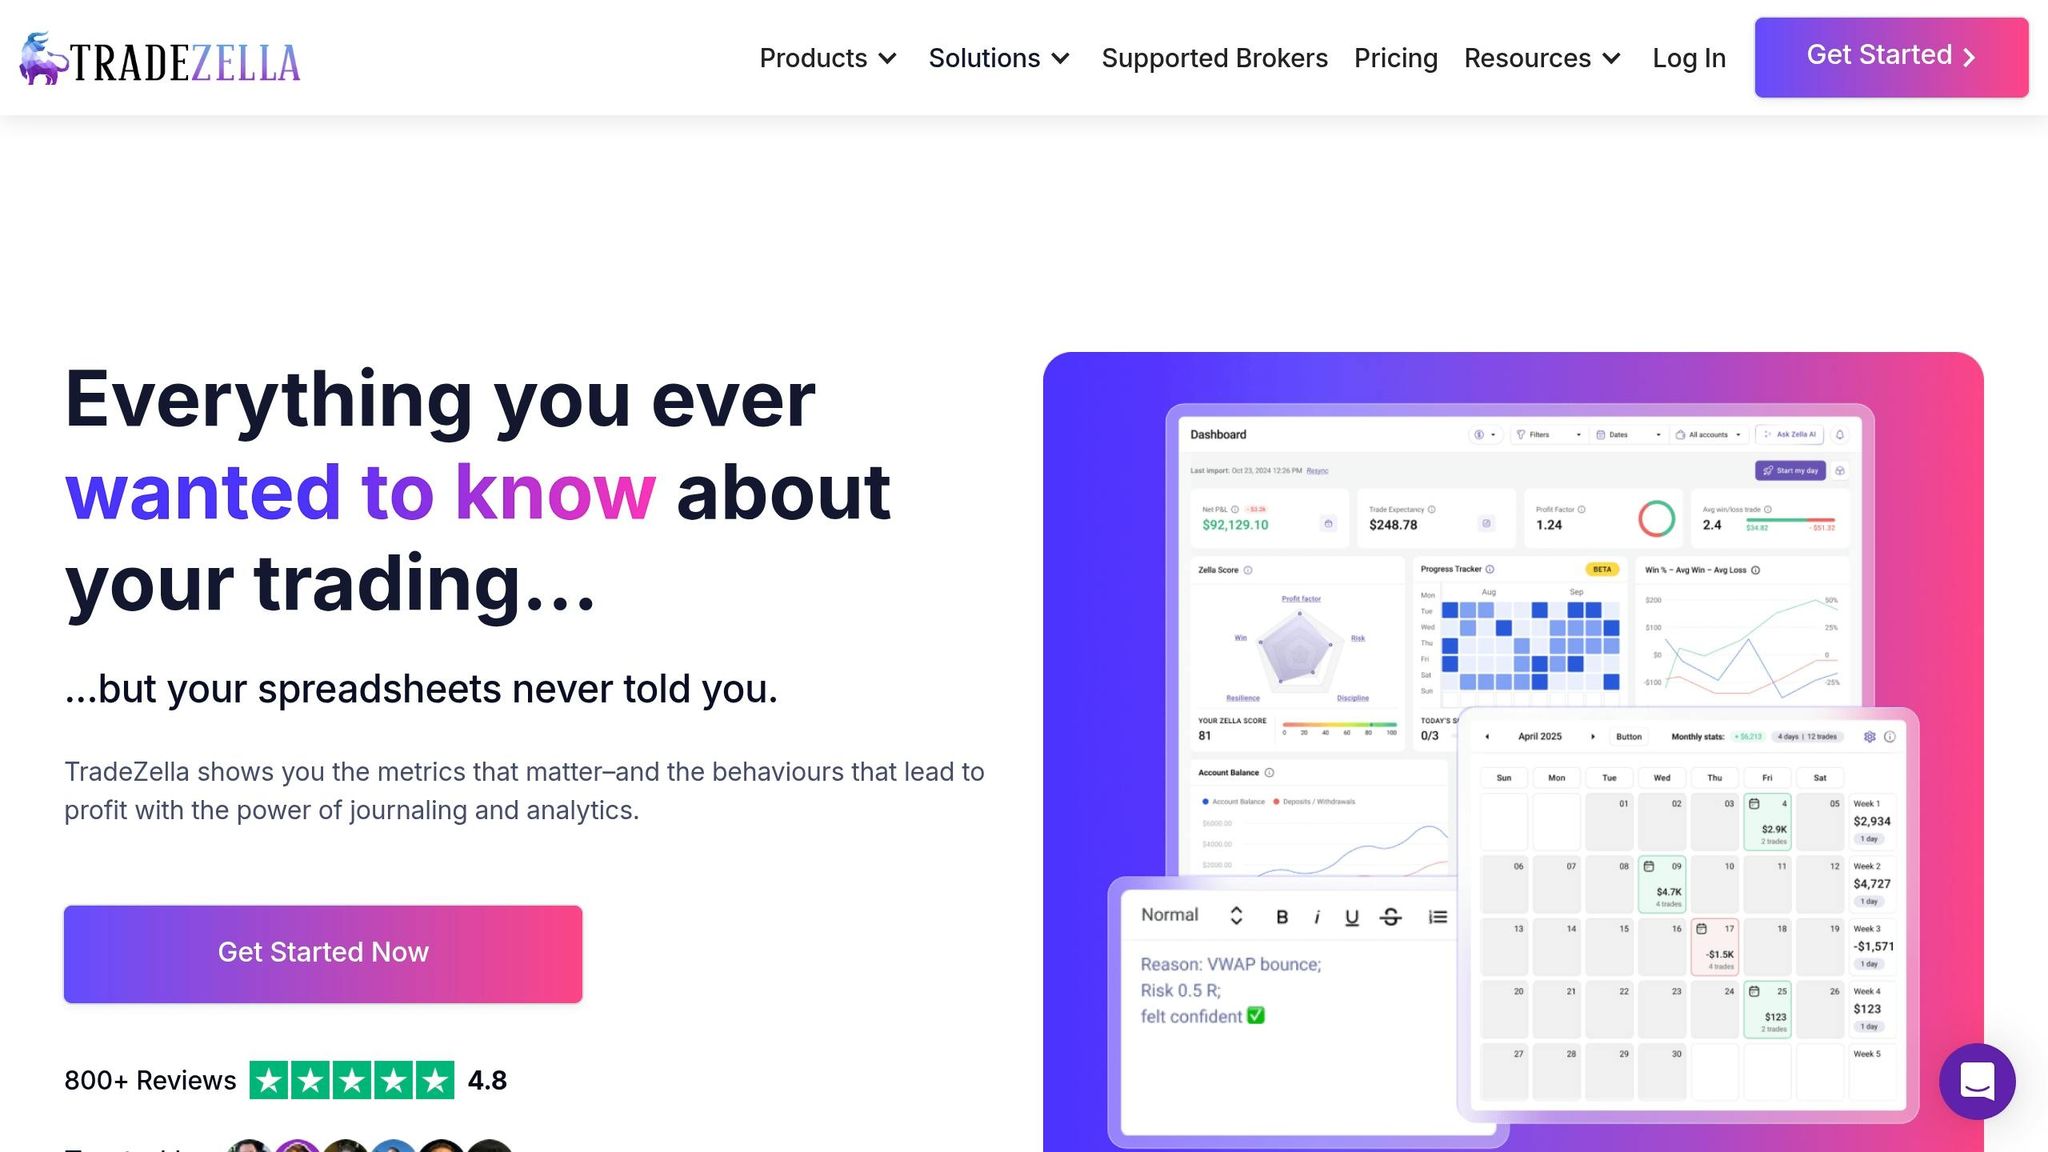
TradeZella offers a streamlined dashboard, with its PropFirm Sync feature being a standout. This free tool tracks spending and payouts across various prop firms by connecting to your bank account via Plaid. It automatically categorizes evaluation fees, resets, and withdrawals, giving traders a clear view of their ROI – especially useful for those navigating firms like FundedNext Futures or Tradeify.
In addition to financial tracking, TradeZella keeps tabs on rule compliance in real time, sending alerts to prevent breaches of daily loss limits or drawdown thresholds. It even categorizes failure reasons – like overtrading, revenge trading, or news event mishaps – helping traders identify patterns. Interestingly, TradeZella found that 67% of evaluation failures stem from overtrading [9]. The tool syncs with NinjaTrader, MetaTrader 4/5, Tradovate, and Rithmic, making it a practical choice for traders managing multiple funded accounts.
Tradervue
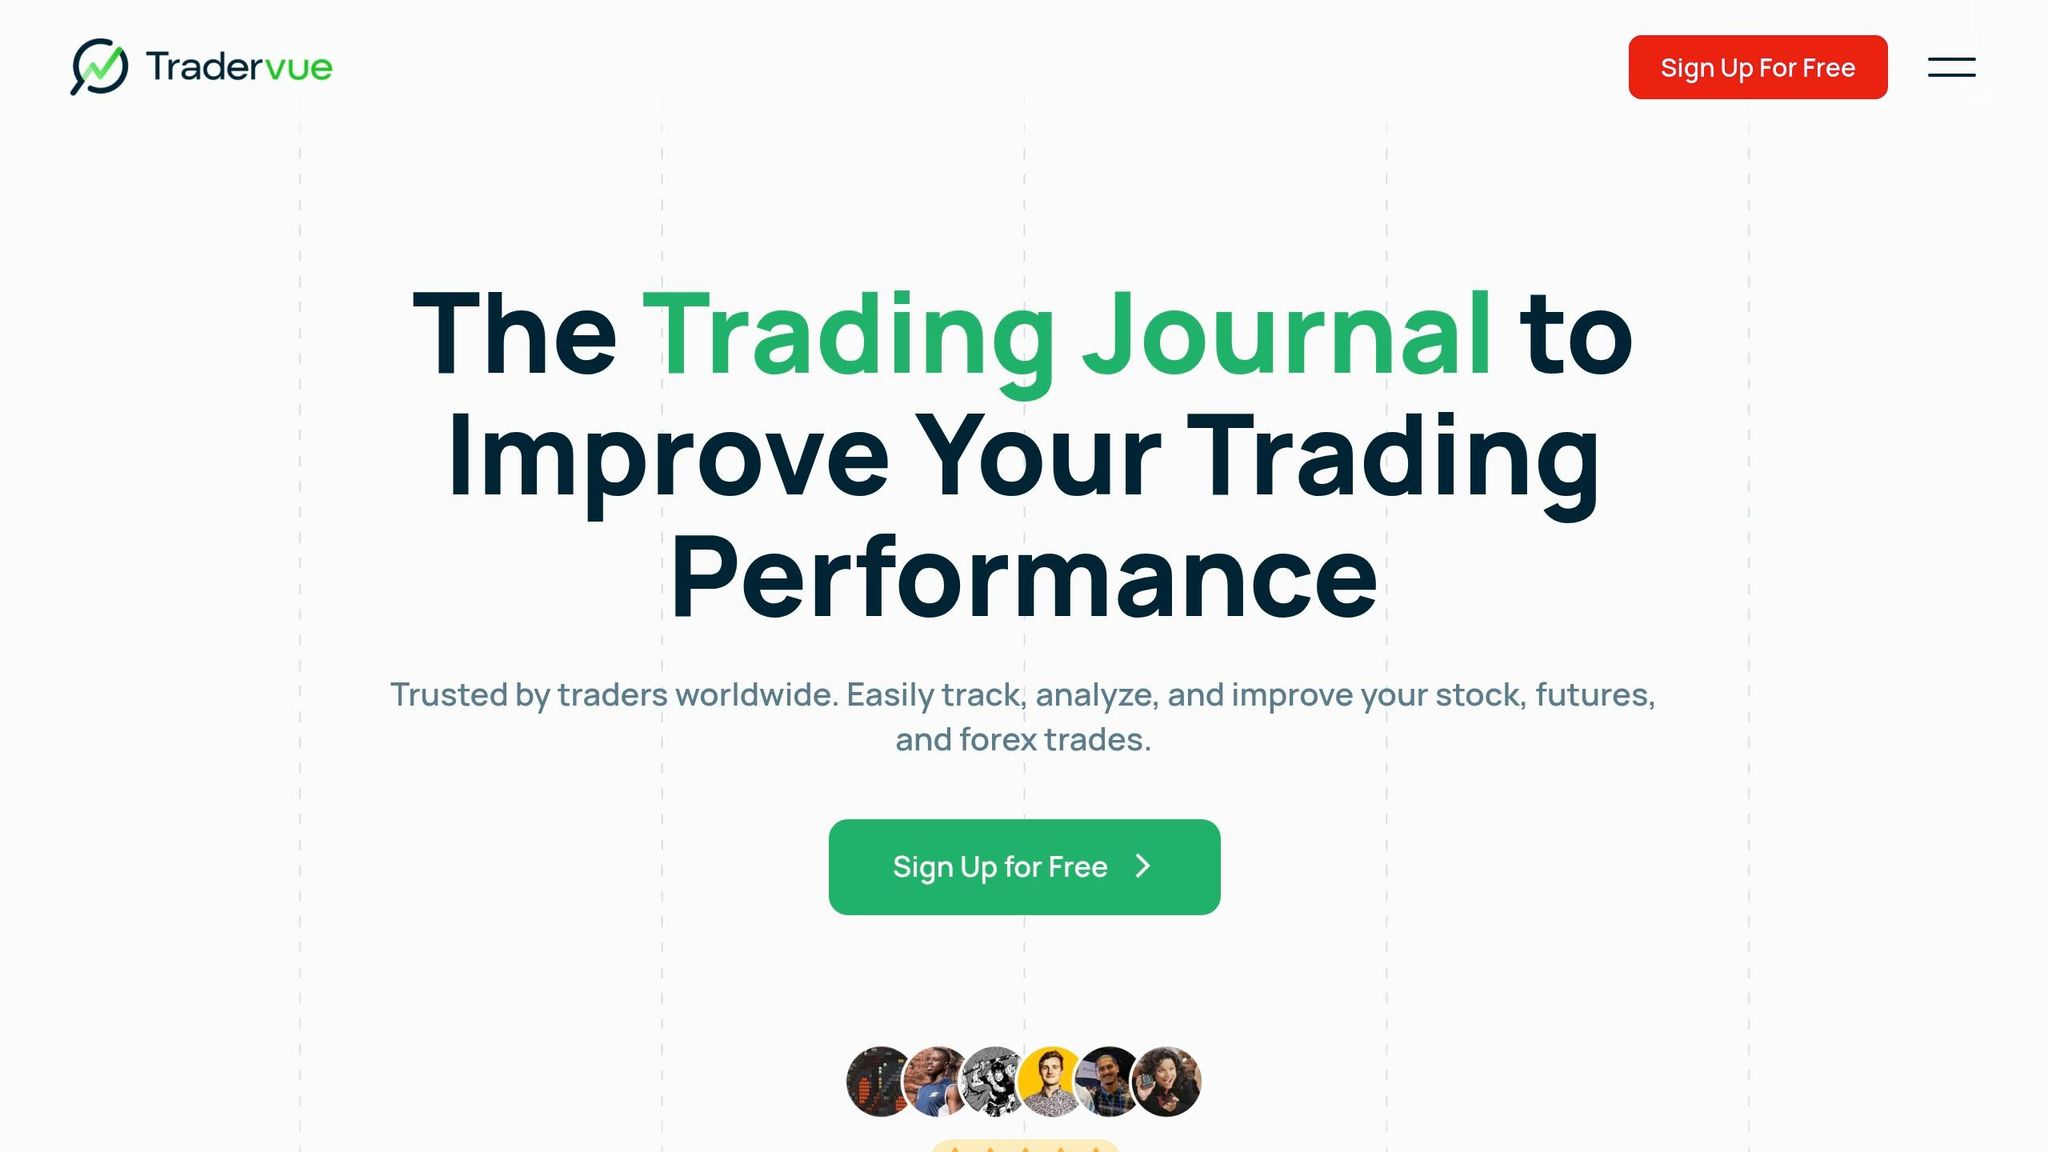
Tradervue is another excellent option for tracking win rates across multiple funded accounts. It provides detailed P&L analysis and MAE/MFE metrics to pinpoint how exit timing impacts performance. With tagging features, traders can classify trades by setup type, session, or strategy, allowing for filtered reports that highlight profitable playbooks. Tradervue integrates with major platforms and supports bulk CSV imports, making it compatible with accounts from firms like Alpha Futures or Lucid Trading.
For those focused on payout eligibility, PropTally offers a specialized tool that tracks specific prop firm criteria – like consistency, trading days, and buffer levels – in real time. It monitors over 30 prop firms and sends alerts when you’re ready for withdrawals. As one trader shared:
"Finally a tracker that actually understands prop firm rules. The drawdown monitoring alone has saved me from blowing two evaluations."
- Mike R., Futures Trader, Apex [8]
Aligning Win Rates with Prop Firm Rules
Tracking your win rate is just the beginning – your trading performance also needs to align with the specific rules set by prop firms to qualify for payouts. These rules, often designed to ensure consistent performance, prevent traders from relying solely on one or two exceptionally profitable days. Firms like Apex Trader Funding and Tradeify have such guidelines in place. Let’s break down how you can verify compliance with these rules using available tools.
Using the Consistency Rule Calculator
The Consistency Rule Calculator from DamnPropFirms is a handy tool for checking whether you meet a prop firm’s payout requirements. It works with a straightforward formula: Biggest profit day ÷ Consistency % = Total profit required [10].
Here’s an example: Suppose your best trading day brought in $2,500, and Tradeify requires a 20% consistency threshold for your first payout. In this case, your total profit must reach $12,500 ($2,500 ÷ 0.20) to meet the rule. If you haven’t hit that mark yet, you’ll need to focus on generating smaller, steady wins to close the gap.
Different firms enforce varying thresholds. For instance:
- Tradeify Lightning Accounts (opened after September 12, 2025) use a tiered system: 20% for the first payout, 25% for the second, and 30% for all subsequent payouts.
- Tradeify Advanced/Growth Sim Accounts require a flat 35% maximum consistency threshold.
- FundedNext Futures Legacy Challenge accounts, on the other hand, impose no consistency rules at all [10].
Using tools like the Consistency Rule Calculator and staying informed about these differences can make all the difference in ensuring compliance.
Staying Updated on Rule Changes
Prop firm rules aren’t static – they evolve, and failing to keep up could cost you payouts. Regularly reviewing your performance metrics and staying informed about updates is key to staying compliant. For example, Apex Trader Funding introduced significant rule changes on March 1, 2026. They transitioned from end-of-day drawdown models to real-time trailing drawdowns based on your peak intraday balance [2]. This means your account equity must remain above the drawdown limit throughout the trading session, not just at the end of the day. A drop below the limit, even if temporary, could result in account termination.
Another major change with Apex is that after your first payout, the Maximum Loss Limit resets to $0. This ensures your balance cannot dip below your starting capital [2]. Additionally, they’ve removed daily loss limits and now allow news trading, except for high-risk scalping during volatile news releases [2]. These updates provide more flexibility but require disciplined management of your win rate and drawdowns.
To keep up with these evolving rules across firms like Topstep, Alpha Futures, and Lucid Trading, regularly check DamnPropFirms’ verified reviews and use tools like the Consistency Rule Calculator. Adapting to these changes can help you maintain compliance and secure your payouts.
Advanced Metrics to Track
Tracking win rates is a good start, but it only scratches the surface when managing funded accounts. To truly understand the sustainability of your trading strategy and ensure compliance with prop firm rules, you need to dive deeper. These additional metrics help complete the picture, giving you a clearer view of your trading edge.
Key Performance Metrics for Funded Accounts
One critical metric is Profit Factor, which measures the ratio of your gross profit to your gross loss. If this number is above 1.0, you’re profitable overall. The higher it is, the more buffer you have against drawdowns. For example, a Profit Factor of 2.0 means you earn $2 for every $1 lost [11]. This metric is especially important for funded accounts because it indicates whether your strategy can handle the firm’s maximum loss rules.
Expectancy is another essential metric. It calculates the average dollar amount you can expect to win or lose per trade by combining your win rate with the size of your average wins and losses [11]. A positive expectancy suggests your strategy is profitable in the long run – provided you stick to it. For traders working with firms like Lucid Trading or Purdia, this number can help determine whether you’ll meet profit targets within the required timeframe.
R-Multiple (or R-Value) is a way to measure outcomes relative to risk [11]. For instance, a 2R trade means you earned twice the amount you risked. Even if you have a low win rate – say 30% – you can still be profitable if your average R-Multiple is high, such as 3R or more. This metric highlights the importance of focusing on the size of your winners versus your losers.
Two other metrics to keep an eye on are Maximum Favorable Excursion (MFE) and Maximum Adverse Excursion (MAE). MFE tracks the highest unrealized profit during a trade, helping you assess whether you’re exiting too early and leaving potential gains behind. On the flip side, MAE measures the deepest unrealized loss, which can help you fine-tune your stop-loss placement [11][7].
When combined with your win rate, these metrics provide a more complete understanding of your performance and help ensure you stay within the rules set by your funded account provider.
| Metric | Purpose | Why It Matters for Funded Accounts |
|---|---|---|
| Profit Factor | Ratio of Profit/Loss | Indicates if your strategy can handle drawdown limits [11] |
| Expectancy | Avg. Win/Loss per trade | Helps predict if you’ll meet profit targets over time [11] |
| R-Multiple | Risk-adjusted return | Ensures a positive reward-to-risk ratio [11] |
| Max Drawdown | Peak-to-trough decline | Essential for staying within the firm’s loss limits [11] |
Building Custom Dashboards
Keeping track of all these metrics manually can get overwhelming. That’s where custom dashboards come in. Tools like TradesViz make it easier to consolidate and monitor your performance indicators. With over 600 metrics and charts available [7], you can tailor dashboards to suit your trading needs. This is especially helpful if you’re managing accounts across multiple firms like Lucid Trading and Purdia. You can tag accounts and create separate dashboards to match each firm’s rules [11][7].
For example, you might set up one dashboard to track Profit Factor, Expectancy, and MFE/MAE for your Lucid Trading account, while another focuses on R-Multiples and drawdown depth for your Purdia account. TradesViz even offers Running PnL analysis, allowing you to see short-interval snapshots of your equity movement [11].
The pricing for these tools is reasonable: TradesViz offers a free basic version, while the Pro plan costs $19.99/month, and the Platinum plan is $29.99/month [7]. For traders managing multiple funded accounts, this small investment can quickly pay off by helping you identify which strategies are boosting your performance – and which ones are holding you back.
Conclusion
To wrap things up, the real key to success lies in turning your insights into action through a disciplined review process. A high win rate only matters if it leads to ongoing improvements. Regular reviews are a reliable way to spot patterns and inefficiencies, helping you refine your approach over time[13].
Using a mix of manual tracking, automated tools like TradesViz, and advanced metrics such as Profit Factor, Expectancy, and R-Multiple can give you a clearer picture of your performance[13][14]. Dedicating just 5 minutes daily, 30 minutes weekly, and an hour monthly to structured reviews can lead to noticeable progress. This habit not only sharpens your trading edge but also ensures you stay within the rules of prop firms, protecting your funded account from unexpected violations. And that consistency can be the difference between struggling to pass evaluations and thriving with firms like Apex Trader Funding or Take Profit Trader.
Funded accounts demand both profitability and strict rule compliance. Regular reviews help you avoid costly mistakes, like breaching drawdown limits or missing consistency requirements, which could derail weeks of hard work[12][15]. Tools like the Consistency Rule Calculator on DamnPropFirms can keep you aligned with the ever-changing requirements of these firms.
Think of your trading as a business, not a casual hobby. Successful traders aren’t just the ones with the best win rates – they’re the ones who track meaningful metrics, review their data regularly, and adapt their strategies based on what the numbers show[12][16]. Start building that system now, and you’ll set yourself up to maximize payouts and steadily grow your funded accounts.
FAQs
What win rate do I actually need to get funded payouts?
The win rate required to achieve funded payouts depends largely on the specific evaluation rules and payout criteria set by each proprietary trading firm. While some traders might focus on achieving a high win rate, most firms prioritize consistent performance over time. Meeting profit targets and adhering to consistency guidelines is often more important than hitting a specific win percentage.
Although a higher win rate can be beneficial, factors like strong risk management and maintaining steady profitability play an equally critical role in qualifying for payouts. Each firm has its own criteria, so understanding their specific rules is key to meeting eligibility requirements.
How many trades should I log before my win rate is meaningful?
When it comes to understanding your win rate, it starts to hold weight only after you’ve logged at least 100 trades. This is why backtesting guidelines emphasize tracking a minimum of 100 trades per strategy. Doing so allows you to properly analyze key performance metrics like win rate, profit factor, and maximum consecutive losses.
One critical metric to watch during backtesting is the profit factor. If it falls below 1.2, it could signal potential problems with the strategy’s performance in live trading. This makes having a large enough sample size essential for drawing reliable conclusions and avoiding misleading results.
What should I track besides win rate to stay within drawdown and consistency rules?
To keep your funded account in good standing, it’s crucial to monitor more than just your win rate. Pay close attention to metrics like drawdown and consistency rules, which help you stay within the account’s limits. Key areas to track include:
- Daily loss limits: The maximum amount you’re allowed to lose in a single day.
- Trailing drawdowns: These adjust based on your account’s performance, ensuring you don’t give back too much of your gains.
- Overall risk management: This includes factors like your maximum drawdown and how much profit you contribute daily.
Keeping an eye on these metrics not only ensures compliance with the firm’s rules but also helps you maintain a healthy and sustainable trading account.