Market Profile shows where price traded across time brackets, not how many contracts changed hands. I use that distinction as the starting point: TPO charts map repeated price participation; volume profile maps traded volume differently than standard price action. Neither tells you to hit buy or sell.
Here, I’ll break down the letters, POC, roughly 70% value area, and initial balance so you can read ES and NQ profiles without mistaking every level for a trade. I’ll also explain why session settings and row size change what you see. The goal isn’t another chart signal. It’s a clearer plan for where to watch price, <u>what would prove your read wrong</u>, and how much risk your account can take through proper position sizing.
Volume Profile Basics: Value Areas, Low Volume Nodes, Point of Control and More with Bruce
sbb-itb-46ae61d
H2: How TPO Charts Work
The time-based framework tells you what TPO tracks. The chart shows how that activity lines up across price levels.
H3: Reading TPO Letters, Blocks, and Price Rows
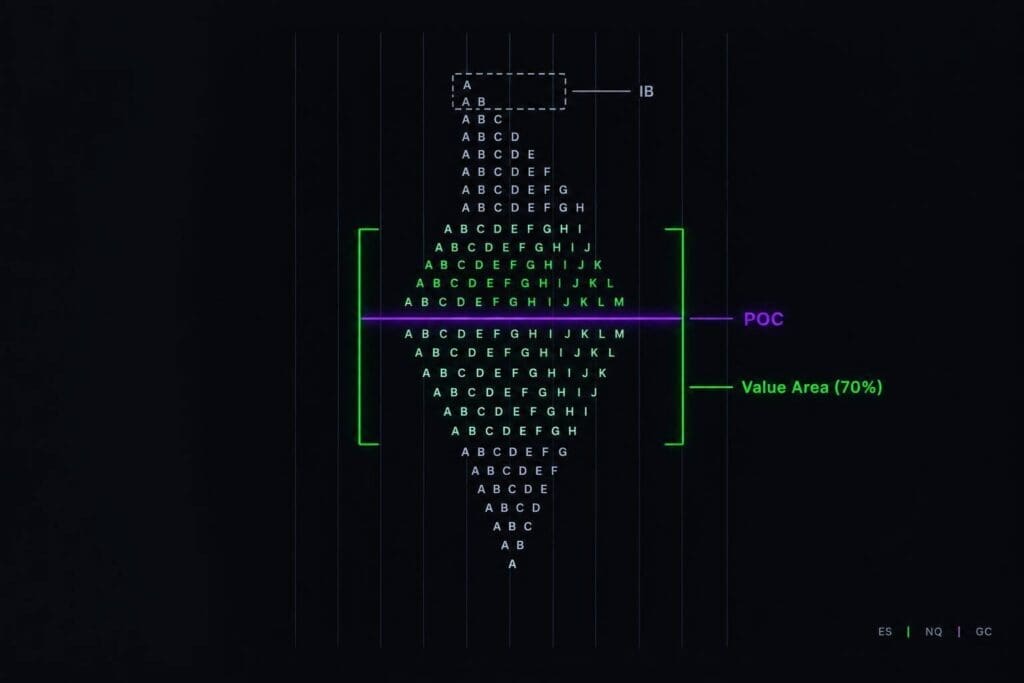
A Time Price Opportunity (TPO) marks a price level traded during a specific time bracket. Price runs vertically, while letters or blocks identify each bracket.
With 30-minute brackets, letters such as A, B, and C label successive intervals. Each price row shows whether price traded there during that bracket. You’re reading participation by bracket, not the exact time spent at each price. That helps you judge where the market accepted price and where it moved on quickly.
H3: Setting Sessions, Brackets, and Row Size
Stick with one session template: the regular cash session (9:30 a.m.–4:00 p.m. ET), overnight, or full session. Check it against CME Group’s trading hours, including holiday changes. [1]
Shorter brackets add more TPOs and can make the profile broader. ES and NQ both have a 0.25-point minimum tick; check the contract specifications through CME Group. [1] One-tick rows give you finer detail. 2-tick (0.50-point) and 4-tick (1.00-point) rows group more prices into each row.
In ES and NQ, that choice can change whether a session looks concentrated or stretched.
Keep those settings consistent. A broad profile can reflect your chart settings, not stronger acceptance.
With the chart built, the next levels to read are POC, value area, and initial balance.
H2: POC, Value Area, and Initial Balance
Use POC, value area, and IB to map where price found acceptance, met rejection, or extended its range.
| Level | Definition | Contextual use |
|---|---|---|
| TPO POC | Price row with the most TPO letters or blocks. | Shows the most repeated participation across time brackets. |
| VAH | Upper boundary of the value area, which covers about 70% of session TPOs. | Helps judge acceptance above value or a return inside it. |
| VAL | Lower boundary of the TPO value area. | Helps judge acceptance below value or a return inside it. |
| IB high | Highest price during the first two 30-minute brackets. | Reference for measuring upside range extension. |
| IB low | Lowest price during the first two 30-minute brackets. | Reference for measuring downside range extension. |
H3: TPO Point of Control and the 70% Value Area
TPO POC measures time-based participation, not traded volume. It isn’t necessarily the price where the most contracts traded or the midpoint of the value area.
Platforms use different POC and value-area rules, so check your platform’s docs for the exact calculations.[1] Keep these levels separate from volume-profile POC and value area, which use contracts traded rather than TPO counts.
H3: Initial Balance and Range Extensions
A move beyond IB high or low is a range extension. Continued trade outside the IB suggests acceptance. A quick return inside suggests rejection.
The next section compares these time-based references with volume profile.
H2: TPO Charts vs. Volume Profile
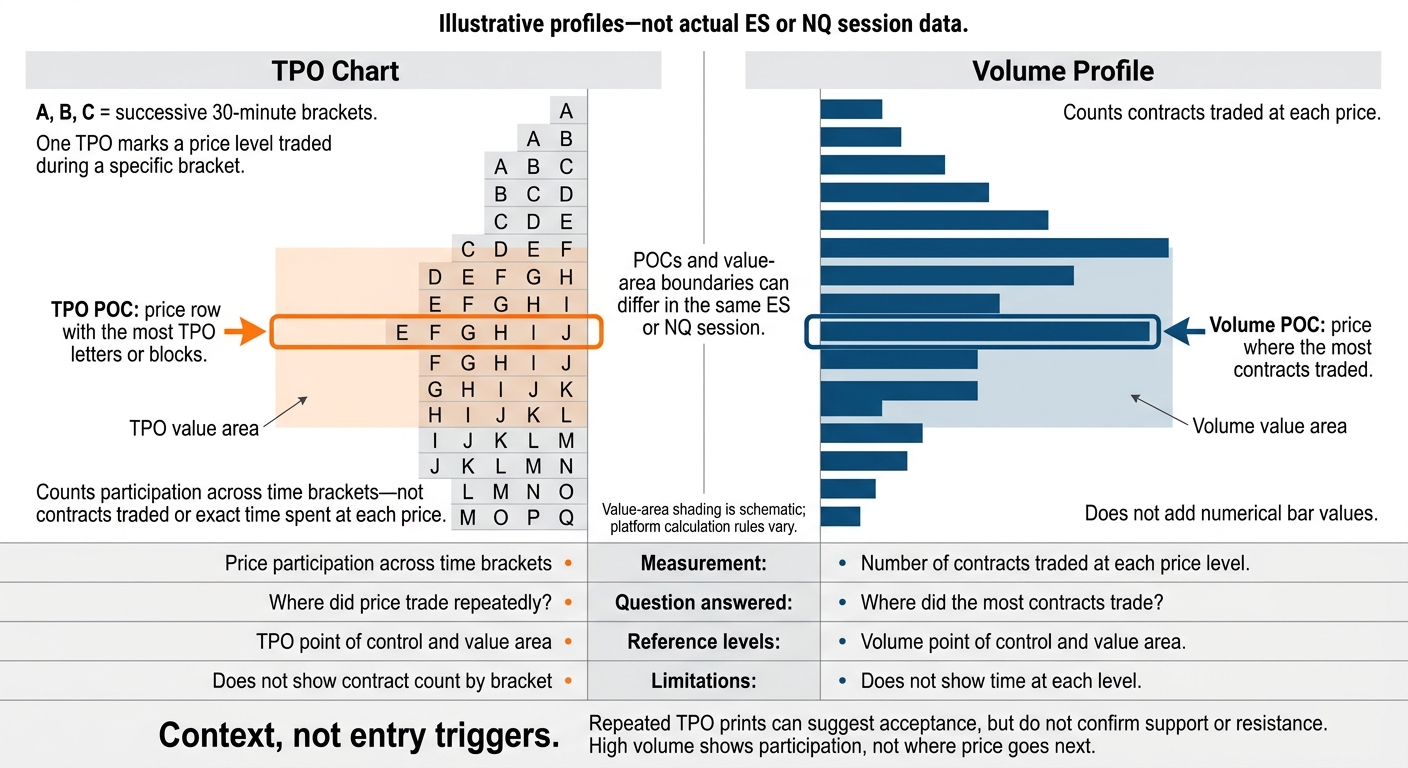
TPO Charts vs. Volume Profile: What Each Measures
TPO counts participation across time brackets. Volume profile counts contracts traded at each price. On the same ES or NQ session, the TPO POC and volume POC can sit at different prices, with different value-area boundaries.[1]
| Feature | TPO chart | Volume profile |
|---|---|---|
| Measurement | Price participation across time brackets | Number of contracts traded at each price level |
| Question answered | Where did price trade repeatedly? | Where did the most contracts trade? |
| Reference levels | TPO point of control and value area | Volume point of control and value area |
| Limitations | Does not show contract count by bracket | Does not show time at each level |
Use both for context, not as entry triggers. High volume tells you traders participated, not where price goes next. Repeated TPO prints can suggest acceptance, but they don’t confirm support or resistance. Together, these profiles help you assess where price was accepted or rejected, and where participation was thin. Those differences shape whether the profile looks balanced or directional.[1]
H2 Reading Profile Shapes, Acceptance, and Rejection
Once POC, value area, and IB are set, profile shape helps you read acceptance or rejection at those levels. Use shape as auction context, not a prediction.
H3 Balanced, Directional, P-Shaped, and b-Shaped Profiles
A balanced, or D-shaped, profile shows repeated rotation around a central area. A directional profile is narrow, with little bracket overlap.
P-shaped profiles are upper-heavy, often forming after an upside move stalls into balance. b-shaped profiles are lower-heavy, often forming after a downside move stalls into balance. Neither shape alone proves short covering or long liquidation. They describe the auction; they don’t tell you what comes next.
Conceptual profiles – not actual ES or NQ sessions. Each block represents one TPO.
Balanced (D) Directional P-shaped b-shaped ██ █ ████ █ ████ ██ █████ █ ██████ █ ████ ██ ████ ██ █ ████ ██ █ █ █████ Wide center Thin overlap Upper-heavy Lower-heavy
H3 Profile Width, Single Prints, and Rejection Tails
As a profile gets wider at a price, more brackets overlap there. Repeated overlap and returns suggest acceptance. Single prints show participation in just one bracket, with limited acceptance.
Brief visits and tapered extremes can suggest rejection and help you assess potential support and resistance. But thin structure isn’t automatically a reliable level. A fast move can leave it behind without establishing support or resistance.
In ES or NQ, repeated rotation through prior value signals balance; added overlap at higher prices shows developing acceptance, not a guaranteed continuation.
Developing profiles change intraday. Keep your session settings and row size consistent so you’re comparing like with like. Read shape alongside the open, prior value, and developing profile, rather than treating it as guaranteed support or resistance.
Using Profile Levels in Futures Trading
Reading the profile is one thing. Turning it into a trade takes a plan. Use profile levels for context, then set your trigger and invalidation before entering. Build your ES or NQ plan in two steps: read the auction, then define the trigger.
Reading the Open, Prior Value, and Developing Profile
Before the session, mark prior VAH, VAL, and TPO POC, along with overnight highs and lows. Compare the open with prior value. Then watch whether price holds, rejects, or reclaims that area.
An inside-value open points to balance until price proves otherwise. An outside-value open points to possible imbalance, especially around scheduled news and event-driven volatility.
Overlap above prior VAH signals acceptance. A fast return into prior value weakens that read. If an IB extension returns inside the IB, the breakout has failed so far. A pullback that holds a broken level can give you a trigger, but you still need a defined invalidation.
Make those reads specific enough to set your entry, stop, and invalidation.
Trade Invalidation and Funded-Account Risk
Decide what would disprove the trade before placing the order. For a continuation setup, losing the reclaimed level may invalidate the idea. Your stop distance also needs to account for volatility. Size the position to the stop, not the setup.
At $50 per ES point, a 4-point stop risks $200 per contract before fees and slippage. [1]
Check that your planned risk fits the remaining drawdown room and any daily loss limit that applies. Confirm copier or automation rules before the session opens. Account rules override the setup.
Run through the checklist before every trade.
A Pre-Trade Profile Checklist
| Check | Record before entering |
|---|---|
| Chart settings | Session boundaries, bracket duration, row size, and data feed/platform sync |
| Reference levels | Prior VAH, VAL, and POC; overnight extremes; and current IB boundaries |
| Auction context | Developing shape and evidence of acceptance or rejection |
| Trigger and risk | Entry condition, invalidation price, stop distance, and dollar risk |
| Invalidation check | What would change the read: return into value, failed IB extension, or acceptance beyond a reference |
| Risk room and news | Available risk room and scheduled news |
Bottom Line: Market Profile Is a Map, Not a Signal
Use profile for context, not an entry trigger. TPO shows time at price; volume profile shows contracts at price. Repeated TPO prints mean price returned across brackets. Heavy volume shows participation, not direction.
Once you can read the profile shape, watch price at key levels and keep your session settings consistent. Check whether price is building time at a reference or moving away from it. That’s where you look for acceptance or rejection. The reaction matters more than the level. A prior POC or value area marks a place to pay attention, not an automatic entry.
Turn your auction read into a trade plan only when price confirms it. Build a testable idea, not a thesis you’re determined to defend, and keep risk within your account’s limits. Your profile read should identify what to watch and what would prove you wrong. Drop the setup promptly when the read fails.
FAQs
Which TPO settings should I start with for ES or NQ?
Match your ES or NQ session times to the CME Globex schedule: Sunday at 6:00 PM ET through Friday at 5:00 PM ET. Set your platform’s daily session brackets correctly so it calculates the initial balance and point of control accurately.
During active market hours, focus on the value area. Treat TPO levels as context for possible support and resistance, not guaranteed trade signals.
What if TPO and volume profiles disagree?
When TPO and volume profiles disagree, treat them as context, not guaranteed signals. Only take a trade when multiple chart elements line up. Look for confirmation from price action or other structural levels.
If the readings still conflict, wait for a clearer setup. Don’t force a trade off one reading.
How can I distinguish acceptance from a false breakout?
Watch what price does around a key level. One touch isn’t enough. Acceptance means price holds beyond the breakout level, often with a pullback to that level for confirmation. A false breakout happens when price fails to hold and closes back on the other side. Indicators and chart patterns can support the read, but the main test is simple: does price stay beyond the level?