The E-mini S&P 500 (ES) futures market in 2026 offers unique opportunities due to high liquidity, steady price behavior, and evolving trading conditions. Key strategies include scalping during high-liquidity periods, trend following with moving average crossovers, and mean reversion using tools like VWAP and Bollinger Bands. With intraday volatility ranging from 40 to 80 points, risk management is critical – traders often use Micro E-mini contracts for flexibility and precise scaling. Best futures prop firms provide access to larger trading accounts, enabling traders to scale operations while adhering to strict rules like daily loss limits and news-flat periods. Mastering these strategies and tools is essential for navigating the dynamic ES futures market.
- Scalping: Focuses on quick moves during the New York Open using tick charts and key levels.
- Trend Following: Uses moving averages and VWAP during high-momentum sessions.
- Mean Reversion: Capitalizes on price returning to VWAP after overextensions.
- Risk Management: Emphasizes strict stop-losses, position sizing, and adhering to daily limits.
- Prop Firms: Offer affordable access to capital with rules tailored for disciplined traders.
ES Futures DAY TRADING Strategies That ACTUALLY Work!
sbb-itb-46ae61d
Top Technical Analysis Strategies for ES Futures in 2026
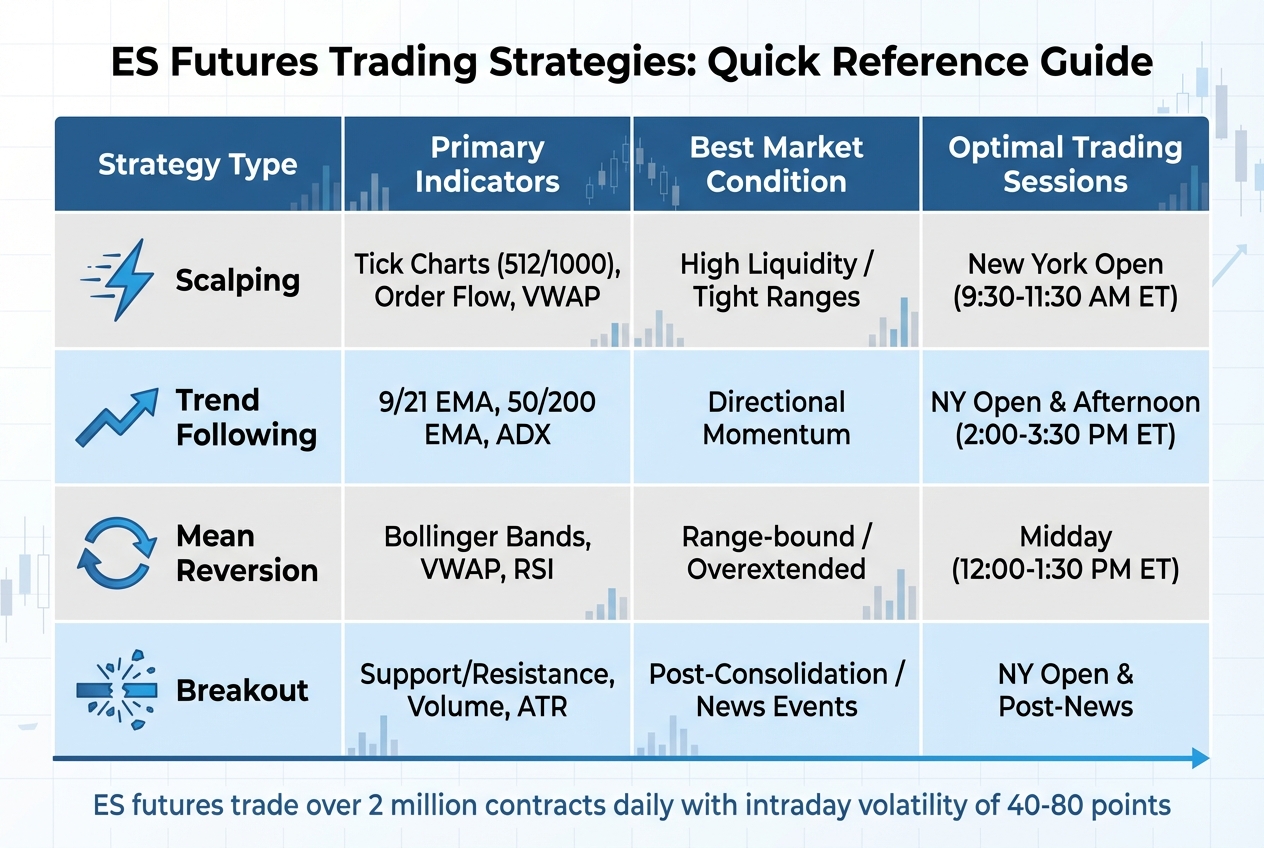
ES Futures Trading Strategies Comparison: Scalping, Trend Following, Mean Reversion & Breakout
ES futures trading in 2026 benefits from smoother price action and unmatched liquidity. The E-mini S&P 500, with over 2 million contracts traded daily, offers liquidity levels that dwarf those of all S&P 500 ETFs combined, including SPY. This depth makes technical setups more reliable compared to thinner markets.
Three key strategies dominate the trading landscape: scalping with price action breakouts, trend following using moving average crossovers, and mean reversion with Bollinger Bands and VWAP. Each approach is tailored to specific market conditions, leveraging the liquidity and volatility of ES futures for precise execution throughout the trading day. The table below highlights how these strategies align with various market scenarios:
| Strategy Type | Primary Indicators | Best Market Condition |
|---|---|---|
| Scalping | Tick Charts, Order Flow, VWAP | High Liquidity / Tight Ranges |
| Trend Following | 9/21 EMA, 50/200 EMA, ADX | Directional Momentum |
| Mean Reversion | Bollinger Bands, VWAP, RSI | Range-bound / Overextended |
| Breakout | Support/Resistance, Volume, ATR | Post-Consolidation / News |
The table underscores the importance of matching strategies to liquidity and volatility patterns. Knowing when to apply each method is as crucial as mastering the technical setups themselves. For instance, the New York Open (9:30–11:30 AM ET) is ideal for scalping and trend-following strategies, while the midday period (12:00–1:30 PM ET) often favors mean reversion plays. The afternoon session (2:00–3:30 PM ET) typically sees trend continuation as institutional traders return.
Scalping with Price Action Breakouts
Scalping aims to capture quick price movements by trading around key support and resistance levels. Tick charts, such as 512-tick or 1,000-tick charts, help traders filter out low-volume noise, focusing on decisive moves. This strategy thrives during the New York Open, where tight spreads and high liquidity ensure clean trade execution.
One popular scalping method is the Opening Range Breakout (ORB), which focuses on the high and low established in the first 30–60 minutes of trading. Scalpers wait for a confirmed candle close or a "break-and-retest" pattern before entering trades. As DayTradingToolkit.com explains:
"The best strategy is a simple, repeatable one based on key market levels, such as the break and retest or failed test of the prior day’s high and low."
To manage risk, scalpers often use a 4-point stop, equivalent to $200 per ES contract (4 points × $50 per point). Many traders now prefer Micro E-mini (MES) contracts for greater flexibility, as these smaller contracts – accounting for 45% of all equity index volume by late 2025 – allow for precise scaling and partial profit-taking.
Trend Following with Moving Average Crossovers
Trend following focuses on capturing momentum by entering trades when price confirms a directional move. A common setup involves the 9 and 21 EMA crossover for short-term trends, while the 50 and 200 EMA crossover identifies broader trends. ES futures, with their steady price action, help reduce false signals compared to more volatile instruments like the Nasdaq 100 (NQ).
Combining moving averages with VWAP and volume can strengthen signals. For example, when the 9 EMA crosses above the 21 EMA during the high-liquidity New York session and price trades above VWAP, it often indicates strong institutional flow. VWAP also acts as a dynamic support or resistance level, improving trade accuracy.
Trend following works best during the New York Open and afternoon sessions, as liquidity and directional momentum are higher. The midday period, however, is less favorable due to reduced volume and choppy price action. As Paul, a Prop Trading Strategist, notes:
"ES lunch is dead money. Volume drops, spreads widen slightly, and the price chops in a narrow range with frequent false breakouts in both directions."
Traders using this strategy aim for a reward-to-risk ratio of at least 1.5:1 or 2:1. For instance, with a 4-point stop, the profit target should be 6–8 points to maintain profitability.
Mean Reversion Using Bollinger Bands and VWAP
Unlike breakout strategies, mean reversion capitalizes on price returning to its average after stretching too far. ES futures are well-suited for this approach due to their relatively stable price behavior compared to more volatile indices. Traders often use Bollinger Bands to identify overextended conditions, with VWAP serving as a benchmark for intraday fair value.
VWAP plays a central role in mean reversion setups. As ES Futures Pro explains:
"VWAP acts as a dynamic support/resistance during intraday trading. Great for: Reversals during mid-day sessions."
For example, when price moves significantly above the upper Bollinger Band – often during the lunch period – traders look for a rejection candle before entering a short position targeting a return to VWAP. Conversely, a drop below the lower Bollinger Band signals potential long opportunities. Staying aligned with institutional flow is key: take long positions only when price is above VWAP and short positions when below it.
Patience is essential for mean reversion. Traders should wait for confirmed reactions at support or resistance levels rather than anticipating reversals. Adjusting position size and targets based on current volatility ensures better outcomes in varying market conditions.
Advanced Tools and Techniques for ES Futures Traders
For experienced ES futures traders, advanced tools like Volume Profile and Order Flow Analysis have become essential. These techniques move trading beyond basic support and resistance guesses, helping traders identify zones where institutional players actively defend their positions with significant capital.
Volume Profile and Order Flow Analysis
Volume Profile focuses on where trading activity occurs, rather than just when. Key components include:
- Point of Control (POC): The price level with the highest trading activity, often acting as a magnet for price and a critical support or resistance level.
- Value Area (VA): The range where 70% of trading volume takes place, representing the "fair value" for the session. This range aligns with one standard deviation from the POC, giving it statistical weight.
Heavy Volume Zones (HVZ) highlight areas where institutions accumulate positions, creating reliable support and resistance levels. It’s best to trade these zones only on the first retest after a breakout, as subsequent attempts weaken their reliability. As Trader Dale explains:
A standard candlestick chart only shows you where the price went. It doesn’t tell you how much effort (volume) it took to get there.
Order Flow Analysis provides a real-time view of the battle between buyers and sellers. Key concepts include:
- Delta: The difference between aggressive market buy and sell orders, revealing which side is dominating.
- Absorption: When large institutional orders halt aggressive market orders, often leading to reversals.
Mike R., a funded trader, shares his experience:
Order flow gave me confidence in my entries. Instead of guessing if support would hold, I could SEE institutions defending levels with huge volume.
The 80% Rule is a specific setup that traders use for mean reversion. If the market re-enters the Value Area and stays there for two consecutive 30-minute periods, there’s an 80% chance it will move to the opposite end of the Value Area. This works because traders caught at extremes are forced to exit their positions.
| Order Flow Pattern | Win Rate | Avg R:R | Difficulty |
|---|---|---|---|
| Absorption Fade | 72% | 1:1.6 | Easy |
| POC Rejection | 70% | 1:1.8 | Easy |
| Delta Divergence | 68% | 1:2.1 | Moderate |
| Stacked Imbalances | 64% | 1:2.4 | Moderate |
| Iceberg Orders | 58% | 1:3.2 | Advanced |
Popular platforms for these tools include Sierra Chart ($36/month), ATAS ($99–$199/month), and Bookmap ($99–$299/month). While Sierra Chart is the most affordable, it has a steeper learning curve. ATAS, on the other hand, offers a more beginner-friendly interface.
Momentum Trading with Rate-of-Change Indicators
The Rate-of-Change (ROC) indicator helps refine entry timing in momentum trading. A common approach is to initiate long trades only when both the 10-day and 50-day ROC are positive. For stronger signals, traders often look for the ROC to exceed 2%.
Momentum trades require additional confirmation. For example:
- A breakout to new highs should align with the Relative Strength Index (RSI) also reaching new highs. If the RSI forms a lower high (divergence), it could indicate weakening momentum and a possible reversal.
- Volume is equally important – genuine momentum moves are supported by rising volume. Price moves on low volume can often be traps.
The Average True Range (ATR) is another tool traders use to assess market conditions. ATR helps avoid entering trades during periods of low volatility, where breakouts are more likely to fail. Hard stop-losses are essential in momentum trading to guard against sharp reversals. Following the 1% rule – risking no more than 1% of total trading capital per trade – further reinforces sound risk management.
VWAP Bounce and Intraday Mean Reversion
VWAP (Volume-Weighted Average Price) strategies are ideal for mean reversion setups. Unlike standard moving averages, VWAP incorporates volume, making it a key benchmark for institutional trading. When the price stalls at a High Volume Node (HVN) and reclaims VWAP, it signals a shift in control by institutional players, creating a high-probability setup.
Traders often use the POC as an anchor for mean reversion trades, targeting it for reversals. Instead of arbitrary stop-loss placements, trailing stops behind the POC ensures protection within high-liquidity zones. Conversely, Low Volume Nodes (LVN) represent areas where price moves quickly due to low liquidity. These zones are not ideal for mean reversion entries.
"Neutral Profiles" offer another clue for potential reversals. If the price closes near fair value after attempting a breakout, it suggests trapped traders at the extremes. When the price retraces to an HVN, traders should wait for confirmation on footprint charts – such as signs of institutional absorption or delta divergence – before entering.
While effective, mean reversion strategies work best in balanced markets. They should be avoided in trending conditions where the price moves decisively away from fair value.
Risk Management for ES Futures Traders
Every solid trading strategy rests on a strong foundation of risk management. This principle is especially critical for ES futures traders, where each point equals $50.00 and daily price swings can range from 40 to 80 points. Without proper safeguards, even the best technical setups can lead to substantial losses. As Jonathan Jean-Philippe, Founder & Editor at DealPropFirm.com, emphasizes:
Risk management is not optional. It’s not something you add later. It’s the foundation of every successful prop trading career.
In fact, a staggering 95% of prop firm evaluation failures stem from poor risk management, not flawed strategies. While technical setups dictate when to enter and exit trades, managing risk ensures long-term survival in the volatile ES futures market.
Setting Stop-Losses and Profit Targets
The cornerstone of effective risk management is risk budgeting. Before placing a trade, convert your Daily Loss Limit (DLL) into the number of ES points you can afford to lose. For example, if you have a $50,000 account with a $1,000 DLL, trading one ES contract leaves you with just 20 points of breathing room. If your strategy requires a 15-point stop, there’s little margin for error.
A 4-point stop is often recommended to account for market noise while staying within your DLL. To improve profitability, aim for a 1.5:1 reward-to-risk ratio, with 2:1 being ideal. For instance, pairing a 4-point stop with an 8-point target provides a better chance of success. Even with a win rate as low as 35%, a 1:2 ratio can keep you in the green. On the other hand, a 1:1 ratio requires a win rate above 50% to remain profitable.
For precision, use ATM (Automated Trade Management) strategies or bracket orders to set stops and targets immediately after entering a trade. If market volatility spikes, consider adjusting your stops using a multiplier like 2.0x ATR (Average True Range) to avoid getting stopped out prematurely while keeping your risk controlled.
Scaling into positions with Micro E-mini (MES) contracts can also be a game-changer. MES contracts offer more flexibility by allowing smaller position sizes, which can help you lock in partial profits while letting the rest of your trade run with a trailing stop.
Position Sizing and Leverage Control
Another key to managing risk is limiting the dollar amount you risk per trade to 0.5–1% of your account. If an ATR-based stop exceeds this threshold, reduce your contract size or skip the trade entirely.
Take Sarah Chen’s example from February 2026. She passed a $100K challenge in just 30 days by risking only 0.75% per trade. With a 58% win rate and a 1:2 risk/reward ratio, she also stopped trading after two consecutive losses, which helped her maintain discipline.
To understand how position size impacts risk, consider this example for a $50,000 account with a $1,500 buffer:
| Contracts (ES) | Max Loss per Contract | Points on ES | Risk Level |
|---|---|---|---|
| 1 Contract | $1,500 total | 30 points | Safe/Ample room |
| 2 Contracts | $750 per contract | 15 points | Moderate/Requires discipline |
| 3 Contracts | $500 per contract | 10 points | High/Requires precise entry |
Many traders begin evaluations using MES contracts to preserve their drawdown buffer. Once they’ve built a profit cushion, they transition to full ES contracts for higher returns.
To avoid emotional trading, stop for the day if you hit 50–60% of your daily loss limit. Mike Rodriguez’s experience illustrates this well. Between January and March 2026, he failed three TopStep $50,000 Combines due to revenge trading. On his fourth attempt, he followed a strict 0.6% risk-per-trade rule and used a position size calculator for every trade. This discipline paid off, as he passed in 22 days with a maximum drawdown of just $840.
Adapting Risk Management for Prop Firm Rules
Prop firms enforce strict rules, and failing to follow them can result in immediate account termination. One such rule involves trailing drawdowns, which track the account’s peak balance. Recovery becomes harder because profits don’t increase your safety margin. For example, at Top One Futures, the Max Loss Limit (MLL) often locks once the account balance reaches its starting level plus $100. Reaching this threshold early can help protect your account.
Another rule concerns news-flat periods. Prop firms require traders to exit all positions two minutes before and after Tier 1 events like CPI, FOMC, or NFP announcements. On FOMC days, for example, you must be flat by 1:50 PM ET to avoid a sudden 20-point swing that could breach a $1,000 DLL.
Consistency rules are equally important. These typically limit profit concentration to 40–50% on any single day. Avoid taking oversized positions on high-volatility days, as they could violate this rule. Request payouts as soon as you’re eligible to keep your account lean and prevent the trailing drawdown floor from rising too high.
Finally, steer clear of trading ES during the lunch period (12:00 PM–1:30 PM ET) when volume drops and price action becomes erratic. Closing positions by 11:45 AM ET can help you avoid this lower-probability trading window.
Scaling ES Futures Trading with Prop Firms
Once you’ve honed your strategies and risk management for ES futures, stepping into the world of prop firms can open the door to trading larger accounts without putting your own capital at risk. These firms provide accounts ranging from $50,000 to $150,000 for a relatively small subscription or evaluation fee, giving you access to significant leverage. A standout feature is the ability to trade multiple accounts simultaneously. For example, firms like Apex Trader Funding allow traders to manage up to 20 Performance Accounts at once using copy-trading software, which can multiply your earnings potential by applying the same strategy across all accounts.
Benefits of Trading with Prop Firms
Prop firms offer several advantages, especially for traders with strong technical setups and disciplined risk management:
- Affordable Access to Capital: For a monthly fee ranging between $77 and $185, you can gain access to large trading accounts. Apex, for instance, allows traders to keep the first $25,000 of profits per account with a 100% profit split on initial payouts.
- Flexible Drawdown Models: Choose between End-of-Day (EOD) trailing drawdowns, which update at market close, or intraday models that adjust in real time. EOD models are particularly useful for traders who hold ES futures positions during lunchtime or into the afternoon session, offering some breathing room.
- Quick Funding: Some firms have removed minimum trading day requirements, enabling skilled traders to reach funded status in as little as one day. For example, a single $150,000 Apex EOD account can yield approximately $20,500 across six payouts, and scaling this across 20 accounts could amount to around $410,000.
Top Prop Firms for ES Futures Traders
Here’s a look at some of the leading prop firms for ES futures traders:
- Apex Trader Funding
Apex is known for its scalability, boasting a 4.4/5 rating from over 17,669 reviews. Their evaluation fees range from $137 to $677 per month, with frequent discounts of 70–90%. Recent rule changes have made managing multiple accounts easier than ever. - Lucid Trading
Lucid offers some of the fastest payouts in the industry, averaging just 15 minutes, and has paid out over $10 million to traders. Their "LucidFlex" account eliminates daily loss limits and consistency rules, with one-time fees starting at $65 for a $25,000 account. - Top One Futures
This firm features a Max Loss Limit (MLL) that locks once your account reaches the starting balance plus $100, providing a safety cushion. Their $50,000 accounts cost $95 per month, while $100,000 accounts are priced at $185 per month. - Take Profit Trader
Take Profit Trader allows withdrawals from day one and has eliminated activation fees. They permit up to five live accounts and offer intraday drawdown models, making them ideal for active ES scalpers. - MyFundedFutures (MFFU)
MFFU stands out by eliminating daily loss limits across all plans, relying instead on an EOD trailing drawdown. Their $50,000 Core plan costs about $77 per month and carries a 4.68/5 rating, though traders must remain flat for two minutes before and after major economic events like CPI or FOMC releases.
Tools and Resources from DamnPropFirms
DamnPropFirms provides a range of tools and resources to help ES traders maximize their potential. These include verified reviews, comparisons, and exclusive discount codes. For instance, you can use code DGT for up to 90% off Apex Trader Funding evaluations, VIBES for 40% off Top One Futures, and RAPID for 20% off MyFundedFutures.
Other helpful tools include:
- Consistency Rule Calculator: Ensures you stay within the "best day" percentage limits (usually 40–50%) to avoid payout denials.
- Apex Payout & Scaling Calculator: Tracks safety net requirements when planning payouts.
- TradeSyncer: A copy-trading software that mirrors your ES strategies across up to 20 funded accounts.
Additionally, the Damn Good Traders (DGT) Discord offers a community of traders sharing real-time ES setups and profit updates. With these tools, discounts, and community support, DamnPropFirms equips you with everything you need to scale your ES futures trading in 2026.
Conclusion and Key Takeaways
Summary of Top Strategies and Tools
To succeed in ES futures trading in 2026, focus on three main pillars: sharp technical analysis, rigorous risk management, and strategic use of prop firm capital. The ES market’s smoother price movements make it ideal for mean reversion strategies like VWAP bounces and moving average tests. Timing your trades during high-volume periods is equally important, as it helps improve execution quality and minimizes false signals.
Position sizing plays a major role, especially since the daily loss limits on ES contracts leave little room for error. Many traders prefer Micro E-mini (MES) contracts during evaluations because they allow for finer adjustments and more flexibility in scaling positions. By combining these strategies with disciplined practices, you can enhance your trading performance.
Next Steps for ES Futures Traders
To refine your trading routine, integrate technical strategies with strict risk controls. Start by calculating your daily loss limit in ES points and use bracket orders with stops of 4–6 ticks to filter out market noise. Aim for a reward-to-risk ratio of at least 2:1 when applying the strategies discussed earlier. Additionally, avoid holding positions during critical moments – exit trades two minutes before and after Tier 1 events like CPI or FOMC announcements.
If you’re looking to scale your trading, explore prop firm opportunities at DamnPropFirms. Tools like the Consistency Rule Calculator can help you stay within the 40–50% daily consistency range, a key metric for many evaluations. For detailed reviews of options like Apex Trader Funding, check their platform for updated rules and account features. By combining disciplined strategies, precise risk management, and funded account opportunities, you can build a sustainable and efficient ES futures trading career in 2026.
FAQs
When should I scalp ES versus trade mean reversion?
Scalping ES futures tends to perform well in range-bound markets where volatility is low. These conditions allow traders to capitalize on small, quick price movements. Similarly, mean reversion strategies work well in such markets, particularly when prices stray from a moving average and are expected to return to it. However, scalping becomes much riskier in trending or highly volatile markets, as sudden price swings can lead to significant losses. It’s crucial to evaluate market conditions carefully and select a strategy that fits the current market behavior.
How do I size ES or MES positions to fit a prop firm daily loss limit?
To determine position sizes for ES or MES trades within a prop firm’s daily loss limit, you need to calculate based on your account balance, risk percentage, and stop-loss level. Here’s an example:
If you have a $50,000 account and you’re risking 1% per trade, that means you’re risking $500. With a stop-loss set at $125 per contract, your position size would be:
$500 ÷ $125 = 4 contracts
Always make adjustments according to your trading strategy and the specific rules of the prop firm you’re working with.
What’s the simplest way to add order flow or volume profile to my ES entries?
To incorporate order flow or volume profile into your ES trading strategy, leverage charting tools that showcase these data types on your platform.
Volume Profile helps pinpoint critical levels such as the Point of Control (POC) and Value Area, which are essential for spotting support, resistance, and potential entry points. Meanwhile, order flow tools – like Footprint charts or Delta indicators – offer insights into real-time buying and selling pressure, as well as imbalances. These tools enable more precise decision-making for your trades.