Algorithmic futures trading uses automated systems to execute trades based on market data and pre-set rules, eliminating emotional bias. Volatility strategies are particularly effective, focusing on price movement rather than direction. Key tools include:
- ATR (Average True Range): Measures price movement, helping with stop-losses and position sizing.
- Bollinger Bands: Identifies overbought/oversold conditions and breakout opportunities.
- VIX (Volatility Index): Gauges market sentiment and predicts volatility spikes.
Common strategies include trend following, mean reversion, and breakout trading. Effective risk management – like ATR-based stops, dynamic position sizing, and circuit breakers – is essential for success. Prop trading platforms, such as Apex Trader Funding, provide capital and tools for scaling these strategies. With proper design and risk controls, volatility-based algorithms can deliver strong returns.
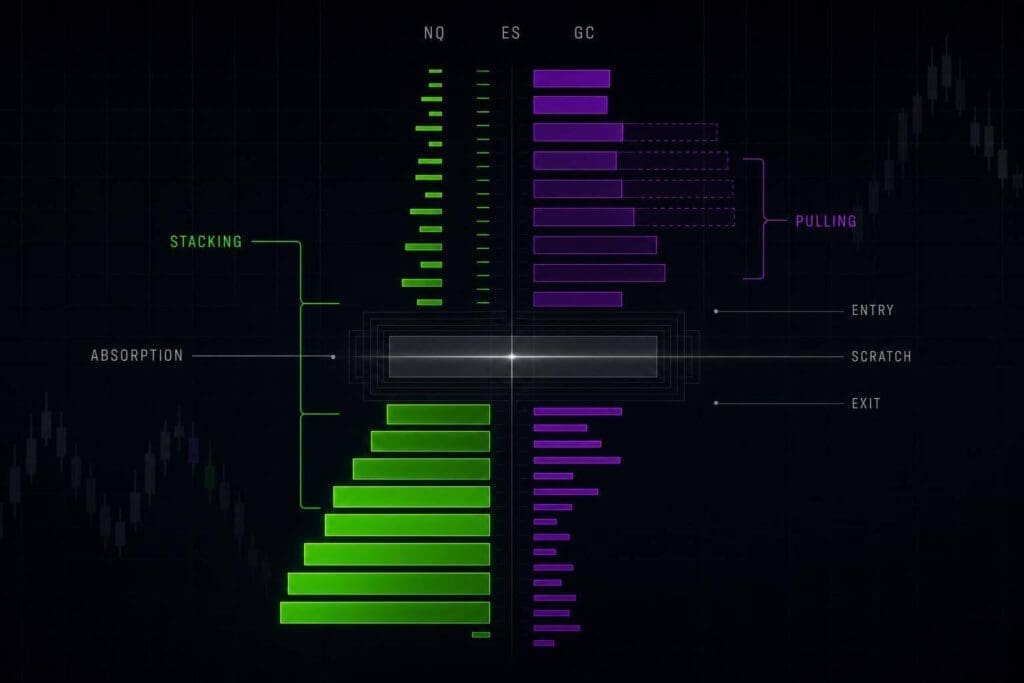
Order Book Liquidity and Volatility for Futures Markets Algorithms
sbb-itb-46ae61d
Key Volatility Indicators for Futures Trading Algorithms
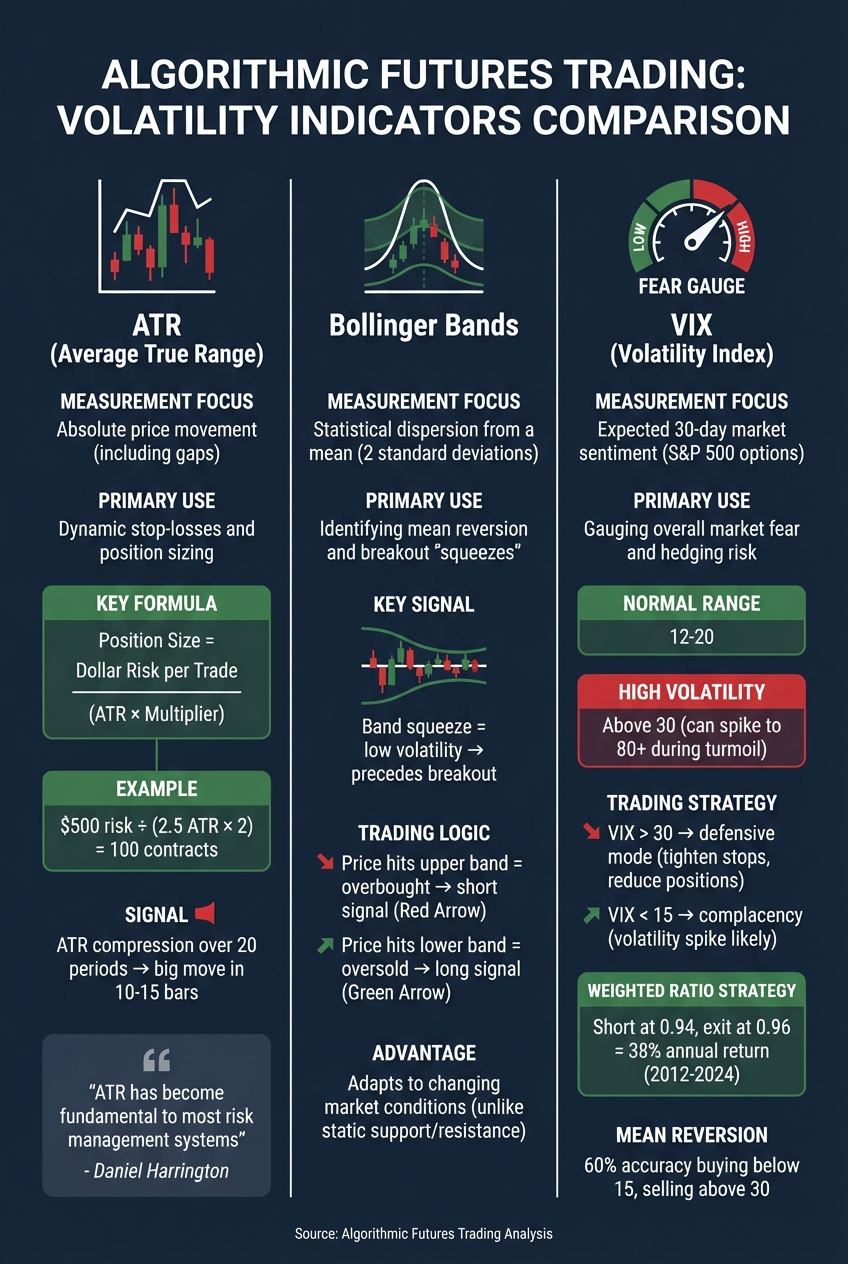
Key Volatility Indicators for Algorithmic Futures Trading: ATR, Bollinger Bands, and VIX Comparison
When it comes to volatility-based algorithmic futures trading, picking the right indicators is crucial. These tools help your system understand when markets are steady, when they’re on the verge of big moves, and how to manage risk accordingly. Three standout indicators in this space are Average True Range (ATR), Bollinger Bands, and the Volatility Index (VIX). Each plays a unique role in guiding algorithmic decisions.
Average True Range (ATR)
ATR is all about measuring how much an asset typically moves over a specific period – often 14 bars – expressed in price units like dollars or points. Unlike a simple high-low range, ATR also accounts for price gaps between sessions, which makes it particularly useful in 24-hour futures markets[6][7].
Daniel Harrington, a Senior Trading Analyst, highlights its importance:
"ATR has become fundamental to most risk management systems."[6]
Algorithms often use ATR to set dynamic stop-loss levels and determine position sizes. Here’s the formula they rely on:
Position Size = Dollar Risk per Trade / (ATR × Multiplier)
For instance, if you’re risking $500 per trade, and the ATR is 2.5 points with a 2x multiplier, your position size would be 100 contracts ($500 / 5.0). This approach ensures consistent risk, whether markets are calm or chaotic.
Research shows that when ATR compresses over 20 periods, it often signals a big move in the next 10–15 bars[6]. Algorithms monitor these compression phases and act when ATR rises above its 50-period average – a clear sign that volatility is kicking back in.
Next up, Bollinger Bands offer a different perspective on volatility.
Bollinger Bands
While ATR measures price movement, Bollinger Bands take a statistical approach to spot volatility extremes. They consist of a moving average flanked by two bands set at two standard deviations above and below. These bands expand during volatile times and contract when markets settle down[7][9]. This makes them great for identifying overbought or oversold conditions and spotting mean reversion opportunities.
A "squeeze" in the bands signals low volatility, often preceding a breakout. Algorithms watch for these setups and execute trades when prices breach the bands, recognizing the squeeze as a precursor to movement, not just volatility expansion.
For mean reversion strategies, the outer bands act as dynamic boundaries. When prices hit or exceed the upper band, the system flags an overbought condition and preps for a short trade. Conversely, touching the lower band signals oversold conditions, prompting a potential long trade[9]. Unlike static support and resistance levels, Bollinger Bands adapt to changing market conditions.
Finally, the VIX offers a broader view of market sentiment.
Volatility Index (VIX)
The VIX, often called the "fear gauge", measures the market’s expectation of 30-day volatility based on S&P 500 options. It rises during times of market stress and falls when things are calm[9]. Typically, the VIX hovers between 12 and 20 but can spike above 30 – or even 80 – during major turmoil[9].
Algorithms use the VIX for sentiment analysis and market regime detection. When the VIX climbs above 30, systems shift into defensive mode, tightening stops, reducing position sizes, or pausing new trades. On the flip side, VIX levels below 15 often signal complacency, which can precede sudden volatility spikes[9].
Some strategies even trade VIX futures directly. By analyzing the "Weighted Ratio" – the VIX spot price divided by the weighted average of front and back month futures – algorithms identify market conditions. A ratio below 1.0 suggests contango (futures trading above spot), while a ratio above 1.0 indicates backwardation (futures below spot)[1]. A backtested strategy using this ratio – shorting at 0.94 and exiting at 0.96 – delivered an annual return of 38% from 2012 to 2024[1].
Historical trends show that mean reversion strategies with the VIX have about 60% accuracy when buying below 15 and selling above 30[9]. This consistency makes the VIX a key tool for algorithms focused on volatility.
| Indicator | Measurement Focus | Primary Algorithmic Use |
|---|---|---|
| ATR | Absolute price movement (including gaps) | Dynamic stop-losses and position sizing[6] |
| Bollinger Bands | Statistical dispersion from a mean | Identifying mean reversion and breakout "squeezes"[7] |
| VIX | Expected 30-day market sentiment | Gauging overall market fear and hedging risk[9] |
Common Volatility-Based Strategies for Algorithmic Futures Trading
Volatility-based strategies in algorithmic futures trading generally fall into three categories: trend following, mean reversion, and breakout trading. Each approach leverages market volatility in its own way to identify opportunities, and the best choice often depends on your market expectations, risk appetite, and the futures prop firm reviews you use to select a trading partner.
Trend Following Strategies
Trend-following algorithms take advantage of market momentum, using volatility as a measure of directional strength. Tools like moving averages and momentum oscillators help filter out noise and confirm trends [2][3]. For VIX futures, these strategies often focus on the roll yield during sustained contango periods. A key metric here is the Weighted Ratio (WR), which is the VIX spot price divided by the weighted average of front and back month futures. When the WR drops below 1.0, it indicates contango, signaling algorithms to take short positions and profit from the convergence of futures prices toward the spot price.
To minimize transaction costs and avoid unnecessary trades, traders often establish a threshold gap – sometimes called flat space – between entry and exit signals. For example, entering at a WR of 0.94 and exiting at 0.96 can help reduce slippage. However, when markets overshoot, mean reversion strategies often come into play.
Mean Reversion Strategies
Mean reversion strategies focus on the tendency of extreme price movements to revert to their average levels. Algorithms for this approach utilize tools like Bollinger Bands, RSI, and VWAP to spot overextended conditions where a correction is likely [2][3]. In VIX trading, this often involves "selling the top" when volatility spikes to unusually high levels. While this can be lucrative, accurately predicting these peaks is challenging and often requires advanced techniques like machine learning to analyze historical patterns [1].
A notable example occurred in June 2024, when HighStrike‘s Kyle Maring used the BAG Indicator – a tool that blends moving averages with momentum-based volatility analysis – to guide trades in NQ futures [2].
Breakout Trading Strategies
Breakout strategies aim to capitalize on significant price movements by identifying periods of expanding volatility. These algorithms activate trades when low-volatility periods transition into high-volatility ones. For VIX futures, breakout strategies are often triggered when the futures curve enters backwardation (WR > 1.04), signaling that spot volatility is rising faster than futures prices [1].
Timing is critical for breakout strategies. The overlap between the London and New York trading sessions (8:00 AM – 12:00 PM ET) offers the highest liquidity and decisive price action. For NQ and ES futures, the first 90 minutes of the New York session (9:30–11:00 AM ET) are particularly effective for capturing volatility-driven breakouts.
Between 2012 and April 2024, a strategy combining short and long VIX futures based on Weighted Ratios delivered an annual return of 42%, though it experienced drawdowns of about 33% [1]. While long positions alone often struggled due to false breakouts in bull markets, pairing them with short positions during calmer periods significantly improved overall performance.
Each of these strategies relies on fundamental volatility indicators and offers distinct ways to navigate market conditions.
| Strategy Type | Market Condition | Primary Indicator | Goal |
|---|---|---|---|
| Trend Following | Contango/Backwardation | Weighted VIX Ratio (WR) | Capture roll yield or hedge against downturns [1] |
| Mean Reversion | Post-volatility spike | VIX peak analysis | Profit from VIX returning to historical norms [1] |
| Breakout | Volatility expansion | WR > 1.04 or NY Open | Capture large price movements during spikes [1][10] |
Risk Management Techniques in Volatility Strategies
Precision is the backbone of successful algorithmic futures trading, and effective risk management is the glue that holds it all together. A staggering 95% of prop firm evaluation failures are due to poor risk management, not flawed trading strategies [13]. With volatility constantly shifting, your algorithm must include safeguards to weather drawdowns and preserve your capital.
Stop-Loss and Trailing Stops
When it comes to risk control, stop-loss strategies are non-negotiable. The Average True Range (ATR) is widely regarded as the best tool for setting stops in volatility-focused futures algorithms [12][11]. Unlike fixed dollar stops that ignore market dynamics, ATR-based stops adjust to the market’s mood – widening during volatile periods and tightening when things calm down. This helps avoid unnecessary exits caused by normal market noise.
Here’s how ATR-based stops work in practice:
- Scalping: Use a 1.5x ATR multiplier.
- Day/Swing Trading: Opt for a 2.0x multiplier.
- Trend Following: Go with 3.0x for longer-term trades.
For instance, if you’re trading ES futures and the 14-day ATR is 40 points, a swing trade would set stops 80 points away (2.0 × 40) from your entry.
Always rely on automated server-side stop orders instead of mental stops [13]. Technology can fail – whether it’s a platform crash or a sudden internet outage – but a hard stop ensures your trade exits automatically. And don’t fall into the trap of widening your stop-loss to "give the trade more room." This common mistake is one of the quickest ways to blow up an account [13].
"In February 2026, trader Sarah Chen passed a $100,000 FTMO challenge by risking exactly 0.75% ($750) per trade on EUR/USD scalps with ATR-based stops. She stopped trading for the day after two consecutive losses and closed all positions 15 minutes before major news releases. Over 30 days, she achieved a 58% win rate and finished Phase 1 with a $10,847 profit." [13]
Dynamic Position Sizing
Trading the same number of contracts regardless of market conditions – known as static position sizing – can create wildly inconsistent risk exposure. For example, during high-volatility periods like March 2020, a single contract could carry 5.6 times more risk than during low-volatility periods like July 2021 [15].
"Static position sizing is not only ineffective but dangerous; relying on it in backtests misrepresents true risk exposure." – Algomatic Trading [15]
Dynamic position sizing addresses this issue by adjusting the number of contracts based on current market volatility. The formula is simple: Position Size = (Risk % × Portfolio Size) / ATR [15].
Here’s a practical example: if you’re risking 1% of a $50,000 account ($500) and the ATR on NQ futures is 50 points, you’d trade one contract. If volatility spikes and the ATR doubles to 100 points, your algorithm would reduce the position size to maintain the same $500 risk.
"Mike Rodriguez failed three consecutive $50,000 TopStep evaluations before passing on his fourth attempt in February 2026. His previous failures came from ‘eyeballing’ position sizes and revenge trading. On his successful attempt, he used a position size calculator to risk exactly 0.6% per trade, passing in 22 days with a $3,180 profit and a maximum drawdown of only $840." [13]
| Feature | Static Position Sizing | Dynamic (Volatility-Adjusted) Sizing |
|---|---|---|
| Risk per Trade | Fluctuates wildly based on market conditions | Remains consistent in dollar/percentage terms |
| High Volatility | Massively over-risks; prone to blowups | Automatically scales down to protect capital |
| Low Volatility | Under-risks; leaves potential profit on the table | Scales up to maintain consistent performance |
Adaptive Volatility Adjustments
In addition to position sizing, adaptive measures are essential for protecting your algorithm during volatile market shifts. Since market conditions are never static, your algorithm needs to adjust its parameters accordingly.
Drawdown circuit breakers are a must-have. Professional algorithms often stop trading after hitting 50-60% of the daily loss limit or 70% of the maximum drawdown threshold [13]. Time-based stops are another safeguard – if a mean-reversion trade hasn’t moved in your favor within 10-15 minutes, it’s time to exit [12][13]. Similarly, momentum stops can preempt reversals; if indicators like RSI or MACD show sharp divergence, it’s often better to close the trade early [12].
During high-impact events like FOMC meetings or Non-Farm Payroll releases, consider reducing your position size by 25-50% or halting trading altogether [9]. The risk of slippage during these periods can turn a calculated trade into a devastating loss. For traders using prop firms with trailing drawdown rules (like TopStep or Apex Trader Funding), it’s important to note that some firms include unrealized profits in their drawdown calculations [13][14]. This means a trade that moves significantly into profit and then retraces could still trigger a violation.
Even with win rates as low as 34% at a 1:2 reward-to-risk ratio – or 17% at a 1:5 ratio – you can break even [13]. But this is only possible if your risk management is mathematically sound and applied consistently.
Using Volatility Strategies with Prop Trading Platforms
Volatility strategies thrive not just on well-designed algorithms but also on the support and resources offered by prop trading platforms.
How Prop Firms Support Volatility Strategies
Prop trading firms provide the financial backing that allows traders to scale their volatility strategies without exposing personal capital to substantial risk. These firms offer access to accounts ranging from $25,000 to over $150,000, enabling traders to execute larger trades while adhering to sound risk management principles. Many firms also provide flexible drawdown models to suit different strategies. For instance, Apex Trader Funding offers both End-of-Day (EOD) and Intraday Trailing Drawdown options. The EOD model is particularly helpful for strategies involving significant unrealized swings, as it calculates drawdown only at market close, avoiding unnecessary account closures due to intraday volatility swings [16].
In addition to funding, these firms equip traders with tools essential for algorithmic trading. For example, Take Profit Trader allows immediate withdrawals without activation fees, offering liquidity when you need it most [16]. These resources create an environment where traders can focus on refining and executing their strategies effectively.
Top Prop Firms for Futures Trading
Choosing the right prop firm is crucial for aligning with your trading goals and risk tolerance. Some firms stand out for their features and flexibility, making them ideal for volatility strategies.
- Apex Trader Funding: Apex is highly rated, with a 4.4/5 score from over 17,669 reviews. Traders can manage up to 20 Performance Accounts simultaneously, leveraging tools like TradeSyncer to replicate trades across all accounts and maximize profits. Apex also offers a 100% payout split on approved amounts and frequent promotions with up to 90% off evaluation fees [16].
- Tradeify: Known for its gradual consistency rule, Tradeify’s Lightning accounts ensure traders aren’t disqualified by a single high-volatility event. Payout consistency starts at 20% for the first withdrawal, increasing to 25% and then 30% for subsequent payouts [17].
- Lucid Trading: LucidFlex accounts are a great option for algorithms that rely on rare, high-volatility opportunities, as they impose no consistency rules during the funded stage [16].
Other notable firms include Alpha Futures, FundedNext Futures, Purdia, and Topstep. Each firm has unique rules and features, so reviewing detailed comparisons on DamnPropFirms can help you find the best fit.
Tools and Resources for Volatility Strategy Optimization
To help traders optimize their strategies, DamnPropFirms provides several free tools tailored for algorithmic trading.
- Consistency Rule Calculator: This tool ensures compliance with payout rules. For example, if your algorithm’s biggest profit day was $1,000 and the firm enforces a 20% consistency rule, you’d need $5,000 in total profit before requesting a withdrawal. The formula is simple: Biggest profit day ÷ Consistency % = Total profit required [17].
- TradeSyncer: This platform enables seamless synchronization of trades across multiple accounts and platforms, making it ideal for managing up to 20 accounts on Apex or 5 live accounts on Take Profit Trader [16][17].
- Market Analysis Tools: Tools like the Bookmap Market Liquidity Visualizer provide real-time insights into order flow and heatmap data, helping traders make informed decisions [17].
DamnPropFirms also keeps traders updated with the latest reviews and discount codes for major futures prop firms. With firms frequently adjusting their policies – such as Apex’s significant updates in March 2026 – having a centralized resource ensures you stay compliant and get the best deals on evaluations.
Conclusion and Key Takeaways
Volatility-based strategies offer traders the opportunity to capitalize on market fluctuations without needing to predict the exact direction. Automated execution eliminates emotional decision-making, while high-speed processing allows traders to seize millisecond-level opportunities that manual efforts simply can’t match. For instance, backtested VIX futures strategies have delivered impressive annual returns of 38–42% [1]. Similarly, mean-reversion setups have historically achieved Sharpe ratios exceeding 1.5, highlighting their effectiveness [4].
When paired with prop trading platforms, these strategies can unlock even greater potential. Platforms such as Apex Trader Funding, Tradeify, and Lucid Trading provide access to significant capital – often $150,000 or more. Traders typically retain 80–90% of their profits, making it possible to scale volatility algorithms without putting personal funds at significant risk. Evaluation fees for these programs are generally modest, ranging from $100 to $500 [8].
However, success in these ventures is not solely about having a solid algorithm. Effective risk management is just as critical. As discussed earlier, implementing measures like stop-loss orders, dynamic position sizing based on ATR (Average True Range), and automated kill switches can protect capital during sudden market shifts. These safeguards are essential for avoiding catastrophic losses during unexpected spikes in volatility [18][5]. Additionally, validating your strategy with out-of-sample data helps ensure reliability and reduces the risk of overfitting. Tools like the Consistency Rule Calculator from DamnPropFirms can also help ensure compliance with payout rules before making withdrawal requests.
"A well-designed futures trading algorithm doesn’t just buy and sell; it incorporates rules for position sizing, risk management, and profit targets, all operating without manual intervention." – Volume Power System [18]
Finally, remember that prop firm rules are subject to change. For example, Apex Trader Funding updated its account requirements and rules on March 1st. Staying up to date with verified reviews and policy changes is crucial for maintaining a funded account and maximizing your success in algorithmic trading.
FAQs
How do I choose between ATR, Bollinger Bands, and the VIX for my algorithm?
The choice between ATR, Bollinger Bands, and the VIX comes down to your trading objectives and the kind of market volatility you’re aiming to monitor:
- ATR (Average True Range): This tool focuses on real-time price movement, making it a valuable resource for managing risk and setting stop-loss levels.
- Bollinger Bands: These bands highlight market extremes, helping traders spot when an asset might be overbought or oversold.
- The VIX: Known as the "fear index", the VIX gauges market sentiment and anticipates future volatility, offering insight into broader market trends.
Your decision should align with the type of signals your trading strategy emphasizes. Each of these tools serves a distinct purpose, so pick the one that complements your approach.
What’s the simplest way to size futures positions using ATR?
To calculate futures position sizes using Average True Range (ATR), you divide the dollar amount you’re willing to risk per trade by the product of the ATR value and the instrument’s tick value. For instance, if you’re risking $100 per trade, and the ATR is 50 points with a tick value of $12.50, the formula would look like this: $100 ÷ (50 × $12.50). This gives you a position size of about 0.16 contracts. This method helps maintain consistent risk levels, even as market volatility changes.
How can my algo avoid blowing up during news-driven volatility spikes?
To navigate the chaos of news-driven volatility spikes in algorithmic futures trading, having solid risk management in place is a must. Start by using dynamic stop-loss and take-profit filters that adapt to changing market conditions. These tools help you cap potential losses while locking in profits.
During periods of heightened volatility – like when volatility indices surge – it’s wise to adjust your approach. Reduce position sizes and tighten stop-loss levels to minimize exposure to sudden market swings.
Finally, don’t skip the essentials: regular backtesting and continuous monitoring. These practices ensure your algorithm stays responsive and adjusts effectively to the unpredictable nature of the market.