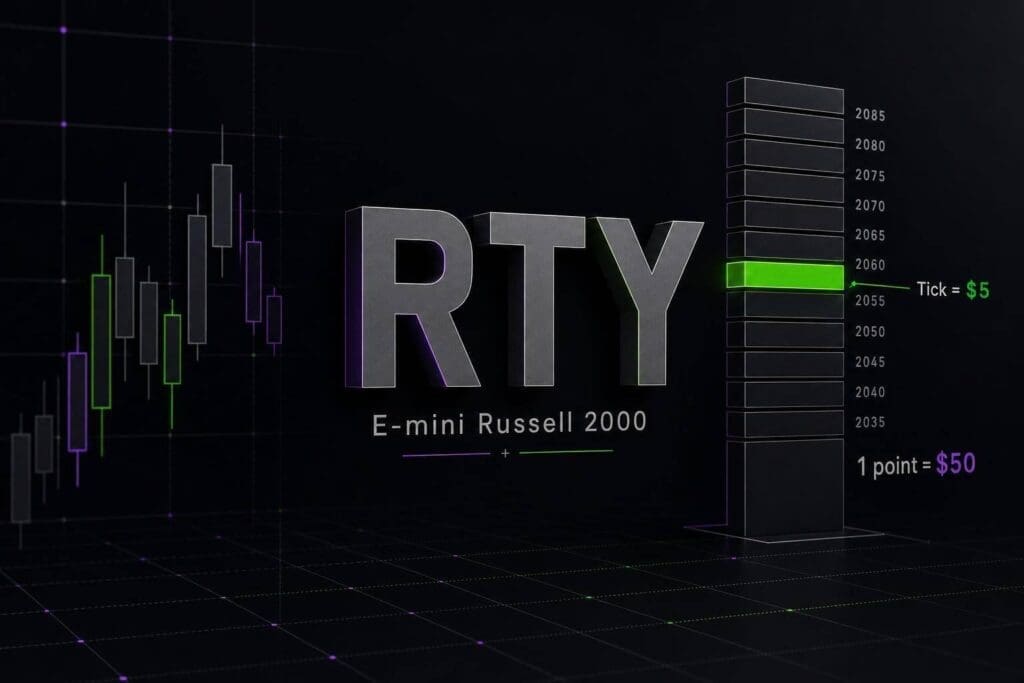
RTY moves in 0.10-point ticks, and each tick is worth $5 per contract. That’s the number you need burned into your head before you touch this contract. A 1-point move is $50. A 10-point move is $500. You can use a futures trading profit calculator to model these swings before entering a trade. On bad size, that gets ugly fast.
I’ll keep this tight: what RTY pays per tick, what a full point is worth, and how that math should shape your stop and contract count. If you trade with top futures prop firms, this is the part that keeps a normal pullback from turning into a dumb drawdown hit.
Introduction to E-Mini Russell 2000
sbb-itb-46ae61d
What Is RTY and What Are the Key Contract Specs?
RTY is the E-mini Russell 2000 futures contract traded on CME Globex. The math is simple: your RTY P&L moves off a $50 multiplier.
RTY Symbol, Exchange, and Underlying Index
RTY tracks the Russell 2000 Index, which is the main benchmark for U.S. small-cap stocks.
Contract Multiplier, Point Value, and Notional Size
RTY uses a $50 multiplier. That means:
- $50 per full point
- $5 per tick
So if RTY is trading at 2,400, one contract controls $120,000 in notional value:
2,400 × $50 = $120,000
That number matters. A lot of traders look at RTY and think "small caps" means small risk. It doesn’t. The index tracks smaller companies, but the contract still packs a punch.
Tick Size, Tick Value, Trading Hours, and Contract Months
Use this table as the quick RTY reference.
| Specification | Detail |
|---|---|
| Ticker Symbol | RTY |
| Exchange | CME Group (Globex) |
| Underlying Index | Russell 2000 (Small-Cap) |
| Contract Multiplier | $50 |
| Minimum Tick Size | 0.10 index points |
| Tick Value | $5.00 |
| Trading Hours (ET) | Sun 6:00 PM – Fri 5:00 PM |
| Daily Maintenance Break | 5:00 PM – 6:00 PM ET |
| Contract Months | March (H), June (M), September (U), December (Z) |
| Settlement Method | Cash |
These specs set up the tick math and position sizing in the next section.
How Much Is One RTY Tick Worth in Dollars?
This is the part that hits your account. RTY moves in 0.10-point ticks, and each tick is worth $5.00 per contract. You can use a futures contract size converter to compare these values across different indices.
How Much Is One RTY Tick Worth in Dollars?
Convert the specs into P&L.
RTY Tick and Point Math
RTY’s minimum price move is 0.10 index points. That’s 1 tick, and it’s worth $5.00 per contract. The math is dead simple:
ticks moved × $5.00 × number of contracts = P&L
A 1-point move in RTY equals 10 ticks. So:
- 1 tick = $5.00 per contract
- 1.00 point = $50.00 per contract
- 2.00 points = $100.00 per contract
No mystery here. If you’re holding more contracts, the dollar swing climbs fast.
How RTY P&L Scales Across Multiple Contracts
This is where traders get slapped if they size too big. At 10 contracts, a 1-point move is $500.00. A 10-point loss is $5,000.00.
That’s why you size before you click in. Every extra contract multiplies risk. Clean and simple.
RTY Tick Value Table for Common Price Moves
| Points Moved | Ticks Moved | 1 Contract | 3 Contracts | 5 Contracts |
|---|---|---|---|---|
| 0.10 (1 tick) | 1 | $5.00 | $15.00 | $25.00 |
| 1.00 | 10 | $50.00 | $150.00 | $250.00 |
| 2.00 | 20 | $100.00 | $300.00 | $500.00 |
| 5.00 | 50 | $250.00 | $750.00 | $1,250.00 |
| 10.00 | 100 | $500.00 | $1,500.00 | $2,500.00 |
| 20.00 | 200 | $1,000.00 | $3,000.00 | $5,000.00 |
Use this math to set your stop distance and contract size in the next section.
How to Use RTY Tick Value for Position Sizing
Use RTY tick value to set your stop size and your contract count. Keep it simple: start with dollar risk, then work backward into ticks, points, and contracts.
Convert Dollar Risk Into RTY Stop Size
Divide your dollar risk by $5.00 to get the max stop size in ticks.
| Dollar Risk Budget | Max Stop Distance (Ticks) | Max Stop Distance (Points) |
|---|---|---|
| $100 | 20 ticks | 2.0 points |
| $250 | 50 ticks | 5.0 points |
| $500 | 100 ticks | 10.0 points |
If your stop needs to be wider than your risk budget allows, you’ve got two choices: size down or switch to M2K.
Then use that stop distance in the next step to figure out contract size.
Convert Stop Distance Into Contract Size
contracts = total dollar risk ÷ (stop distance in points × $50.00)
| Stop Distance | Ticks | Max RTY Contracts at $500 Risk |
|---|---|---|
| 5 points | 50 | 2 |
| 10 points | 100 | 1 |
| 15 points | 150 | No RTY contract fits the budget (use M2K) |
Always round down to the nearest whole contract. No exceptions. If the math says 1.8 contracts, that means 1 contract, not 2.
Why This Math Matters for Prop Firm Drawdown Management
If you’re trading a prop account, your size has to fit the firm’s unrealized trailing drawdown limit, not just the chart setup. That’s where a lot of traders screw this up.
On a $50,000 evaluation with a $2,000 drawdown limit, one 10-point loss on 1 RTY contract equals a $500 loss. That’s 25% of your total allowed drawdown gone in one trade.
RTY can move hard around news and fast markets. Slippage matters. A stop that looks fine on paper can hit harder than expected once the fill comes through. So leave room for slippage and news risk, especially if you’re trading near the edge of the drawdown.
The right way to do it is simple: size from the stop first. If the stop is too wide for the account, the trade is too big. Period. One oversized RTY trade can chew up a big chunk of funded-account drawdown fast.
How RTY Compares With ES and NQ
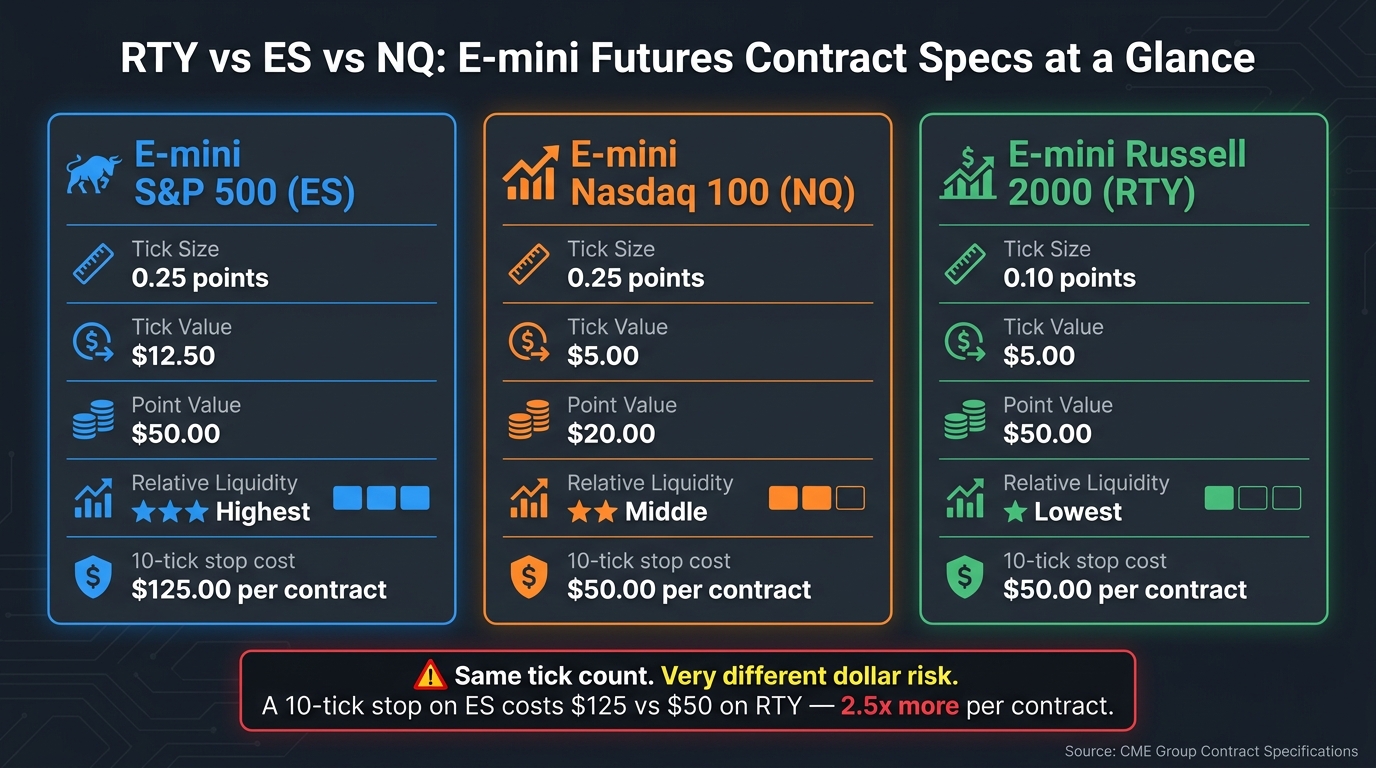
RTY vs ES vs NQ: Futures Contract Specs Compared
Now that you know RTY’s tick value, put it next to ES and NQ and look at the part that matters: how much each tick costs you, how cleanly you can place a stop, and how easy the contract is to get in and out of.
RTY and NQ both cost $5.00 per tick, but they don’t move in the same way. RTY uses a 0.10-point tick, while ES uses a 0.25-point tick and costs $12.50 per tick. (Traders looking for lower risk often compare these to MNQ contract specs). That changes your risk fast.
For example, a 10-tick stop on RTY risks $50.00 per contract. That same 10-tick stop on ES risks $125.00 per contract. Same tick count. Very different dollar hit.
Multiplier, Tick Size, and Dollar Value Per Tick
The key difference here is simple:
- RTY: 0.10-point tick, $5.00 per tick
- NQ: 0.25-point tick, $5.00 per tick
- ES: 0.25-point tick, $12.50 per tick
So if you’re sizing trades by stop distance and account risk, RTY often gives you more room than ES before the dollars get ugly.
Volatility, Daily Range, and How RTY Trades
NQ is the wild one. It can rip hard intraday and punish loose execution. ES is the most liquid of the three, so fills are usually cleaner and the market tends to feel smoother.
RTY sits in a different lane. It trades lighter than ES and usually needs more patience on entries and exits. That’s not always bad, but you need to respect it. If you’re used to ES liquidity, RTY can feel a bit thinner, especially when you’re trying to work size or avoid slippage.
Side-by-Side Contract Comparison Table
| Contract | Symbol | Tick Size | Tick Value | Point Value | Relative Liquidity |
|---|---|---|---|---|---|
| E-mini S&P 500 | ES | 0.25 | $12.50 | $50.00 | Highest |
| E-mini Nasdaq 100 | NQ | 0.25 | $5.00 | $20.00 | Middle |
| E-mini Russell 2000 | RTY | 0.10 | $5.00 | $50.00 | Lowest |
A 2-tick slip on 5 RTY contracts costs $50.00.
Next, check the trading-hours and rollover details that can affect execution and overnight risk.
What Else to Know Before Trading RTY
Trading Hours, Regular Session vs. Globex, and Overnight Risk
Tick value is only one piece of the trade. Your fill quality matters just as much, and that comes down to liquidity and rollover.
RTY gets its best volume during the U.S. regular session, 9:30 AM to 4:15 PM ET. Outside that window, it’s thinner than ES and a lot less forgiving. Spreads can widen. Slippage can get ugly. That’s even more true if you’re trading overnight or around news.
News releases can also push price straight through your stop. So if you’re holding RTY outside regular hours, size the trade like that risk is real. Because it is.
Expiration, Rollover, and Cash Settlement
The next execution issue shows up around rollover.
RTY is cash-settled on the quarterly cycle. Most traders move to the next contract before expiration week, once that contract starts getting more volume. Wait too long, and the expiring contract can get thin fast. Spreads widen, liquidity dries up, and your actual fill may be a lot worse than the clean tick-value math you started with.
Platform Setup and Fee Context
Before you place a trade, make sure your platform is showing 0.10-point increments and $5.00 per tick. For costs, expect about $5.76 round-trip for one standard RTY contract.
Once pricing, liquidity, and rollover are clear, size is the last thing left to decide.
Bottom Line
Now it comes down to size. RTY ticks in 0.10-point moves worth $5.00 each, which means $50.00 per full point.
On one of the best futures prop firms, that number matters fast. Your drawdown limit is your risk cap. That’s the line. Not what you hope to lose. Not what the setup “should” need.
If RTY is too big for your risk budget, drop to M2K. It pays $0.50 per tick, so you’re dealing with one-tenth of RTY’s tick value. Same idea, less heat.
Position Size = Account Risk ÷ (Stop Loss Distance in Ticks × Tick Value) [1]
Use that math before every trade. Not after you’re already in and trying to justify bad size.
One more thing: RTY is thinner than ES, so slippage is part of the deal. Size from your stop, account for the tick value, and leave room for slippage.
FAQs
How many RTY contracts fit my risk?
Use this formula:
Position size = total account risk / (stop-loss distance in ticks × $5.00)
Each RTY tick is worth $5.00, so you’re just dividing your total dollar risk by the risk per contract.
Example: risking $500 with a 20-tick stop = $500 / (20 × $5.00) = 5 RTY contracts.
Simple math. If your stop is wider, your size goes down. If your stop is tighter, your size goes up. Just make sure your final size still fits your prop firm’s contract cap.
When should I trade RTY for better liquidity?
For better liquidity in E-mini Russell 2000 (RTY), stick to Regular Trading Hours (RTH): 9:30 AM to 4:15 PM ET. That’s when volume is usually higher, bid-ask spreads are tighter, and fills tend to be cleaner.
The busiest windows are usually 9:30–11:00 AM ET and 2:00–4:00 PM ET. A lot of traders sit out 11:00 AM–2:00 PM ET because volume often thins out and the price action gets choppier.
When should I use M2K instead of RTY?
Use M2K instead of RTY if you’re new, trading a smaller account, or just want less heat per tick. Both track the same Russell 2000 price action, but M2K is the smaller contract.
Each RTY tick is worth $5.00. Each M2K tick is worth $0.50. That’s a big difference when you’re trying to stay calm, control risk, and build consistency before stepping up to RTY.