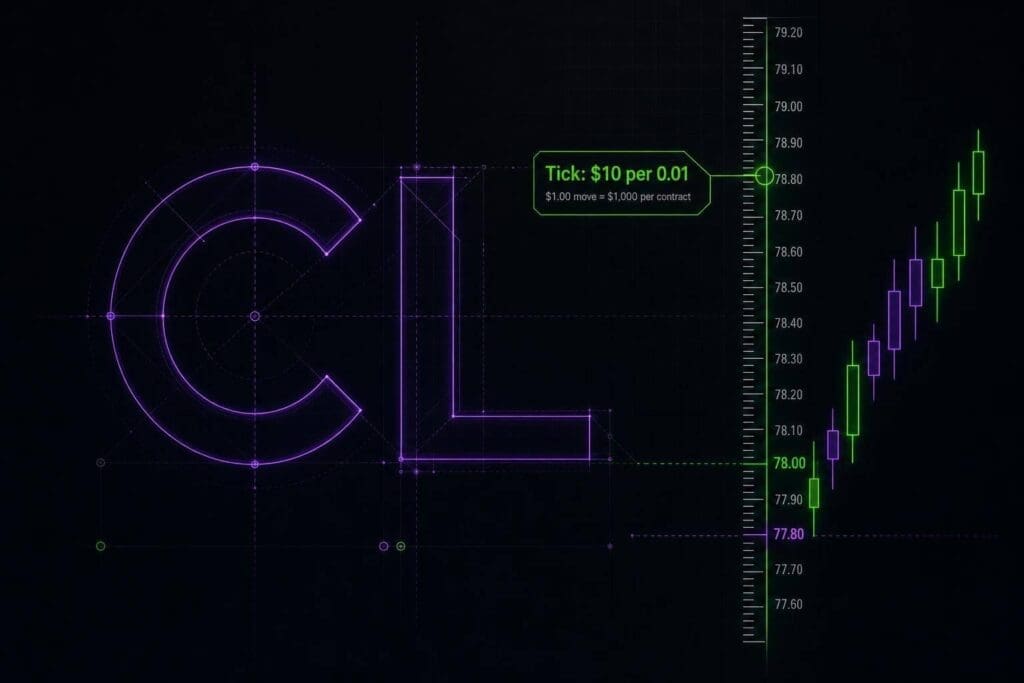
CL pays $10 per tick and $1,000 per $1.00 move. That’s the whole game in one line. If you trade crude, you need that math locked in before you touch size, set a stop, or think about scaling in. I’m going to strip this down to the parts that matter: contract size, quote format, session timing, month codes, and what common moves do to your P&L. CL looks cheap on the chart because it moves in pennies. Don’t get fooled. A 20-tick stop is $200 per contract. That adds up fast, especially if you come over from ES or NQ and treat crude like just another futures chart.
Introduction
Now that the tick math is clear, here are the CL contract specs behind it.
The table below sums up the core contract numbers.
| Specification | Value |
|---|---|
| Minimum Tick Size | $0.01 per barrel |
| Tick Value (1 contract) | $10.00 |
| Full Point Value ($1.00 move) | $1,000.00 |
| Contract Size | 1,000 barrels |
These numbers drive your stop placement, target setting, and position sizing. If you trade CL, this is the stuff you should know cold. Start with the exchange, symbol, and contract size, because that’s what every CL price calculation comes back to.
Table of Contents
- Introduction
- Core CL Contract Specs
- CL Tick Size, Tick Value, and Point Value
- CL Trading Hours
- CL Contract Months and Symbols
- What a 10-Tick or 25-Tick Move Means in Dollars
- CL vs. MCL and Other Futures Contracts
- The CL Specs That Matter Most for Trade Planning
Core CL Contract Specs
CL comes down to three simple specs: what it is, how big it is, and how the market quotes it.
Symbol, Exchange, and Product
CL is the symbol for WTI Light Sweet Crude Oil futures, traded on the New York Mercantile Exchange (NYMEX), which sits under CME Group. [2][3]
Contract Size and Price Quote Format
One standard CL contract controls 1,000 barrels of crude oil. [2][3] The market quotes price in dollars and cents per barrel, like $78.35. [3]
Notional Value at a Glance
Notional value = current price × 1,000 barrels. [7]
| CL Price Per Barrel | Notional Value (1 Contract) |
|---|---|
| $65.00 | $65,000 |
| $75.00 | $75,000 |
| $80.00 | $80,000 |
| $85.00 | $85,000 |
That’s your exposure before you even think about stop placement. A lot of traders gloss over this part, then act surprised when CL moves a little and the P&L swings hard. With contract size locked in, the next piece is tick size: how each $0.01 move turns into actual P&L.
CL Tick Size, Tick Value, and Point Value
Minimum Tick Size
CL’s minimum tick is $0.01 per barrel. That’s the smallest price move the market allows.[1][2]
Dollar Value Per Tick and Per Point
A CL tick is $0.01 per barrel, and that works out to $10.00 per contract. One full point is 100 ticks, so it’s $1,000.00 per contract.[1]
That’s why CL can feel a lot heavier than ES or NQ. The price move looks small. The P&L move isn’t.
| Contract | Symbol | Tick Size | Tick Value | Point Value |
|---|---|---|---|---|
| Crude Oil | CL | $0.01 | $10.00 | $1,000.00 |
| Micro Crude Oil | MCL | $0.01 | $1.00 | $100.00 |
| E-mini S&P 500 | ES | $0.25 | $12.50 | $50.00 |
| E-mini Nasdaq 100 | NQ | $0.25 | $5.00 | $20.00 |
With the tick math clear, the next step is knowing when CL actually trades.
Why CL Tick Math Confuses ES and NQ Traders
This is where ES and NQ traders get tripped up. They see a one-cent move and assume small risk. Bad read.
In CL, each tick is worth $10.00. So a 10-tick stop is $100.00 per contract. A 50-tick move is $500.00. One full point is $1,000.00. That hits a lot harder than most index traders expect when they first switch over.
For risk planning, the number that matters most is the dollar value of each tick. CL’s penny tick carries much more risk per contract than ES or NQ, and that changes how you size up, place stops, and think about heat in the trade.
CL Trading Hours
CL trades almost 24 hours a day, but the market does not feel the same all day. Tick value tells you the dollar risk per tick. Trading hours tell you when that risk gets messier because of slippage, thinner books, or faster moves. Same tick value. Very different trade quality depending on the session.
CME Globex Hours

CL futures trade on CME Globex from Sunday at 6:00 PM ET through Friday at 5:00 PM ET[7]. There’s a daily halt from 5:00 PM to 6:00 PM ET, and during that break you can’t place or modify orders.
Regular Hours vs. the Overnight Session
The main U.S. session runs from 9:30 AM to 4:00 PM ET. The 9:30 AM to 10:30 AM ET New York open is usually the sweet spot for execution: more volume, tighter spreads, and cleaner fills. By contrast, 12:00 PM to 2:00 PM ET is often thin, choppy, and full of fake moves[7].
The overnight session runs from 6:00 PM to 8:00 AM ET and includes Asia and Europe. CL can still move hard on macro headlines during those hours, but the book is usually thinner than it is during U.S. hours[7]. That matters. A move that looks small on paper can cost more when liquidity drops and slippage kicks in.
The table below shows the session windows that matter most if you care about execution.
| Session | Time (U.S. Eastern) | What to Expect |
|---|---|---|
| Sunday Open | Sunday 6:00 PM | First trades after the weekly reopen |
| Overnight | 6:00 PM – 8:00 AM | Lower volume; higher slippage risk |
| NY Open (Peak) | 9:30 AM – 10:30 AM | The highest-volume, most volatile period; tightest spreads |
| Mid-Day Lull | 12:00 PM – 2:00 PM | Thin and choppy; prone to false breakouts |
| Afternoon Session | 3:00 PM – 4:00 PM | Often active as traders reposition before the close |
| 4:00 PM–5:00 PM ET | 4:00 PM – 5:00 PM | Late-session repositioning |
| Daily Halt | 5:00 PM – 6:00 PM | Market closed; no execution possible |
| Weekly Close | Friday 5:00 PM | Market closes for the weekend |
CL settlement uses a 2:28 PM to 2:30 PM ET VWAP window, and that can briefly make price action more jumpy[8].
sbb-itb-46ae61d
CL Contract Months and Symbols
Read the CL ticker right. If you trade the wrong month, you can end up in a thin contract with wider spreads and worse fills. The tick value doesn’t change, but the month still matters because liquidity, spreads, and slippage do.
CL Symbol Format
Every CL futures contract uses three parts: the root symbol, the month code, and the year. So CLQ26 means CL (WTI Crude Oil) + Q (August) + 26 (2026). CLZ26 is the December 2026 contract [4][5].
Use the dated contract when you place orders. Some platforms also show continuous symbols like CL=F, @CL.1, or USOIL. Those are for charting, not order entry. If you send an order to the wrong symbol, that’s on you.
Month Codes: F Through Z
CL has listed contracts for every month of the year [6].
| Code | Month | Code | Month |
|---|---|---|---|
| F | January | N | July |
| G | February | Q | August |
| H | March | U | September |
| J | April | V | October |
| K | May | X | November |
| M | June | Z | December |
Front Month, Liquidity, and Rollover
Month choice hits execution harder than chart appearance. Stick with the front month if you want the best liquidity and the tightest spreads [6][7].
Keep an eye on the roll. Once the next contract starts doing more volume than the current front month, that’s usually your cue to switch. Trade the contract with the highest live volume. And don’t hang around in the expiring contract during its last week unless you have a clear reason to be there [6][7].
What a 10-Tick or 25-Tick Move Means in Dollars
For prop firm traders, CL tick value is what turns chart movement into account risk. You need that dollar math before you click buy or sell. Once you know the conversion, common CL moves stop looking small on the chart and start looking like actual P&L.
P&L Examples for One Contract
P&L = ticks × $10.
| Move | P&L for 1 Contract |
|---|---|
| 10 ticks | $100 |
| 25 ticks | $250 |
| 50 ticks | $500 |
| 100 ticks ($1.00 move) | $1,000 |
That’s the part a lot of traders gloss over. A 10-tick wiggle in CL is $100 per contract. A 25-tick move is $250. If you’re trading more than one contract, that number stacks fast.
Use the same math on your stop before you enter. Not after the trade starts going against you.
Risk Per Contract Based on Stop Size
Risk per contract = stop size in ticks × $10.
So if your stop is 20 ticks, you’re risking $200 per contract. Trade 2 contracts, and now you’re at $400 of exposure. Simple math, but it keeps you out of dumb size.
Position Sizing for Prop Firm Traders
Your contract count should match your risk limit. That’s it. If one CL contract is too big for the room you’ve got, drop to MCL, where the tick value is $1 per tick.
This is where a lot of prop traders screw themselves. The setup might be fine, but the size is wrong. If CL blows past your risk cap, forcing it makes no sense. Use the smaller contract and keep the trade under control.
Once you know what each move is worth in dollars, the next thing that matters is when CL tends to trade cleanly.
CL vs. MCL and Other Futures Contracts
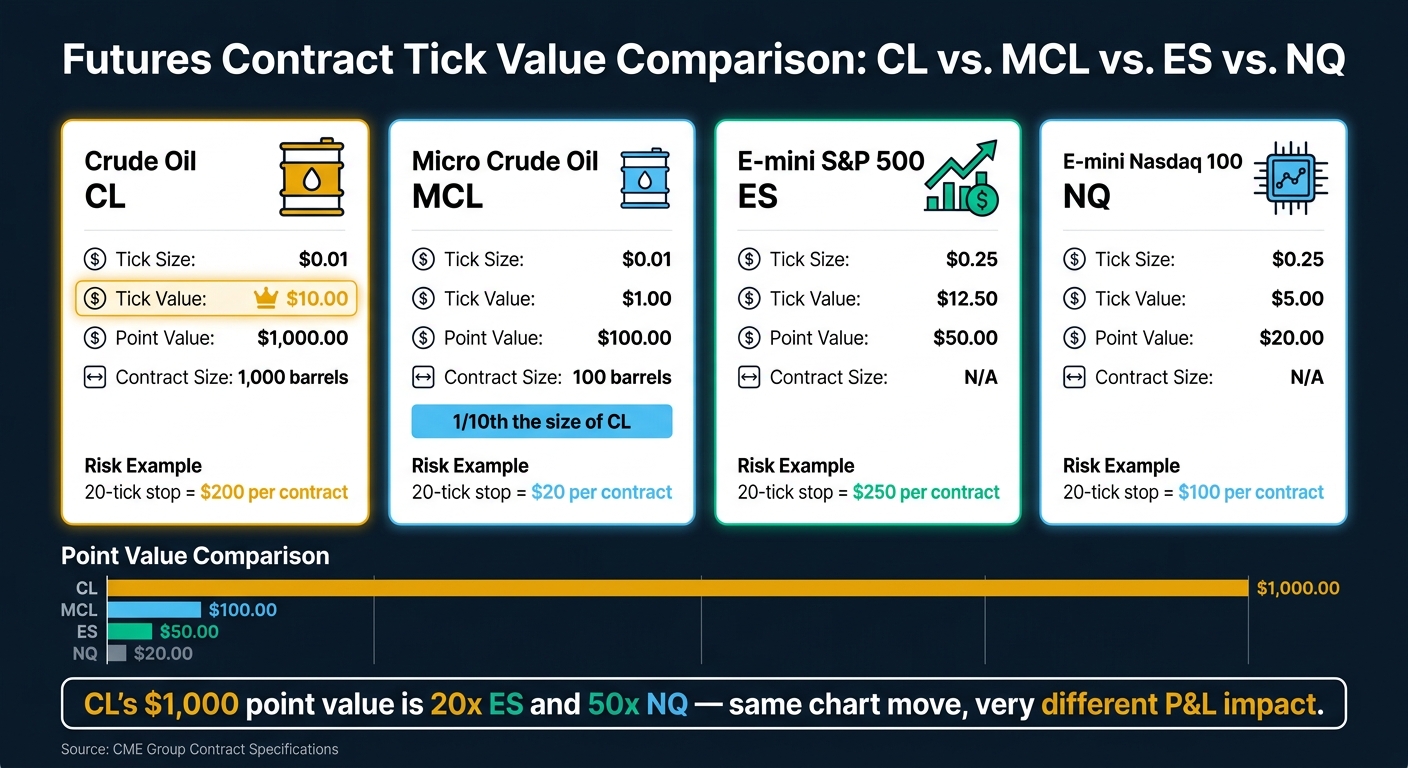
CL vs. MCL vs. ES vs. NQ: Futures Tick Value Comparison
If CL is too big for your stop, MCL gives you the same crude market without the same dollar punch. CL is 10x MCL, so the exact same setup means 10x the dollar risk.
CL vs. MCL for Risk Control
CL and MCL both move in $0.01 ticks, but they are not the same size contract. CL represents 1,000 barrels of crude oil. MCL represents 100 barrels, which is exactly one-tenth the size.[2][1] So the math changes fast:
- CL = $10.00 per tick and $1,000.00 per point
- MCL = $1.00 per tick and $100.00 per point
| Contract | Tick Size | Tick Value | Point Value | Contract Size |
|---|---|---|---|---|
| Crude Oil (CL) | $0.01 | $10.00 | $1,000.00 | 1,000 barrels |
| Micro Crude Oil (MCL) | $0.01 | $1.00 | $100.00 | 100 barrels |
That 10:1 ratio matters a lot when your drawdown limit is tight. A 20-tick stop on CL costs $200.00 per contract. The same 20-tick stop on MCL costs $20.00. That’s a huge difference.
MCL gives you more room to place a sane stop without getting squeezed by drawdown. For risk control, it’s the cleaner place to start.[7]
CL vs. ES and NQ Tick Logic
CL uses a $0.01 tick worth $10.00. ES and NQ use $0.25 ticks, but their tick values are different: $12.50 for ES and $5.00 for NQ.
| Contract | Tick Size | Tick Value | Point Value |
|---|---|---|---|
| Crude Oil (CL) | $0.01 | $10.00 | $1,000.00 |
| E-mini S&P 500 (ES) | $0.25 | $12.50 | $50.00 |
| E-mini Nasdaq 100 (NQ) | $0.25 | $5.00 | $20.00 |
These are the numbers that matter when you turn CL into an actual trade plan.
The CL Specs That Matter Most for Trade Planning
Once you’ve seen the 10-tick and 25-tick examples, the next step is simple: turn every CL move into dollar risk before you click in.
A 15-tick stop on one contract costs $150.00. On two contracts, that jumps to $300.00. If that number doesn’t fit your max loss, the trade doesn’t fit. Simple as that.
The same math gets big fast. A 1.00-point move in CL equals $1,000.00 per contract.[2][3] That’s why crude can look calm for a minute, then smack you hard when size is too big.
CL is a physically delivered contract, with delivery at Cushing, Oklahoma.[2] So trade the active front month, and don’t sit in an expiring contract all the way into delivery.
These specs don’t change. Your job is to run the dollar math on every setup before entry.
FAQs
How do I calculate CL risk before entering a trade?
Multiply your contract count by your stop size in ticks, then by the CL tick value. For standard CL, the tick size is 0.01, and each tick is $10.00.
Formula: Risk = Contracts × Stop Loss in Ticks × $10.00
Example:
1 CL contract with a 10-tick stop = $100.00 at risk
For MCL, each tick is $1.00, so a 10-tick stop = $10.00 at risk.
When should I trade MCL instead of CL?
Trade Micro Crude Oil (MCL) instead of standard Crude Oil (CL) if you’re new, working with a smaller account, or need tighter risk control under strict drawdown rules.
CL moves $10.00 per tick. MCL moves $1.00 per tick.
That difference matters. A lot.
With MCL, your dollar risk stays lower, and it’s easier to manage trades without feeling like every tick is trying to punch you in the face. You still get live market action, but with more room to practice execution, sizing, and discipline under actual conditions.
How do I know when to roll to the next CL contract?
There’s no fixed calendar rule for rolling CL. And that matters, because CL futures are physically delivered. Hold too close to expiration and you can run into forced liquidation or, worse, delivery issues.
So don’t trade this off a date alone. Watch the volume as expiration gets closer. Roll when the next contract month is consistently doing more volume than the front month. In most cases, that shift happens about 2 to 4 business days before expiration, when liquidity starts drying up in the current month and the bid-ask spread gets uglier.