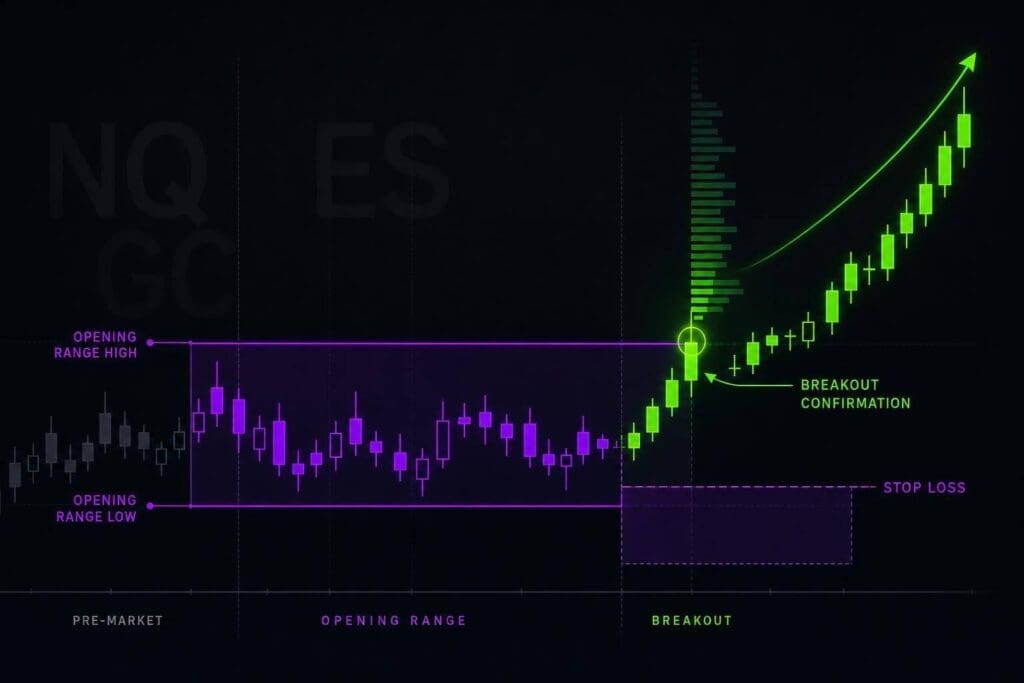
The ORB is dead simple: mark the first 5, 15, or 30 minutes, lock the high and low, then trade the break only if price gets accepted outside that range. That’s the whole play. If you trade ES, NQ, CL, or GC, this setup gives you a clean trigger, a hard invalidation point, and risk you can calculate with a futures risk management planner before you click anything.
I like ORB because it forces discipline. You don’t need ten indicators or some galaxy-brain read on macro. You need a fixed window, a clear breakout, and the balls to pass when the open is sloppy. Below, I’ll cut this down to the parts that matter most: when the setup works, what confirms it, and where traders usually screw it up.
Part 1 Bullish Market Open Breakout Strategy | Futures & Stocks Price Action
sbb-itb-46ae61d
What Is an Opening Range Breakout in Futures?
What matters next is how price reacts once the opening range is set. If price breaks out and gets accepted, the move can keep running. If it pokes outside the range and stalls, that push often gets slapped back. That early high-low band becomes your first map for the day: direction, risk, and where the market is saying yes or no.
The next job is simple. You need to decide which session window counts as the opening range for the contract you’re trading.
Why the Opening Range Matters
The opening range shows the session’s first real balance between buyers and sellers. It helps you see whether one side is starting to take control, instead of getting fooled by a quick pop that never had much behind it.
Bullish Breakouts vs. Bearish Breakdowns
A bullish breakout happens when price pushes above the opening range high and actually keeps going with steady participation. A bearish breakdown happens when price breaks below the opening range low and stays below it. Traders use order-flow tools like the DOM and depth-of-market views to check whether the break has traders behind it or if it’s starting to die out [1].
From there, the setup comes down to one thing: how you define the opening window for each contract.
How to Define the Opening Range on ES, NQ, CL, and GC
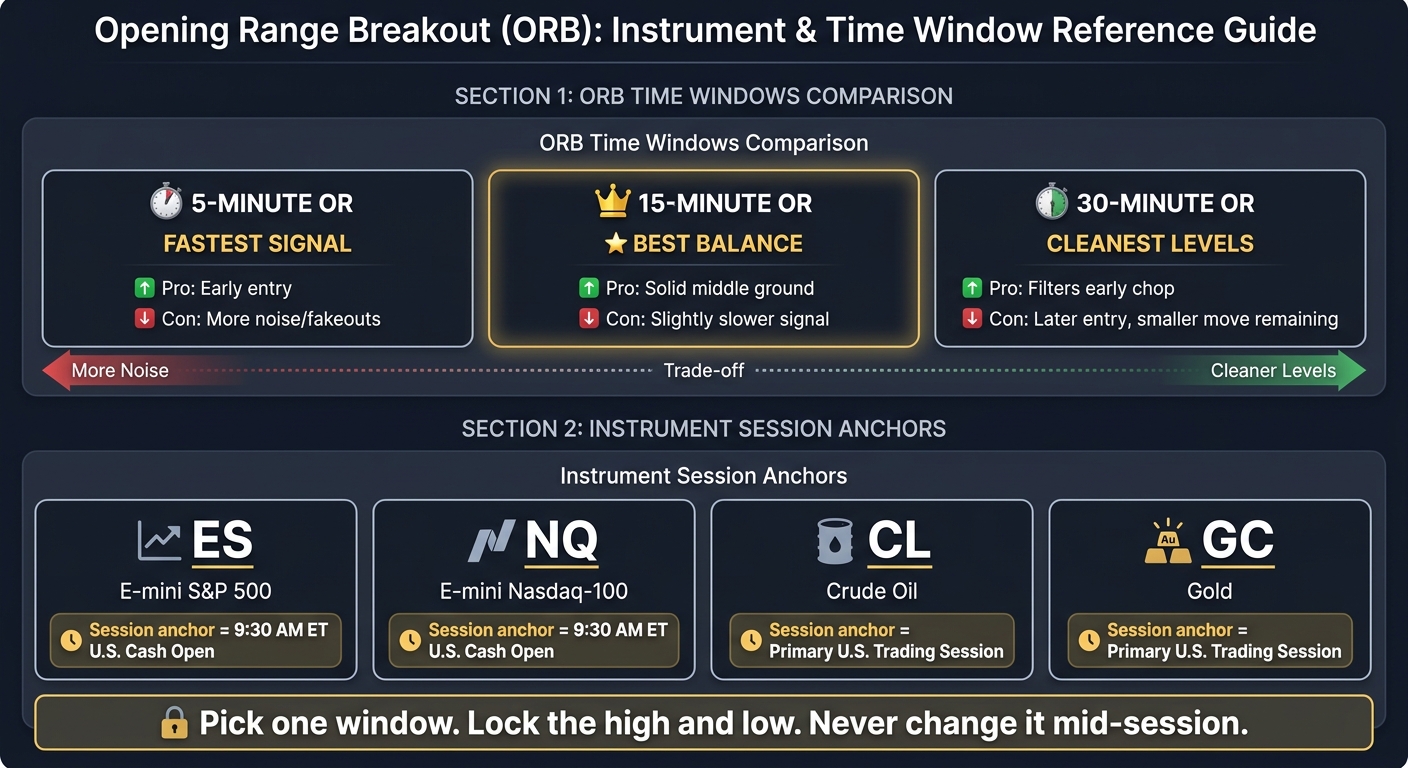
Opening Range Breakout: Session Windows & Instrument Guide for Futures Traders
Pick a fixed opening window for the contract you trade, then don’t move it around. Mark the high and low during that window. Once the window closes, those two levels stay locked for the rest of the session.
That part matters more than people think. If you keep tweaking the range after the fact, the whole setup gets sloppy fast.
Common Opening Range Time Windows
The most common windows are 5, 15, and 30 minutes.
- 5-minute OR: reacts fast, but you’ll deal with more noise
- 15-minute OR: a solid middle ground
- 30-minute OR: slower, but it filters out more early chop
Shorter windows give you earlier signals. Longer windows usually give cleaner levels. Same trade-off every time.
Session Timing by Instrument: ES, NQ, CL, and GC
For ES and NQ, most traders anchor the opening range to the 9:30 a.m. ET U.S. cash market open. For CL and GC, the usual focus is each market’s primary U.S. trading session [1].
| Instrument | Session Anchor |
|---|---|
| ES (E-mini S&P 500) | 9:30 a.m. ET U.S. cash market open |
| NQ (E-mini Nasdaq-100) | 9:30 a.m. ET U.S. cash market open |
| CL (Crude Oil) | Primary U.S. trading session |
| GC (Gold) | Primary U.S. trading session |
Once you set the session anchor, chart the range the same way every day. No switching between windows. No changing the start time because today looks different.
How to Chart the Opening Range Correctly
Use a 1-minute or 5-minute chart to mark the opening range. Then use your platform’s session template or ORB tool to lock those levels as soon as the window closes.
Keep it simple. Mark the high. Mark the low. Freeze both levels. That’s the range you trade against for the rest of the session.
What Makes a Range Break a Valid Trade Setup?
Not every opening-range break is worth taking. A lot of them are just quick stop hunts that pop outside the range, suck people in, and snap right back. What matters is simple: is there actual participation behind the move, or is it just noise?
Entry Confirmation That Actually Matters
Use order flow to check whether traders are backing the break. That means watching the DOM, tape, liquidity, and cumulative delta together. You want them pointing in the same direction.
When price breaks through the opening range and delta is moving with it, the setup has more behind it. When price breaks but delta doesn’t confirm, that’s usually a failed breakout [1].
Filters That Cut Down on False Breakouts
Location matters more than a lot of traders want to admit. A break straight into a clear level often goes nowhere.
Use prior-day high, prior-day low, and nearby support or resistance as your location filter [2]. Those levels help you tell the difference between a move that has room to run and one that’s about to slam into a wall.
Order Flow and Timing Confirmation
A clean ORB needs three things lined up: location, participation, and timing. If one piece is missing, sit on your hands. No need to force it.
Once the break clears those checks, then you can deal with the next part: entry, stop placement, and risk control.
How to Execute ORB Trades: Entries, Stops, Targets, and Risk Controls
ORB execution is a lot cleaner when your rules are locked in before the bell. Entry. Stop. Target. Size. Set that stuff first, then trade the plan.
Once the breakout clears your location and order-flow filters, move to execution. Don’t build the trade in the middle of the move. That’s how you end up chasing, oversizing, or talking yourself into junk.
Entry Methods for Long and Short Setups
For a long setup, enter on a confirmed close above the opening range high. For a short setup, enter on a confirmed close below the opening range low.
The key part is the confirmed close. Don’t jump on the first tick that pokes outside the range. Wait for the break to hold. That one habit alone can save you from a pile of fakeouts.
Stop Placement and Profit Targets
Place your stop just beyond the opposite side of the opening range. For a long, that means below the range low. For a short, it goes above the range high.
Before you enter, convert the stop distance from ticks into dollars using a futures trading profit calculator. No guessing. No “it looks fine.” You need to know what the trade costs if it fails, then check that the target still makes sense for that risk.
Once the exit is mapped out, the last piece is position size against your daily loss limit.
Position Sizing and Daily Loss Limits
Size the trade before you click in. Fast markets make people do dumb things, and oversizing is near the top of that list.
Your position size should come straight from the opening-range width. If the range is wide, size comes down. If the range is tight, size might go up, but only if it still fits your risk cap. Then make sure the loss on that setup still leaves enough room in the account if the trade gets stopped.
Also, include exchange and commission costs in the math. In futures, those fees stack up fast.
The next section shows how these rules look in bullish and bearish sessions.
Bullish and Bearish ORB Examples in Real Futures Sessions
Here’s what a clean ORB looks like in live futures action with ES and CL. First the long setup, then the short.
Bullish ORB Example
ES sets the opening range, closes above the high, and then holds that break on the next bar. That’s the part you want. Not just a pop above the level, but a bar that can actually stay there.
If you’re using the DOM and tape, check that delta is moving with the breakout. You want buyers pushing, not a weak move that stalls right after the break. If the next bar holds above the breakout level, the long is still valid. If price closes back inside the range, the setup is dead. Simple.
The same setup flips cleanly for shorts.
Bearish ORB Example
CL breaks the opening range low, retests that level from underneath, and still can’t get back in. That’s the tell. The DOM shows bids fading on the retest, which lines up with weak price action.
If the short stays below the range, it remains valid. If price closes back inside the range, invalidate the trade and move on. No need to argue with it.
These two examples set up the last point: using ORB the same way every session, instead of changing the rules mid-trade.
Bottom Line on the Opening Range Breakout Strategy
Once your entry, stop, and size are locked in, one thing still matters: market condition.
ORB tends to work best when the market is moving with clear direction and price is accepting cleanly above or below the opening range. Messy opens are a different story. So are big scheduled news events. Same deal for setups where the risk/reward math looks fuzzy before you click in. Those are the trades to pass on. No debate. If those conditions aren’t there, skip the trade.
This strategy only works if your range, confirmation, and risk rules are set before the open. If you take every breakout, you kill the whole point of being selective. Define the range the same way every session. Wait for confirmation before entry. Size the trade to fit your plan. Then take ONLY the ORB setups that check every box, and leave the rest alone.
FAQs
Which opening range window is best for beginners?
For most beginners, the five-minute opening range is the sweet spot. It gives the first burst of chaos after the open a little time to calm down, but it still catches a decent move when momentum shows up.
More seasoned traders might work with a one-minute or fifteen-minute window. That said, the five-minute range gives you a clean structure to trade around without getting chopped up by the wild price swings that often hit right after the bell.
How do I spot a real breakout from a fakeout?
A valid opening range breakout means a lot more when order flow and volume back it up. Indicators can help, sure, but they shouldn’t be doing all the heavy lifting.
What you want to see is pretty simple: active order flow on the DOM, a clean volume spike in the direction of the break, and price staying outside the range instead of poking through and snapping right back in. That’s the difference between a move with intent and a fake-out that burns impatient traders.
Data quality matters too. If your feed lags, drops prints, or gives you messy DOM action, you’re judging breakout strength with bad information. That’s a bad spot to be in when the open is moving fast.
When should I skip an ORB trade?
Skip an Opening Range Breakout (ORB) when the break looks weak. If price pokes outside the range but doesn’t move with any punch, that’s where fakeouts love to show up.
Pass on the trade if volume or order flow fades right after the break. Same deal if price is running straight into nearby higher-timeframe support or resistance. That’s a bad spot to force an entry.
Low volatility is another red flag. If the market isn’t moving, you usually won’t get the kind of clean push an ORB needs.
Also, don’t take the trade if the stop-loss required to make the setup work blows up your risk plan or funded-account limits. Bad location and bad risk is a dumb combo.