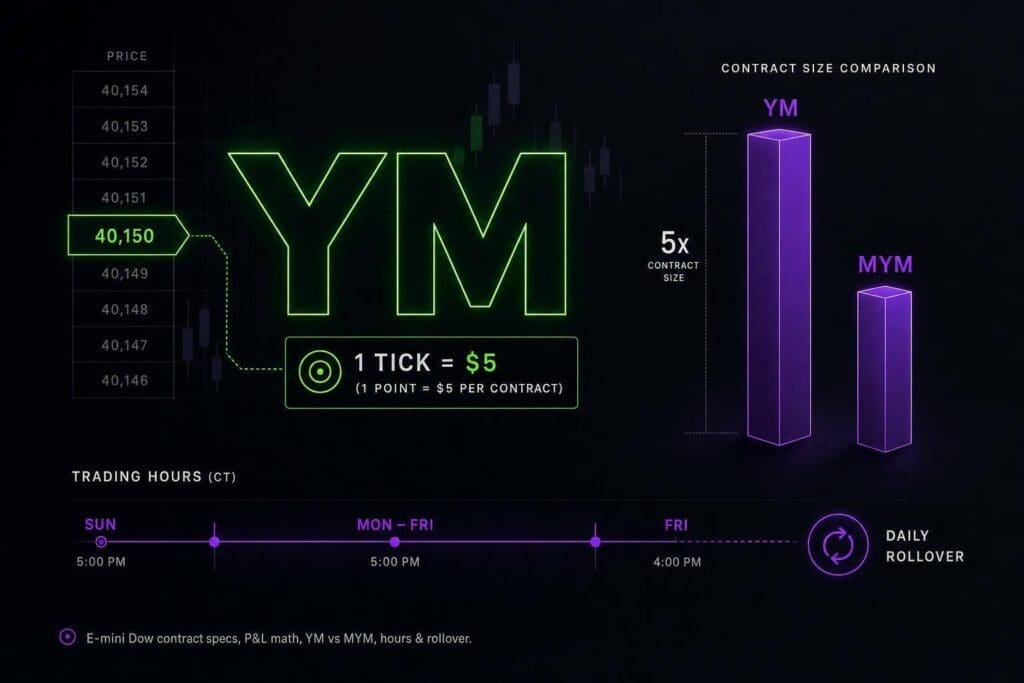
One YM tick is worth $5. Since YM moves in 1-point steps, that also means 1 point = $5 per contract. That’s the whole core of the contract. If you trade the E-mini Dow, your P&L math stays clean, but your losses can stack up fast when you add size.
I’ll keep this tight. You’re here for the numbers that matter: tick value, contract size, stop-loss math, MYM comparison, and rollover basics. If you trade best futures prop firms, this is the stuff that keeps you from doing dumb sizing and burning through drawdown for no good reason.
How to Calculate Profit or Loss on Futures Contracts
sbb-itb-46ae61d
Introduction: How Much Is One YM Tick Worth?
On the E-mini Dow, YM moves in 1-point increments, and each point is worth $5 per contract [3]. YM is the E-mini Dow Jones futures contract. It trades on the Chicago Board of Trade (CBOT) under CME Group and routes through CME Globex. It tracks the Dow Jones Industrial Average (DJIA) and settles in cash [3]. Its notional value is DJIA × $5 per contract [3]. Those are the numbers that drive your P&L and your risk on every YM trade.
For prop traders, this is one of YM’s best traits: the math is dead simple. A 10-point stop means $50 of risk per contract. A 100-point stop means $500. No weird tick math. No mental gymnastics. Risk moves in a straight line, which makes YM easy to size and easy to stack up against MYM. Next, the contract specs break down how the symbol, tick size, point value, and settlement shape every trade.
Table of Contents
- YM E-mini Dow Contract Specs
- How YM Tick Value Affects Your Profit and Loss
- How to Calculate YM Dollar Risk Per Stop Size
- YM vs. MYM: Choosing the Right Dow Contract
- YM Trading Hours and Contract Rollover
- Key YM Numbers to Remember
YM E-mini Dow Contract Specs
Before you get into P&L math, you need the base numbers. No fluff. Just the contract specs that matter.
| Specification | Details |
|---|---|
| Ticker Symbol | YM |
| Exchange | CBOT (CME Group) |
| Contract Size | $5 × Dow Jones Industrial Average |
| Tick Size | 1.00 index point |
| Tick Value / Point Value | $5.00 |
| Expiration Cycle | Quarterly: March, June, September, December |
| Settlement | Cash settled |
| Trading Hours (ET) | Sun 6:00 PM – Fri 5:00 PM (daily break 5:00 PM – 6:00 PM) |
Source: CME Group
Symbol, Exchange, and Contract Type
The ticker is YM, and it trades on CBOT, which sits under CME Group. Month codes use standard CME formatting. So YMH26 means the March 2026 contract.
Tick Size, Tick Value, and Point Value
YM moves in 1-point increments. Each point is worth $5 per contract.
That keeps the math clean:
- 10 points = $50
- 100 points = $500
If you’re used to faster-moving index products, YM tends to feel more straightforward on the P&L side. One point is one tick. No weird fractions. No extra translation step.
Contract Size, Expiration Months, and Settlement
The contract size is $5 times the Dow Jones Industrial Average. YM expires on the standard quarterly cycle: March, June, September, and December.
At expiration, YM is cash settled, so there’s no delivery piece to deal with.
These are the exact numbers used in the P&L and risk examples below.
How YM Tick Value Affects Your Profit and Loss
YM P&L comes down to one number: $5 per point. That’s it. Every move in YM turns into dollars off that multiplier.
The Basic YM P&L Formula
The math is dead simple (or use a futures trading profit calculator):
Points moved × $5 × number of contracts = P&L
If YM moves 50 points in your favor and you’re holding 2 contracts, you make $500. If it moves 50 points against you, you’re down $500.
YM Move Examples in Dollars
Here’s what common YM moves look like in straight dollar terms:
| Points Moved | 1 Contract | 2 Contracts | 5 Contracts |
|---|---|---|---|
| 1 point | $5 | $10 | $25 |
| 10 points | $50 | $100 | $250 |
| 25 points | $125 | $250 | $625 |
| 50 points | $250 | $500 | $1,250 |
| 100 points | $500 | $1,000 | $2,500 |
This is the same $5-per-point setup you’ll use to size stops in the next section.
Notional Value vs. Tick Value
Notional value tells you the contract’s exposure, not your P&L. If the Dow is at 40,000, one YM contract controls $200,000 in notional exposure [3]. The tick value still stays fixed at $5 per point, but the total market exposure moves with the index.
That gap matters. A contract can have the same point value while the dollar exposure behind it shifts hard. That’s why position sizing isn’t optional.
Next, turn points into dollar risk per stop.
How to Calculate YM Dollar Risk Per Stop Size
Once you know what YM pays per point, the next step is simple: figure out what your stop will cost.
Converting Stop Size in Points to Dollar Risk
The formula is dead simple: stop size (points) × $5.00 × number of contracts = dollar risk [2].
A 25-point stop on one YM contract means $125 at risk if price hits your stop. Trade two contracts, and that same stop jumps to $250. No mystery there. More size, same stop, more pain.
Here’s what that looks like with common stop sizes:
| Stop Size (Points) | 1 YM Contract | 2 YM Contracts | 3 YM Contracts |
|---|---|---|---|
| 10 points | $50 | $100 | $150 |
| 20 points | $100 | $200 | $300 |
| 25 points | $125 | $250 | $375 |
| 40 points | $200 | $400 | $600 |
| 50 points | $250 | $500 | $750 |
Your stop should sit behind an actual level. Support. Resistance. ATR. Something on the chart that makes sense. Not some random number you picked because it “feels okay.”
That same formula gets ugly fast when you oversize.
How YM Risk Grows Quickly With Oversizing
YM is only $5 per point, but that adds up fast when you stack contracts. A 40-point stop on three YM contracts puts $600 at risk on one trade. That’s not small.
On a prop evaluation with a $2,000 max drawdown, one full stop at $600 eats 30% of your whole drawdown buffer [1]. That’s the part newer traders miss. They look at the account size and ignore the drawdown rule.
Don’t size off the headline balance. Size off the drawdown cap. That’s the number that matters. Mastering this is one of the key strategies for passing challenges.
When to Switch to a Smaller Dow Contract
If your chart says the trade needs a bigger stop than your drawdown can handle, don’t force a tighter stop just to stay in YM. That’s how you get clipped out of decent setups.
Switch to MYM.
A 40-point stop on one MYM contract risks $20, not $200, because each MYM point is worth $0.50 instead of $5.00 [1][4].
Same Dow move. Much smaller hit.
If the stop is too large for your drawdown, the next step is comparing YM with MYM.
YM vs. MYM: Choosing the Right Dow Contract
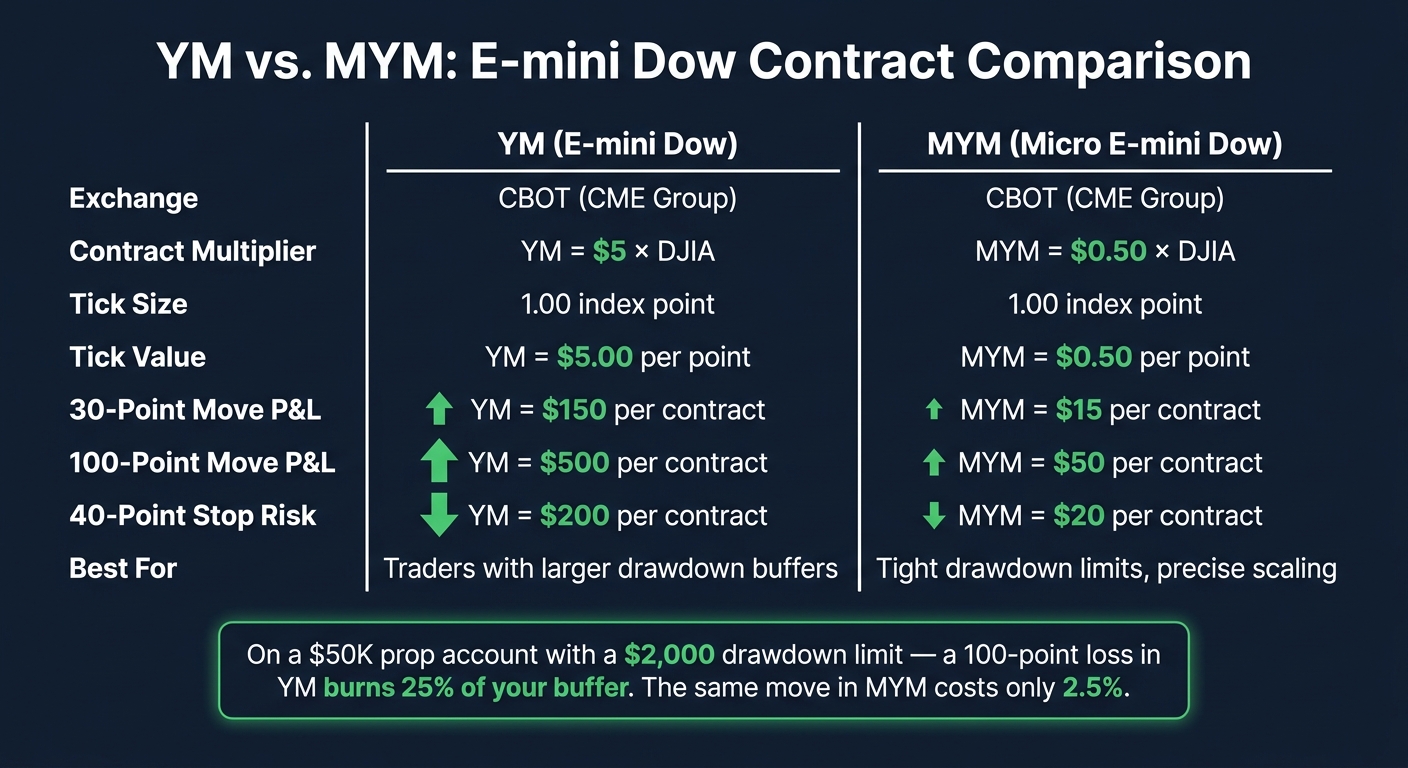
YM vs. MYM E-mini Dow: Contract Specs & Risk Comparison
If YM is too jumpy for your stop, MYM gives you the same Dow market with a lot less dollar risk.
YM and MYM Spec Comparison
MYM is one-tenth the size of YM. Same move, one-tenth the dollar hit.
| Feature | E-mini Dow (YM) | Micro E-mini Dow (MYM) |
|---|---|---|
| Exchange | CBOT | CBOT |
| Contract Multiplier | $5 × DJIA Index[1] | $0.50 × DJIA Index[1] |
| Tick Size | 1.00 point[1][2] | 1.00 point[1][2] |
| Tick Value | $5.00[1][2] | $0.50[1][2] |
| Point Value | $5.00[1][2] | $0.50[1][2] |
That gap is what changes your P&L so much, even though both contracts track the same index.
P&L and Leverage Differences Between YM and MYM
A 30-point move in YM means a $150 swing on one contract. That same 30-point move in MYM is just $15[1].
That’s the whole deal. YM gives you more notional exposure, so your wins and losses both get bigger. Contract choice isn’t about being bullish or bearish. It’s about sizing.
Which Contract Fits Prop Traders Better?
For prop traders, this mostly comes down to stop size and drawdown room. On a $50,000 prop firm account with a $2,000 drawdown limit, a 100-point move against you in YM is a $500 loss. That burns 25% of your total drawdown buffer[1]. The same 100-point move in MYM is $50, or 2.5%[1].
YM fits traders who can handle bigger dollar swings. MYM makes more sense if you’re working with tight drawdown limits and want cleaner sizing. It also gives you more control when scaling in, since you can add exposure in smaller steps[1][4].
Knowing the tick value is one piece of it. You also need to know when these contracts trade and how rollover affects them. That’s where session hours and contract expiration start to matter.
YM Trading Hours and Contract Rollover
YM trading hours and rollover rules hit three things right away: liquidity, fills, and the contract you should actually be trading.
YM Trading Hours on CME Globex

YM trades almost 24 hours a day on CME Globex, from Sunday at 6:00 PM ET to Friday at 5:00 PM ET, with a daily maintenance break from 5:00 PM to 6:00 PM ET.[3][5] That gives you a lot of screen time, but not every hour trades the same.
Midday and overnight sessions usually come with thinner volume and wider spreads.[2] That matters. A setup that feels clean during peak U.S. hours can get sloppier fast when fewer traders are in the market.
Holiday Schedules and Session Changes
The regular Globex schedule is only part of the story. U.S. holidays can change liquidity fast, and not in a good way. Major U.S. holidays and the sessions around them often mean shortened hours or full closures.[6]
Check the CME Group holiday calendar before you trade around any U.S. holiday. Don’t just assume the market will run like a normal day. That’s how traders walk into thin conditions and bad fills.
Contract Expiration and Rollover Basics
When volume moves, the symbol matters just as much as the chart. YM uses a quarterly expiration cycle:
- March (H)
- June (M)
- September (U)
- December (Z)
The front-month contract gets most of the volume, and most traders roll before the third Friday of the expiration month.[1][2] If you’re still on the old contract after volume leaves, your chart can look fine while your fills get worse. That’s a bad combo.
Your platform symbol might look like YMU26 for the September 2026 contract. If you’re not sure which month is active, check volume in your platform instead of trusting the last symbol you traded. Some brokers or top futures prop firms may close expiring positions if you don’t roll them.[1]
These timing rules change the numbers you size and track.
Key YM Numbers to Remember
If you just need the stuff that matters before you place a YM order, keep this nearby.
At $5 per point, a 10-point stop means $50 of risk per contract. No fluff. That’s the math.
YM expires quarterly:
- March
- June
- September
- December
| Specification | YM Detail |
|---|---|
| Tick Size | 1.00 index point |
| Tick Value | $5.00 per contract |
| Point Value | $5.00 |
| Contract Size | $5 × Dow Jones Industrial Average |
| Exchange | CBOT (CME Group) |
| Settlement | Cash settled |
FAQs
How much margin do I need to trade YM?
In a personal futures brokerage account, YM intraday margin is usually $300 to $500 per contract. That’s the bare minimum to keep the trade open during regular market hours. Hold it past the session, and the overnight margin jumps a lot.
With a prop firm, it works differently. You’re usually not posting a normal margin deposit like you would in a retail brokerage account. The firm sets your contract limits, and your risk is controlled by the account’s drawdown rules instead of margin calls.
When should I trade YM for the best liquidity?
Trade YM during Regular Trading Hours (RTH), from 9:30 AM to 4:00 PM ET. That’s when liquidity is strongest and spreads are usually the tightest.
The best windows are:
- 9:30 AM–11:00 AM ET: This is the opening push. You’ll usually get the most movement, the most volume, and cleaner reactions.
- 2:00 PM–4:00 PM ET: The afternoon session tends to wake back up as traders reposition into the close.
Try to avoid 11:00 AM–2:00 PM ET. That stretch often turns into chop. Volume fades, moves can get sloppy, and YM starts chewing up impatient traders.
How do I know when to roll to the next YM contract?
YM expires every quarter: March, June, September, and December.
You should roll to the next contract as the front month gets close to expiration. In most cases, that means the Monday before the third Friday of the expiration month.
Stick with the front month if you want better liquidity and cleaner fills. That’s the contract most traders are using, so execution is usually smoother.
If you want to confirm the exact date, check the CME expiration calendar.