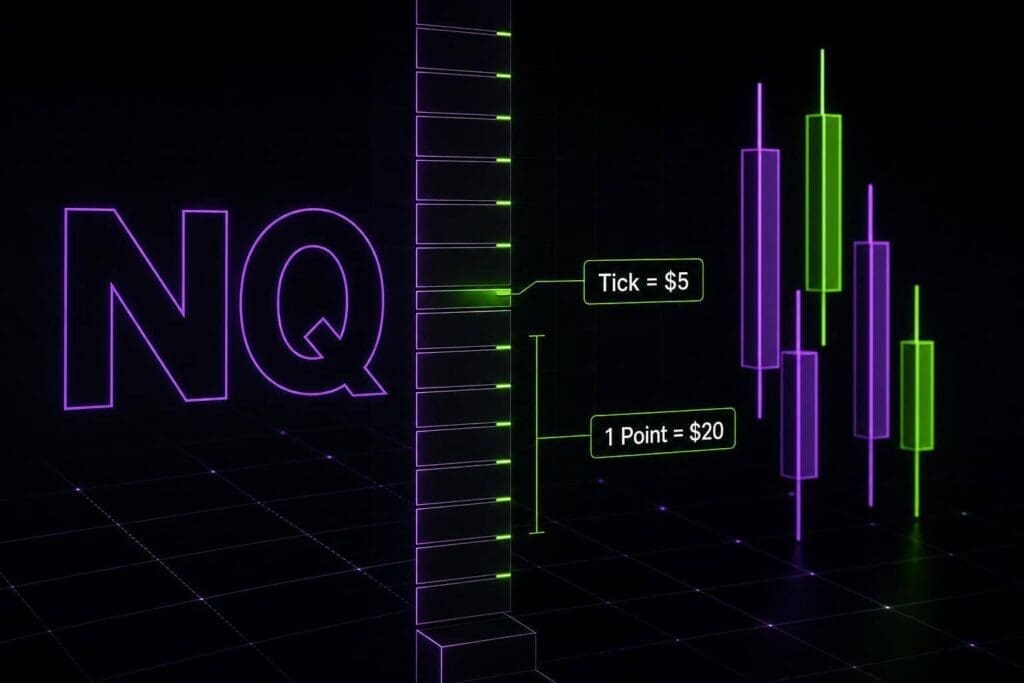
One NQ tick is $5. That’s the number I’d keep in my head before anything else. Since NQ moves in 0.25-point increments, a full point is $20, 10 points is $200, and 50 points is $1,000 per contract. That’s why NQ feels great when you’re right and brutal when you’re oversized.
If you’re here to get the contract math straight without the fluff, this is the short version. I’m boiling the article down to the numbers that hit your risk, sizing, and drawdown. If one full NQ contract feels too chunky, that’s where MNQ starts making a lot more sense.
Minimum Price Fluctuation (Tick)
sbb-itb-46ae61d
How the E-mini Nasdaq-100 (NQ) Contract Works
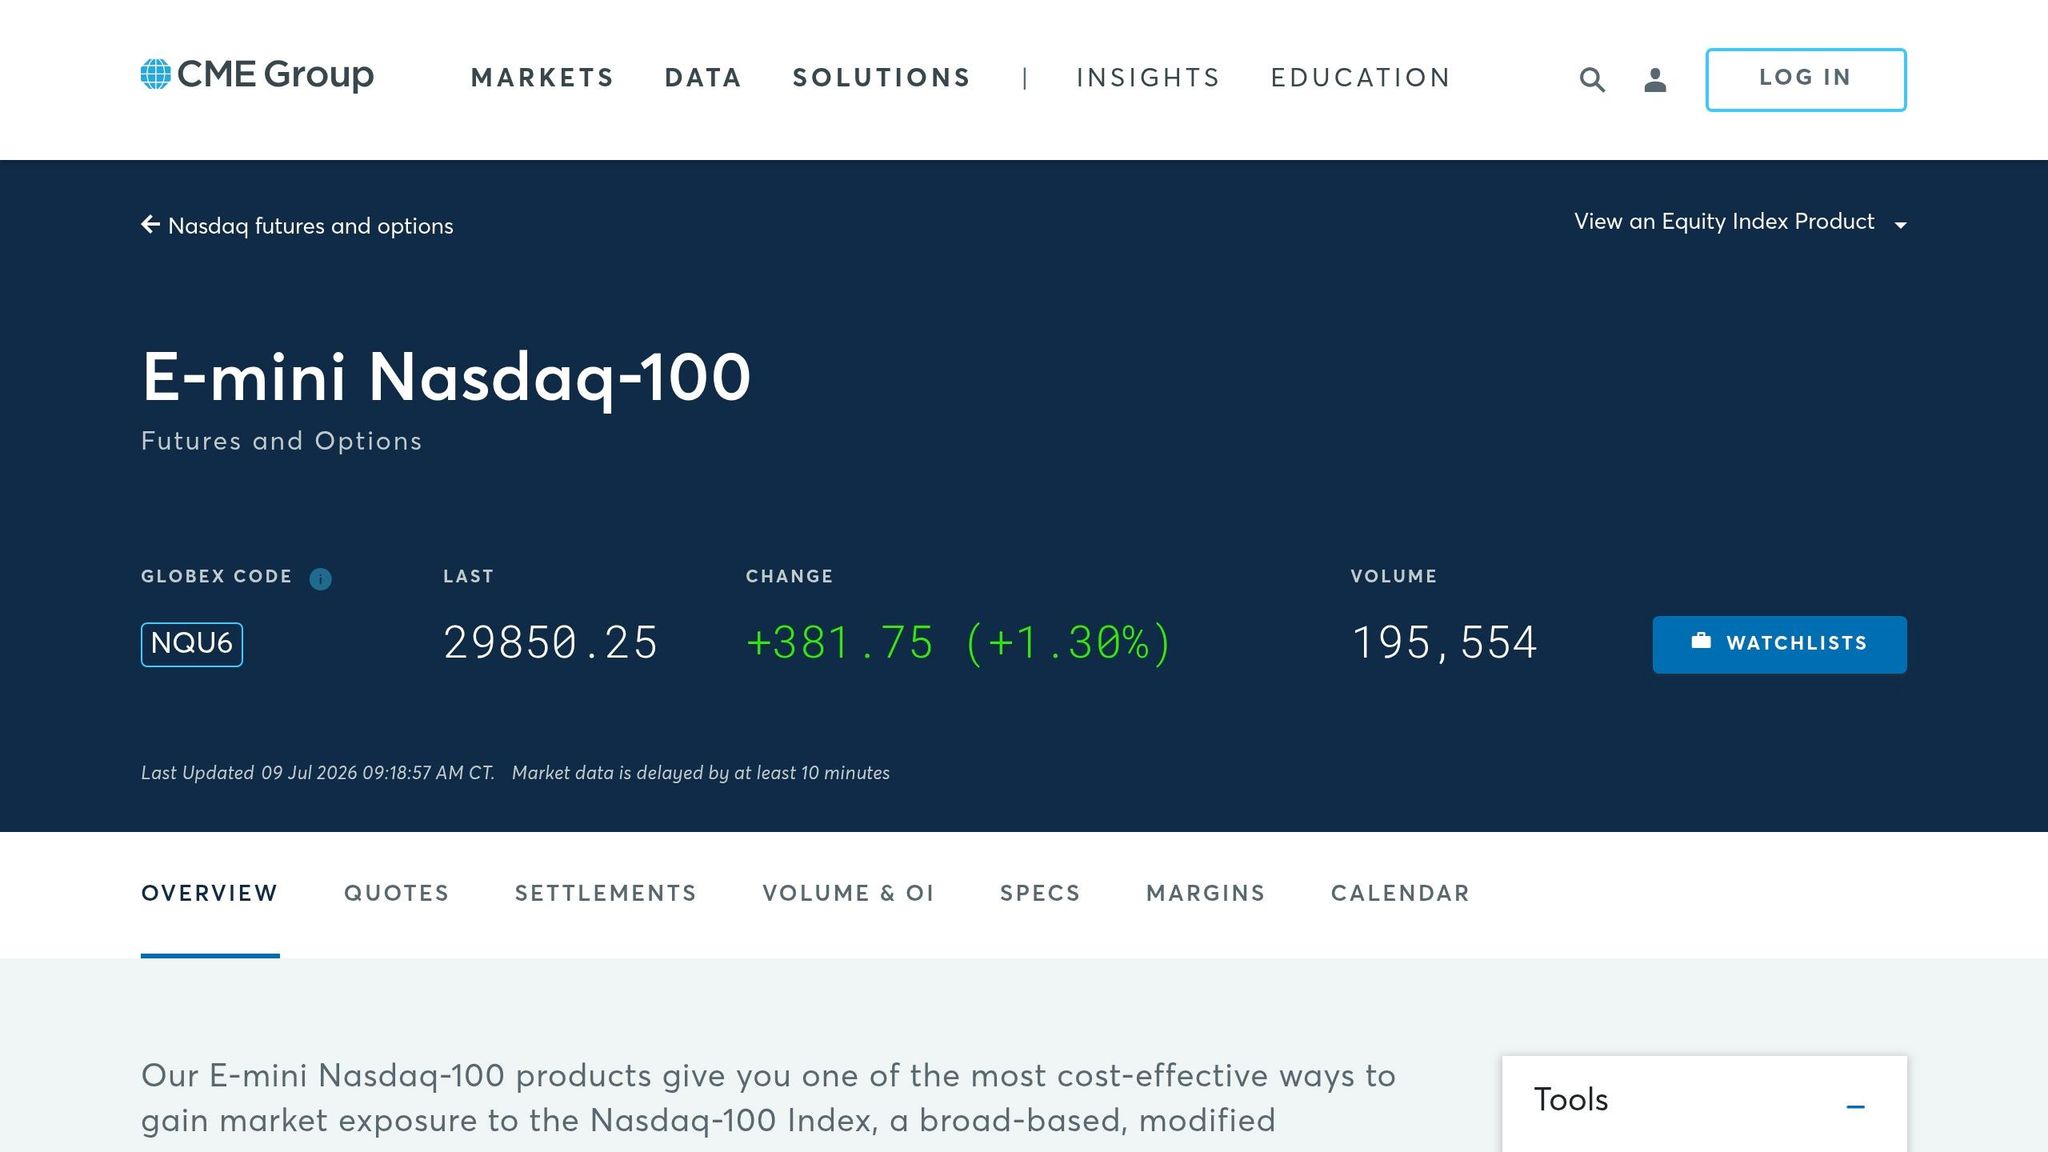
NQ is the CME E-mini Nasdaq-100 futures contract. It tracks the Nasdaq-100 Index, which is made up of the 100 largest non-financial companies listed on Nasdaq [1][5].
NQ Contract Multiplier and Notional Value
NQ has a $20 per index point multiplier. The math is simple:
Notional value = index level × $20
So if NQ is trading at 18,000, one contract controls $360,000 in notional value [1][4].
That number isn’t just contract-spec trivia. It drives everything. Every point the market moves, every stop you place, every win, every hit. It also tells you what each tick and point is worth in dollar terms.
Ticks vs. Points on NQ
On NQ, 1 point equals 1.00 index point. 1 tick equals 0.25 points. Since the contract pays $20 per point, one tick is worth $5.00:
That means 4 ticks = 1 point. Get that wrong and your risk math is off. Fast.
| Move | Ticks | Dollar Value (per contract) |
|---|---|---|
| 0.25 points (1 tick) | 1 | $5.00 |
| 1.00 point | 4 | $20.00 |
| 10.00 points | 40 | $200.00 |
| 50.00 points | 200 | $1,000.00 |
Once you’ve got the contract math down, the next step is turning ticks and points into exact dollar risk.
NQ Tick Size, Tick Value, and Dollar Value Per Point
Minimum Tick Size and Tick Value
NQ moves in 0.25-point increments. That’s one tick [1][6][2]. No weird decimals. No half-tick nonsense. Just 0.25 at a time.
Each tick is worth $5.00 per contract [1][6][2]. Since NQ pays $20.00 per point, a 0.25-point move comes out to $5.00.
What 5, 10, and 20 Ticks Are Worth in Dollars
Here’s the math for some common moves:
| Ticks | Point Equivalent | 1 Contract | 2 Contracts | 5 Contracts |
|---|---|---|---|---|
| 5 | 1.25 points | $25.00 | $50.00 | $125.00 |
| 10 | 2.50 points | $50.00 | $100.00 | $250.00 |
| 20 | 5.00 points | $100.00 | $200.00 | $500.00 |
This is where traders get sloppy. A 20-tick stop is $100.00 per contract. Trade 5 contracts, and that same stop is $500.00. That math needs to be done before you click buy or sell, not after the trade starts going against you.
What a 1-Point Move Is Worth
One full point in NQ equals 4 ticks, so a 1-point move is worth $20.00 per contract [1][6][2].
That’s the base math you need. After that, the next thing that hits your risk is trading hours and margin.
NQ Trading Hours, Margin, and Real Dollar Risk
CME Globex Trading Hours for NQ

The CME Globex session runs Sunday at 6:00 PM ET through Friday at 5:00 PM ET, with a daily maintenance break from 5:00 PM to 6:00 PM ET.[1] For most traders, the session that matters most is Regular Trading Hours (RTH): 9:30 AM to 4:00 PM ET. That’s usually where you get the best liquidity and the cleanest movement, especially right after the open. Then the usual dead zone shows up around midday, and volume often comes back later into the close. That lunch stretch is where a lot of sloppy entries get chopped to pieces.
Those hours aren’t just a schedule on a chart. They change how fast a fixed tick value turns into actual pain.
Exchange Margin vs. Broker or Prop Firm Intraday Margin
When liquidity thins out, margin starts to matter even more. Leverage cuts both ways, and NQ doesn’t mess around. CME margin is roughly $13,000 initial and $12,000 maintenance per contract.[6] That’s the exchange baseline, not what most day traders actually post intraday. A lot of brokers cut that down to around $500 to $2,000 per contract. Sounds cheap until you remember that at 18,000, one NQ contract controls about $360,000 in notional value.[4]
That’s the trap. Small margin requirement. Big exposure.
Prop firms aren’t using margin the same way. Instead, they box you in with position limits and hard drawdown rules. On a $50,000 evaluation, the number on the screen means less than the $2,000 drawdown cap. That cap is your real buffer. Every losing tick chips away at it.
What NQ Specs Mean for Drawdown Control
At $20.00 per point per contract, NQ can eat through a drawdown buffer fast. Against a typical $2,000 drawdown limit, here’s what common moves look like:
| Price Move | Dollar Value (1 NQ Contract) | % of $2,000 Drawdown |
|---|---|---|
| 10 Points | $200.00 | 10% |
| 20 Points | $400.00 | 20% |
| 50 Points | $1,000.00 | 50% |
A 50-point move against one NQ contract burns half your drawdown buffer.[4] That’s not some rare outlier either. During scheduled events like CPI or FOMC, NQ can rip 50 to 100 points in seconds.[1][2] If your fill is bad or your stop isn’t there, an evaluation can be over before you’ve even processed the move.
So size off the drawdown limit, not the account balance. That’s the number that matters. If major news is on deck, stay flat. Build size from the max pain your rules allow, then work out the P&L from there.
With hours and margin on the table, the next piece is turning ticks and points into actual profit and loss.
How to Calculate NQ Profit and Loss
The Basic NQ P&L Formula
Once you know the tick value and point value, NQ P&L is simple. You can calculate it either by points or by ticks. Same result either way.
Point-based: (Exit Price − Entry Price) × $20.00 × Number of Contracts
Tick-based: (Total Ticks Moved) × $5.00 × Number of Contracts
If you’re long, price needs to go up to make money. If you’re short, price needs to go down.
P&L Examples Using 1 and Multiple Contracts
Here’s the math with actual numbers.
A 3-point profit target on 1 NQ contract equals $60.00. That’s 3 × $20.00. If you trade 3 contracts, that same move becomes $180.00.
An 8-point stop loss on 2 contracts means $320.00 at risk. That’s 8 × $20.00 × 2.
Commissions matter too. Round-trip commissions on NQ run about $5.76 per contract.[2][3] On a 3-contract trade, that’s about $17.28 in commissions. Not huge on one trade, but it adds up fast if you’re in and out all session.
Using Tick Math to Size Positions Correctly
This is the part a lot of traders screw up. Start with your dollar risk, then back into contract size.
Max Contracts = Total Dollar Risk ÷ (Stop Loss in Ticks × $5.00)
Example: you want to risk $100 on a trade with a 10-point stop. Since NQ moves in 0.25-point ticks, that stop is 40 ticks.
So the math is:
$100 ÷ (40 × $5.00) = 0.5 contracts
You can’t trade half an NQ contract. So that setup doesn’t work on NQ as-is. Your choices are simple:
- Tighten the stop
- Cut the risk idea
- Use MNQ instead
On MNQ, the same setup works like this:
$100 ÷ (40 × $0.50) = 5 MNQ contracts.[1]
That’s why MNQ exists. Same market. Smaller risk per tick.
If you’re trading a prop eval, don’t size off the headline account balance. Size off the drawdown cap. That’s the number that matters.
On a $50,000 account with a $2,000 drawdown limit, your actual risk capital is $2,000.[4] Not $50,000. Big difference.
When NQ is too chunky for the drawdown cap, MNQ usually makes more sense. You get the same Nasdaq exposure without forcing bad sizing.
NQ vs. Micro NQ (MNQ): Choosing the Right Contract
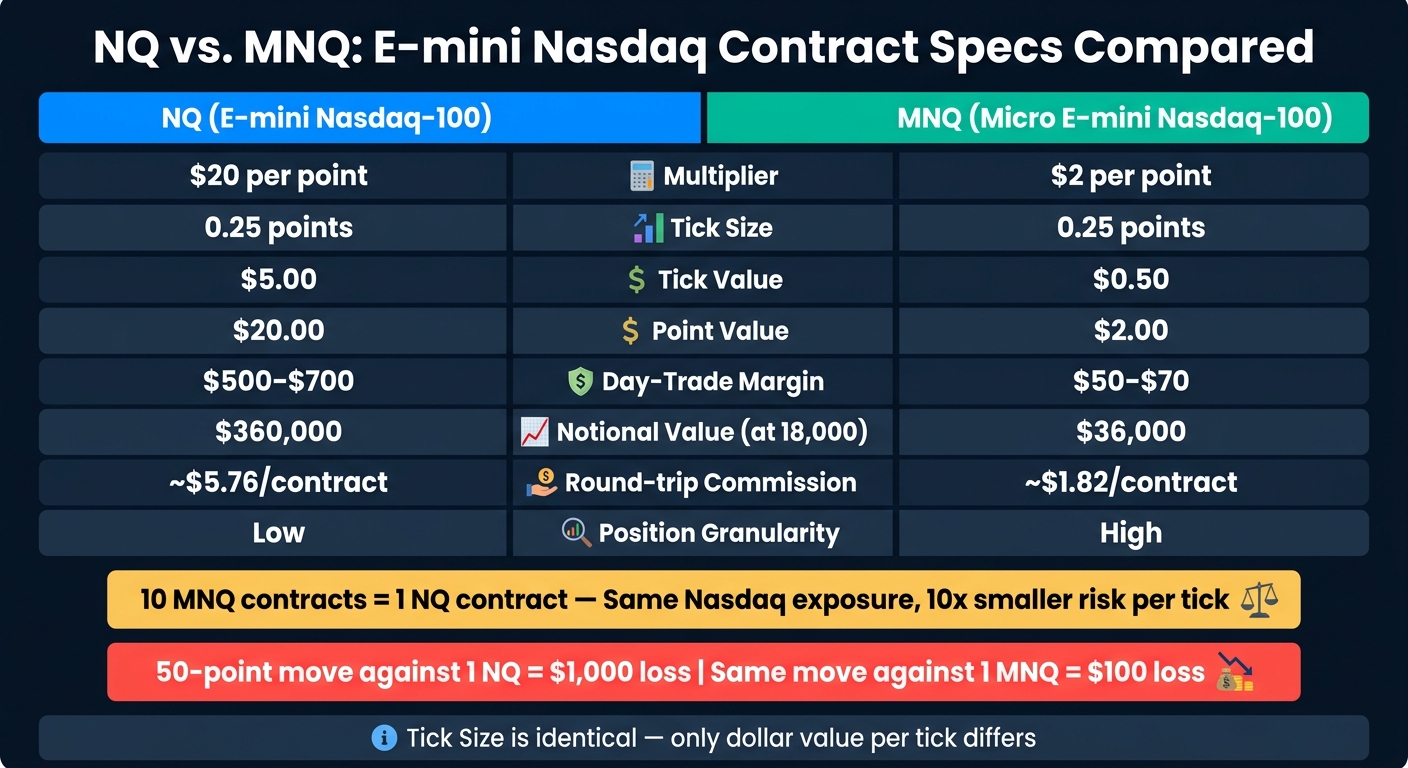
NQ vs. MNQ Contract Specs: Side-by-Side Comparison
If 1 NQ contract blows up your stop size or eats too much of your drawdown, MNQ fixes that. Same market. Same setup. Just less dollar risk.
MNQ Tick Value and Contract Specs
MNQ is one-tenth the size of NQ. It tracks the same index and uses the same 0.25-point tick, but it pays $2 per point and $0.50 per tick [1][6]. That’s the whole point. You get the same trade structure without the bigger dollar swings.
That one change makes MNQ much easier to handle when you’re trading under a tight drawdown cap. And if you’re thinking in exposure, 10 MNQ contracts = 1 NQ contract [7].
NQ vs. MNQ: Side-by-Side Comparison
| Specification | NQ (E-mini) | MNQ (Micro E-mini) |
|---|---|---|
| Multiplier | $20 per point | $2 per point |
| Tick Size | 0.25 points | 0.25 points |
| Tick Value | $5.00 | $0.50 |
| Point Value | $20.00 | $2.00 |
| Day-Trade Margin | $500–$700 | $50–$70 |
| Notional Value (at 18,000) | $360,000 | $36,000 |
| Position Granularity | Low | High |
| Round-trip commission per contract | ~$5.76 | ~$1.82 |
Commission math matters here. If you trade 10 MNQ instead of 1 NQ, you’re paying about $18.20 round trip instead of $5.76. So yeah, micros are cheaper per contract, but more expensive for the same unit of exposure [2].
When to Trade NQ and When to Trade MNQ
For most prop traders, MNQ is the better sizing tool. Plain and simple.
A 50-point move against 1 NQ is a $1,000 loss. On a $2,000 drawdown limit, that’s a nasty hit right away [4]. The same 50-point move against 1 MNQ is only $100 [1][6]. Big difference.
This is where MNQ shines:
- Your stop in NQ feels too chunky
- One contract puts too much pressure on your daily loss or trailing drawdown
- You want tighter control over scaling in and out
Trade NQ when you want fewer contracts on the screen and your account can handle the bigger swings per contract [6]. Until then, stick with MNQ. It gives you more room to size the trade properly without forcing dumb decisions.
With the contract choice clear, the next step is locking in the NQ numbers that matter most for sizing.
Key Takeaways for Futures Prop Traders
The 3 NQ Numbers to Memorize
Once you know the NQ and MNQ specs, this is the part that matters most: risk.
Before you place an NQ trade, burn these three numbers into your head: 0.25 points per tick, $5.00 per tick, and $20.00 per point [2][4]. Those are the numbers that drive everything. Your stop. Your size. Your drawdown math. All of it comes back to those three figures.
If your drawdown cap is $2,000, every single NQ tick counts. Size your trades off the cap, not the account balance. The cap is your real account size. Period.
With a $2,000 drawdown, keep risk at $20 max per trade. That gives you 4 NQ ticks or 40 MNQ ticks [4]. Same idea, same math. If NQ is too big for that limit, use MNQ. It’s the clean fix: same market, same setup, smaller dollar hit per tick.
Related Damn Prop Firms Resources
Use these pages to size trades and compare contract choices faster:
- MNQ contract specs
- Futures position sizing guide
- Drawdown management guide
- Prop firm comparison tool
FAQs
How many NQ ticks are in 1 point?
There are 4 ticks in 1 point for the E-mini Nasdaq-100 (NQ) futures contract.
The minimum tick size is 0.25 points, so 4 ticks = 1 full point. Since NQ pays $20 per point, each 0.25-point tick is worth $5.00.
How do I calculate NQ risk before a trade?
Use this formula:
Risk = (entry price – stop price in points) × $20 × number of contracts
You can also do it in ticks:
Risk = ticks between entry and stop × $5.00 × number of contracts
Quick example: a 10-tick stop on 1 NQ contract means $50.00 at risk.
That math matters. Every time.
Before you place the trade, check two things:
- Your stop distance
- Your contract size
Then stack that against your account’s drawdown limit. If the trade blows through too much room, size down or skip it. Simple.
When should I trade MNQ instead of NQ?
Trade MNQ instead of NQ if you’re newer, working with a smaller account, or you want tighter control over risk. MNQ is one-tenth the size of NQ, so the dollar hit per tick is a lot smaller.
Move to NQ only after you’ve shown steady profits on Micros, can size risk fast without second-guessing, and can handle the bigger swings that come with the standard contract.