Volume and price action are essential tools for traders, providing real-time insights into market behavior. Price reflects market direction, while volume shows the strength and commitment behind it. Together, they help traders confirm trends, identify reversals, and validate breakouts. This guide explains how to use volume and price action effectively, covering:
- Volume Basics: Understand absolute vs. relative volume, common patterns, and how volume reveals market sentiment.
- Price Action Fundamentals: Learn key candlestick patterns, support/resistance zones, and market structure.
- Combining Volume and Price: Discover how volume confirms trends, breakouts, and reversals while spotting divergence signals.
- Tools & Indicators: Explore VWAP, Volume Profile, and advanced tools like footprint charts for deeper market insights.
- Trading Strategies: Apply these concepts to confirm breakouts, find reversals, and improve day trading precision.
Whether you’re trading futures or managing a funded account, mastering these concepts can refine your strategies and help you avoid common pitfalls.
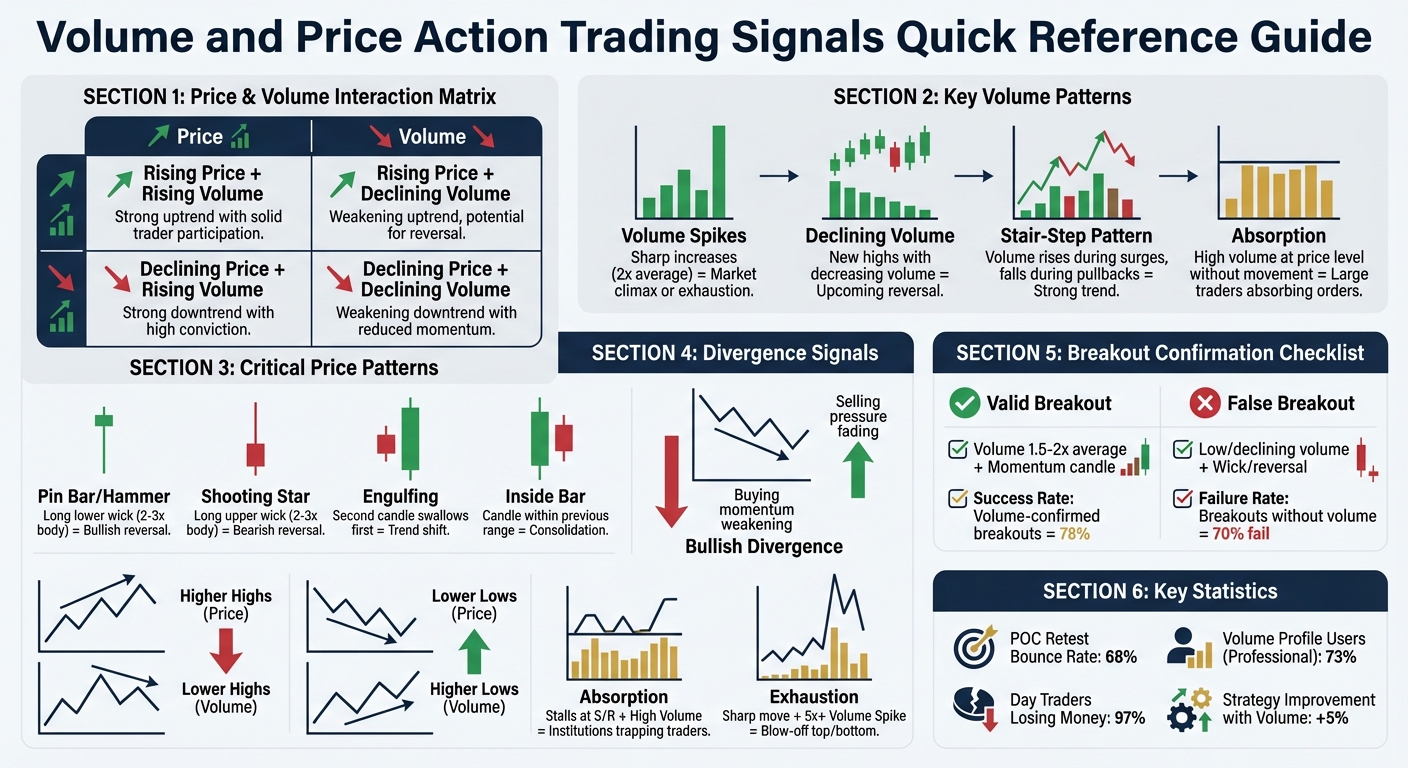
Volume and Price Action Trading Signals Quick Reference Guide
Volume Analysis Basics
What Volume Means in Trading
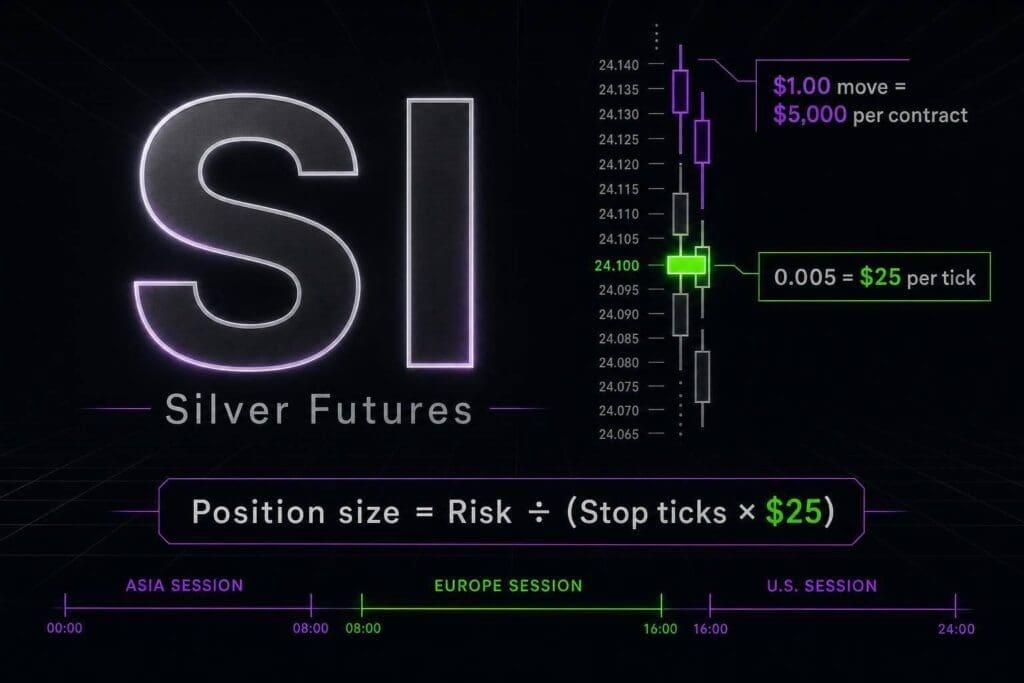
In trading, volume represents the total number of shares or contracts exchanged within a specific time frame [6]. For futures markets like the E-mini S&P 500 or crude oil, this figure reflects the actual contracts traded, not just price fluctuations.
Volume is essentially the driving force behind price movements. For example, a $5 price increase on low volume might indicate a lack of strong market participation. On the other hand, significant volume during a rally or sell-off shows active involvement from traders, while low volume could mean the market is moving without much commitment.
"Price movement is the direction, trading volume is the fuel."
– Cory Mitchell, CMT, Trade That Swing [5]
Traders often distinguish between two types of volume: absolute volume, which is the raw number of shares or contracts traded, and relative volume, which compares current trading activity to a historical average (like a 20- or 30-day moving average). For instance, if the E-mini S&P 500 typically sees 1.8 million contracts traded daily but suddenly jumps to 3.2 million, this surge indicates heightened market activity. Generally, assets trading over 500,000 shares or contracts daily are considered high-volume [6].
Common Volume Patterns
Volume patterns often repeat across markets and timeframes, giving traders insights into market sentiment and potential price moves:
- Volume Spikes: Sharp increases in trading activity – often double the average – can signal the final push of buyers or sellers, potentially marking a market climax or exhaustion [11, 17, 19].
- Declining Volume: When prices hit new highs but volume decreases, it suggests fewer participants are driving the move, which could hint at an upcoming reversal [11, 15].
- Stair-Step Pattern: This occurs when volume rises during price surges and falls during pullbacks, supporting a strong and steady trend [13].
- Absorption: High volume at a specific price level without further price movement suggests that large traders may be absorbing orders. For example, if a futures contract rallies into a resistance zone with significant volume but stalls, it could indicate absorption [1].
Here’s a quick summary of how price and volume interact:
| Price Movement | Volume Movement | Market Implication |
|---|---|---|
| Rising | Rising | Strong uptrend with solid trader participation [10] |
| Rising | Declining | Weakening uptrend, potential for reversal [10] |
| Declining | Rising | Strong downtrend with high conviction [10] |
| Declining | Declining | Weakening downtrend with reduced momentum [10] |
In extreme cases, such as at major market tops or bottoms, volume can spike to 5× or even 20× the average. For example, a backtest of the "Turnaround Tuesday" strategy on the SPY ETF revealed that when Monday’s volume exceeded the 25-day average, the average gain was 0.81%, compared to just 0.41% on low-volume days [11].
How Volume Shows Market Sentiment
Volume is a window into market emotion. High volume during a sell-off often reflects fear or panic as traders rush to exit positions, while high volume during a breakout indicates confidence or greed [6].
"Volume shows the conviction of the participants. Volume tells us what people want and how much or little they want it. Volume creates opportunity." For those focusing on day trading, understanding these shifts in conviction is essential for timing entries.
– Ross Cameron, Warrior Trading [1]
This insight is critical for traders using the best futures prop firms, who depend on liquidity and market participation to execute trades efficiently. A breakout on low volume might be a false signal, while a breakout on high volume suggests widespread agreement on the price move’s validity [11, 19].
Volume analysis also enhances mean reversion strategies. For example, backtests using the IBS indicator show that high-volume days tend to yield average gains of 0.69%, compared to 0.56% on lower-volume days [11]. Additionally, in centralized futures markets like those run by the CME, volume data is often more reliable and actionable than in decentralized markets such as Forex [12].
These volume insights set the stage for the price action strategies covered in the next sections, showing how traders can combine volume and price data to make more informed decisions.
sbb-itb-46ae61d
Price Action Fundamentals
Price Action Basics
Price action trading is all about focusing on raw price movements, steering clear of lagging indicators [15][3]. Traders rely on tools like candlestick patterns, support and resistance zones, and trendlines to make decisions grounded in the present market dynamics.
"Price action is the territory on which indicators draw various maps." – Optimus Futures [3]
Candlestick charts are a powerful way to visualize market behavior. They display the open, high, low, and close values for a given time frame [7][18]. The body of the candlestick reveals whether buyers or sellers dominated during that period, while the wicks (or shadows) highlight price rejection – moments where one side tried to take control but ultimately failed [7][18].
Interestingly, candlestick charts trace their origins back to 17th-century Japan, pioneered by rice trader Munehisa Homma [3]. Today, traders use them to pinpoint support and resistance zones – areas where buying or selling pressure consistently emerges [16][8]. It’s crucial to view these as zones rather than precise levels, reflecting the natural variability of the market [16][8].
This foundational understanding of price behavior sets the stage for spotting reliable patterns.
Important Price Patterns
Once the basics are in place, traders look for specific patterns to predict potential reversals or continuations in price movement.
- Pin Bars (also known as Hammers or Shooting Stars): These candles have a small body and a long wick that’s at least 2 to 3 times the size of the body [8]. A Hammer with a long lower wick suggests bullish rejection after a downtrend, while a Shooting Star with a long upper wick signals bearish rejection after an uptrend [7]. These patterns often mark potential turning points.
- Engulfing Patterns: This involves two candles, where the second completely "engulfs" the body of the first candle. A bullish engulfing at support shows buyers taking control, while a bearish engulfing at resistance signals sellers gaining the upper hand [7].
- Inside Bars: These occur when a candle is entirely contained within the range of its predecessor, signaling consolidation or a pause before the next move [7]. They’re often used as continuation signals in trending markets.
- Momentum Candles: These candles have bodies at least twice as large as the average of the previous three to five candles, signaling the start of significant price moves [7].
| Pattern | Signal | Key Characteristic |
|---|---|---|
| Pin Bar / Hammer | Bullish Reversal | Long lower wick (2-3x body), small body |
| Shooting Star | Bearish Reversal | Long upper wick (2-3x body), small body |
| Engulfing | Trend Shift | Second candle body swallows the first |
| Inside Bar | Consolidation | Candle entirely within previous bar’s range |
Reading Price in Market Context
The context in which a price pattern appears determines whether it’s worth acting on [7][16]. For example, a pin bar at a major support level after a downtrend can be a strong trade signal. However, the same pin bar without proper context may not hold much weight. This is where the distinction between price action (the immediate, detailed view) and market structure (the broader, historical view of trends, zones, and patterns) becomes critical [7].
"Market structure helps you find WHERE to look… Price action tells you WHAT to do when you get there." – Mind Math Money [7]
Understanding market phases is another key piece of the puzzle. An uptrend is characterized by rising swing highs and lows, while a downtrend shows falling swing highs and lows [16][17]. Consolidation, on the other hand, occurs when the price moves sideways, trapped between horizontal support and resistance levels, often building up energy for a breakout [17].
To get started, identify critical levels on the daily chart – this is where the most reliable support and resistance zones are found [16]. Then, shift to smaller timeframes like the 1-hour or 5-minute chart to pinpoint specific entry opportunities. Always wait for candles to close before making a move; a pin bar can transform into a momentum candle by the end of the period [16][8]. This approach minimizes false signals and ensures you’re trading based on confirmed price behavior.
For a deeper understanding of market dynamics, combining price action with volume analysis can provide additional clarity.
Volume & Price Action: Your Ultimate Guide
How Volume and Price Work Together
Price shows the market’s direction, while volume reveals the strength behind that move. When these two align, they confirm trends with clarity. But when they diverge, it may signal a lack of conviction or even a possible reversal.
"Price tells you what the market is doing – volume tells you how serious it is." – Justin Trading
Big market moves need strong participation. For example, a price rally with increasing volume suggests genuine interest, often from institutional players, also known as the "smart money." On the other hand, if a price move happens on declining volume, it might lack strength and could fizzle out. This interplay between price and volume is key to understanding breakouts, divergences, and support or resistance levels.
| Price Action | Volume Action | Market Signal |
|---|---|---|
| Rising | Increasing | Strong bullish momentum – trend confirmed |
| Rising | Decreasing | Weak demand – possible bearish divergence |
| Falling | Increasing | Strong bearish momentum – trend confirmed |
| Falling | Decreasing | Weak supply – potential bottoming |
| Breakout | High (greater than 1.5× average) | Likely to sustain |
| Breakout | Low or declining | Fakeout – prone to failure |
Using Volume to Confirm Breakouts
In forex trading, breakouts fail about 70% of the time [9]. That’s why volume confirmation is so important. A valid breakout needs a volume spike – at least 1.5 to 2 times the recent average [9]. This signals fresh participation and increases the chances of the move holding. Without this volume boost, the breakout might lack conviction and could reverse back into its range.
Take Fennec Pharmaceuticals Inc. (FENC) as an example. The stock consolidated twice with very low volume before breaking to new highs on a volume surge. This pattern of quiet consolidation followed by a high-volume breakout is a textbook sign of institutional involvement.
"Technical analysis without volume is like watching a movie with the sound off – you see the action but miss the emotional intensity." – EPlanet Brokers
During periods of consolidation, low volume builds tension as traders wait for a trigger. When volume surges, it signals the market is ready for a decisive move. For day traders, tools like the Volume Weighted Average Price (VWAP) act as dynamic support and resistance levels. A break above VWAP on rising volume often indicates institutional backing, a strong sign for the trade.
When price moves without volume support, it can also warn of a potential reversal, which brings us to the next concept.
Volume Divergence Signals
Divergence happens when price and volume head in opposite directions, hinting that a trend may be losing steam. For instance, if price hits a new high but volume doesn’t match the previous peak, it suggests fewer participants are driving the move – a warning sign of a potential reversal.
In a healthy uptrend, volume typically rises during rallies and falls during pullbacks. If price continues to climb while volume drops, it might mean buying interest is fading. Traders often tighten stop losses or prepare to exit in such scenarios.
"Volume normally leads to price during a bull move. A new high in price that is not confirmed by volume should be regarded as a red flag." – CFI Experts
Indicators like On-Balance Volume (OBV) can highlight these divergences. For example, if price forms a higher high but OBV creates a lower high, it suggests growing selling pressure. Additionally, extreme volume spikes – 500% or more above the average [13] – often precede sharp reversals. For instance, in 2018, the Alternative Harvest ETF (MJ) hit a peak at 32 times its average volume [5], marking a major reversal. Similarly, during the 2020 COVID-19 crash, the S&P 500 ETF (SPY) surged to 6.5 times its average volume [5], signaling a critical turning point.
High-Volume Bars at Support and Resistance
High-volume bars not only confirm price moves but also establish lasting support and resistance levels. When heavy trading happens at a specific price, it leaves a "footprint" that the market tends to respect. For instance, a surge in buying volume can create strong resistance, while a spike in selling volume may establish solid support.
One pattern to watch for is "stopping volume." This occurs when price drops but encounters a sharp volume spike paired with a narrow candle spread. It indicates that professional traders are stepping in to absorb the supply, potentially halting further declines. A historical example is Honeywell (HON): after a high-volume down candle with a narrow spread, a hammer candle on strong volume followed, leading to a reversal and a price increase to $76.08 three months later [20].
The Volume Profile tool can also help identify "High Volume Nodes" (HVNs) – price levels with significant trading activity. These zones often act as magnets, pulling price toward them. If price approaches an HVN, it may either bounce strongly or, if broken, move quickly to the next key volume area.
For futures traders using leverage, understanding these dynamics is essential, especially when evaluating futures prop firm reviews and guides to find the right capital partner. By focusing on trades supported by strong volume, traders can avoid low-probability setups and increase their chances of consistent success.
Tools and Indicators for Volume and Price Action
Understanding volume and price interaction is just the beginning. Next, explore the tools that uncover institutional activity and pinpoint critical price levels.
VWAP and Anchored VWAP
The Volume Weighted Average Price (VWAP) calculates the average price paid per contract, weighted by volume. It resets daily and acts as a "fair value" benchmark. When prices trade above the VWAP, buyers generally have the upper hand; below it, sellers take control. Institutional traders often rely on VWAP to guide large order execution.
Anchored VWAP (AVP), on the other hand, ties the calculation to a specific event – like a breakout candle, earnings announcement, or trend reversal. This allows traders to assess whether a price move has strong volume backing. For instance, if prices rise but the anchored VWAP remains flat or lags, it signals weak volume support [24].
VWAP strategies often involve mean reversion: buying below and selling above it. In trending markets, a retest of the VWAP line can provide a lower-risk entry in the trend’s direction [23]. Pairing volume indicators with price action has been shown to improve strategy success rates by about 5% [23].
Now, let’s dive into the differences between Volume Profile and price action and how the former maps trading activity across price levels.
Volume Profile and Volume at Price
Unlike traditional volume indicators that focus on time, Volume Profile highlights where trading activity occurred across price levels [21]. The Point of Control (POC) marks the price level with the highest traded volume, often acting as a magnet where price tends to return or react [21].
"Volume profile is like having x-ray vision into the market. While regular volume indicators show you when trades happened, volume profile shows you where the actual trading occurred." – Trading In Depth [21]
The Value Area (VA) represents the price range where 70% of the session’s volume occurred, with boundaries at the Value Area High (VAH) and Value Area Low (VAL) [21][22]. These levels frequently serve as intraday support and resistance. Notably, around 73% of professional traders use Volume Profile daily [21], and retests of the POC result in a temporary bounce 68% of the time [25].
High Volume Nodes (HVN) indicate areas of strong support or resistance due to institutional activity, while Low Volume Nodes (LVN) highlight zones of low liquidity where prices can move swiftly [21][24][25]. When prices enter an LVN, rapid movement often continues until they reach the next HVN.
In December 2023, Bitcoin traders spotted a "Stacked POC Confluence" where the Daily POC ($42,350), Weekly POC ($42,280), and Monthly POC ($42,400) aligned. When the price pulled back from $44,000 to test this $42,300 cluster, it held as reinforced support, sparking a rally to $48,500 – a $6,200 gain per coin [25].
| Tool | Focus | Best Use Case |
|---|---|---|
| Regular Volume | Time-based (When) | Momentum confirmation [21] |
| Volume Profile | Price-based (Where) | Identifying support/resistance and fair value [21] |
| VWAP | Average Price | Tracking intraday trends and value [23] |
| Footprint/Ladder | Order Flow (Who) | Pinpointing absorption and precise entries [1] |
Armed with these tools, advanced indicators can further refine your understanding of volume dynamics.
Volume Dots and Trade Clusters
Building on foundational tools like VWAP and Volume Profile, advanced indicators such as Volume Dots offer deeper insights into order flow. Platforms with Volume Imprint or Footprint Charts break down volume within a single candle, showing bid and ask activity at each price level. This helps traders understand the tug-of-war between buyers and sellers [1].
A key metric here is Delta, which measures the difference between buying and selling volume. When Delta flips at the VAH or VAL, the chance of a reversal jumps to 81% [25].
Absorption occurs when significant volume fails to move the price further, signaling a large player absorbing supply or demand. For example, if a red box shows bid absorption at a support level, coupled with heavy volume but minimal price movement, it suggests sellers are running out of steam [1].
Imbalances highlight situations where aggressive buying or selling outweighs the opposing side by 150% to 300% [1]. These imbalances often trigger rapid price moves, helping traders time their entries more precisely – especially in fast-paced futures markets.
Tools like NinjaTrader Order Flow+ ($59/month) and Sierra Chart Level 5 ($36/month) offer these advanced features [22][25]. While they require some learning, they provide insights that can greatly improve trade timing and decision-making.
Trading Strategies Using Volume and Price Action
Once you’ve got the right tools, it’s time to use them for precise trade entries and managing risk. By combining volume and price action, traders can build a solid framework for confident decision-making.
Confirming Breakouts with Volume
Breakouts without volume often fail to follow through – volume is what drives the move forward [2][5].
When the price breaks through a key resistance or support level, take a close look at the volume bar. A valid breakout typically shows a volume spike that exceeds the 20-period moving average by at least 25% to 30% [28]. In highly volatile futures markets, traders often look for volume that’s 2x to 3x the average to confirm the breakout [28].
Momentum candles can also indicate conviction. A strong momentum candle will have a body at least twice the size of the previous 3–5 candles and close decisively beyond the key level. On the other hand, if the candle closes with a wick or reverses, it might signal a false breakout [7].
Before a breakout, watch for signs of "coiling." This happens when volume dries up during sideways consolidation near a key level. A sudden surge in volume after this quiet period often signals an imminent breakout [2][5].
On footprint charts, stacked imbalances – three or more consecutive price levels where buying volume is 3x to 4x higher than selling volume – indicate strong institutional buying [19]. Breakouts confirmed by volume in trending markets have a success rate of up to 78% [4].
"Price movement is the direction, trading volume is the fuel. Volume tells us how much or little fuel is driving a price move." – Cory Mitchell, CMT [5]
This strategy highlights how volume strengthens price action analysis, offering a more complete approach. Volume-confirmed breakouts are also a stepping stone for spotting trend reversals.
Finding Reversals Through Divergence
Reversals often come with early warning signs. One key signal is volume divergence – when price and volume move in opposite directions, it suggests the trend may be weakening [13][27].
- Bearish divergence happens when the price makes a higher high, but volume prints a lower high. This indicates that fewer buyers are supporting the move, signaling a weakening uptrend [26][28].
- Bullish divergence occurs when the price makes lower lows, but volume shows higher lows. This suggests that selling pressure is fading, even as prices drop [28].
Another powerful reversal signal is absorption. This happens when heavy volume hits a specific price level, like a session high or resistance, but the price fails to move further. This indicates that institutions are absorbing aggressive market orders, creating a liquidity trap [1][19]. Footprint charts can help identify these areas of absorption.
Climax volume is another clue. A sudden spike of 5x the average volume after an extended trend often signals a blow-off top or bottom. At this point, the last participants have entered the market, leaving no fuel for the trend to continue [26][28].
| Signal Type | Price Action | Volume Action | Market Sentiment |
|---|---|---|---|
| Bullish Divergence | Lower Lows | Higher Lows | Selling pressure is fading; buyers may step in [28] |
| Bearish Divergence | Higher Highs | Lower Highs | Buying momentum is weakening; trend may reverse [27][28] |
| Absorption | Stalls at S/R | High/Spiking Volume | Institutions are trapping aggressive traders [19] |
| Exhaustion | Sharp move/climax | Extreme Spike (5x+) | Trend may have reached a blow-off top/bottom [19][28] |
Always wait for confirmation before trading reversals. For instance, look for the price to retest a level or fail to continue its move [19]. These signals can help traders avoid entering trades against a trend that’s losing strength.
Day Trading with Volume
Day traders can refine their entries by combining volume and price action. When trading intraday futures or working with a Forex prop firm, precision is critical. Volume signals help identify strong setups and avoid common traps.
Start by using VWAP (Volume Weighted Average Price) as a directional filter. Focus on long trades when the price is above VWAP and short trades when it’s below [5]. If the price pulls back to VWAP with declining volume, it often provides a lower-risk entry in the direction of the trend.
Relative volume (RVOL) is another useful tool. By comparing current volume to the average for that time of day, traders can spot spikes that indicate institutional activity [14]. A sharp increase in RVOL at a key level often signals strong participation.
Watch for absorption signals – when high volume hits a level but the price doesn’t move further. This suggests institutions are defending the level, which could lead to a reversal [19].
Delta divergence is another key indicator. If the price makes a new high but cumulative delta (net buying/selling pressure) remains flat or declines, the trend may be running out of steam [19].
"Volume acts like a lie detector for price. It shows you whether a price move is backed by real commitment or just a weak push." – Justin Trading [2]
Unfinished auctions – thin tails at session highs or lows with minimal volume – serve as price magnets. The market often revisits these levels to "finish business", making them valuable targets for day traders [19].
To maximize success, combine these volume-based signals with critical structural levels like support, resistance, or high-volume nodes on a Volume Profile. Keep in mind that a candlestick pattern only holds weight when it appears at a significant level [7].
Examples from Futures Trading
Building on the core ideas of volume and price action, these real-world examples show how specific signals can hint at major market shifts.
Take December 2021, for instance. The E-mini S&P 500 futures (ES) gave off a bearish signal when the On-Balance Volume (OBV) 20-period and 75-period simple moving averages (SMAs) crossed downward, while the price stayed below VWAP. The result? A steep 27% drop [29]. Traders who spotted this volume divergence had the chance to sidestep losses or even profit by going short.
Fast forward to December 2022: the same ES futures showed a bullish crossover of the OBV 20-period and 75-period SMAs, paired with a closing price above VWAP. What followed was a rally that delivered a 22% trough-to-peak gain [29]. These opposing monthly trends laid the groundwork for the more nuanced intraday action seen in later sessions.
A recent example unfolded from September 22 to September 24, 2025, on the S&P 500 E-mini futures (ES1!) using a 30-minute chart. On September 22, a midday breakout was confirmed by a surge in volume bars and a rising OBV. But just two days later, on September 24, the market reversed sharply, marked by heavy selling volume and a dramatic OBV drop. This sequence highlighted absorption followed by a sharp reversal [30]. Paying attention to volume exhaustion at key levels could have helped traders exit positions in time or even pivot to short trades.
These examples emphasize why the S&P 500 E-mini and Micro E-mini are go-to benchmarks for volume analysis in futures trading. With significant institutional activity, they often create strong price magnets at the Point of Control (POC). In fact, about 68% of POC retests lead to at least a temporary price bounce [25]. Combining volume profile structures with real-time volume spikes provides traders with actionable insights to refine their entry and exit strategies.
Volume and Price Action for Prop Traders
Growing Funded Accounts with Volume and Price
Prop traders operate under strict risk management rules – think daily loss limits, maximum drawdowns, and consistency targets. A single misstep can cost you your funded account. That’s why leveraging volume and price action is a game-changer. It not only helps you stick to those tight risk limits but also improves your ability to fine-tune trade entries and exits.
Volume acts as a critical safety net, helping you avoid false breakouts. For example, relying on volume confirmation – typically 1.5× to 2× the recent average – can save you from setups designed to trigger stop-loss hunting. This kind of discipline is essential for protecting your account from unnecessary losses.
Consistency rules add another layer of complexity. Strategies like the stair-step approach – where rising volume accompanies higher highs and falling volume signals pullbacks – can identify sustainable trends. These trends are ideal for scaling into positions while staying within the risk parameters set by prop firms [13].
Additionally, high-volume bars at key support and resistance levels often signal institutional activity. These areas can offer high-probability reversal points, letting you trade with tighter risk. This aligns perfectly with the requirements of most prop trading firms [20].
Finding the Right Prop Firm with DamnPropFirms
Choosing the right prop firm is just as important as mastering your trading strategies. DamnPropFirms provides a platform to compare top-rated futures prop firms, many of which are designed to complement volume-based trading approaches.
For example:
- Topstep: Known for its strict consistency targets, this firm rewards traders who focus on steady, systematic gains.
- Tradeify and Lucid Trading: If you’re eager to start trading immediately, these firms skip the lengthy evaluation phase and offer instant funding.
- Apex Trader Funding: Popular for its competitive scaling rules and straightforward payout structures.
Other notable options include Take Profit Trader, FundedNext Futures, and Alpha Futures. Each of these firms offers features tailored to traders who rely on volume and price action strategies.
To make the decision easier, DamnPropFirms offers verified reviews, exclusive discounts, and tools like the Consistency Rule Calculator. This ensures your volume-driven profits align with the payout rules of your chosen firm. Plus, you can join their Discord community of over 3,000 traders to exchange real-time insights and strategies tailored to specific firms.
Conclusion
Understanding volume and price action is a game-changer for interpreting the markets. Price tells you what is happening, while volume reveals the strength behind the move. As Justin Trading emphasizes, this combination is essential for spotting genuine market activity versus temporary noise [2]. Together, they work like a "lie detector", exposing true institutional involvement and filtering out weak retail-driven moves that often fizzle out.
Consider this: 97% of active day traders lose money over time, and over 90% of day trading volume comes from traders who consistently underperform [14]. Why? Many fail to grasp the connection between volume and price. A price move on low volume often lacks conviction and is prone to reversal. On the other hand, high volume at critical support or resistance levels signals institutional activity – offering high-probability setups.
For prop traders, these insights are invaluable. Volume confirmation not only helps avoid false breakouts but also protects funded accounts from unnecessary losses [9]. Spotting "smart money" activity through volume analysis can make the difference between hitting consistency targets and scaling your account or falling short.
Platforms like DamnPropFirms simplify the journey by pairing your volume-based strategies with the right prop firms. Whether you’re looking for instant funding through Tradeify or Lucid Trading, or prefer the structured growth offered by Apex Trader Funding and Topstep, the platform’s verified reviews and tools, like the Consistency Rule Calculator, ensure your strategy aligns with firm payout structures. Plus, with a Discord community of over 3,000 traders sharing live insights, you’ll always have support while navigating the markets.
FAQs
What’s the simplest way to use volume to confirm a breakout?
To verify a breakout, pay attention to a noticeable spike in trading volume at the breakout level. When volume increases significantly, it signals strong market participation, which helps confirm that the breakout is legitimate rather than a false move. This surge in activity reflects support from active traders, adding confidence to the trend’s reliability.
How can I tell the difference between absorption and a normal pause?
The main distinction comes down to volume activity and order flow dynamics. Absorption occurs when there’s a surge in volume but little to no price movement. This often suggests that large traders are stepping in to absorb incoming orders, which could hint at either a reversal or a continuation of the trend. On the other hand, a normal pause usually features lower volume with balanced order flow, indicating a brief period of consolidation or market indecision. Understanding these patterns can give traders a clearer sense of the market’s next move.
Which should I learn first: VWAP or Volume Profile?
For beginners, VWAP (Volume Weighted Average Price) is often the go-to tool. It’s straightforward and highlights the average price where the majority of trading happened during a session. This makes it a great reference point for identifying fair value and gauging institutional trading activity.
On the other hand, Volume Profile provides a more detailed view but demands a solid understanding of market structure. Starting with VWAP helps lay the groundwork, making it easier to transition to using Volume Profile effectively later on.