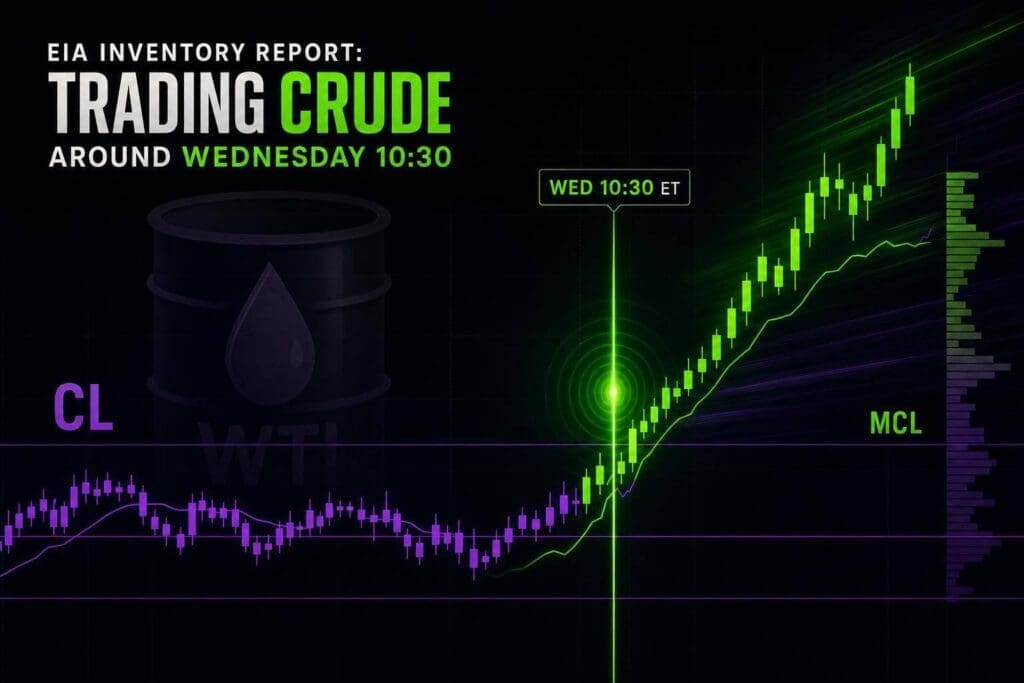
Trade the reaction, not the first headline pop. That’s the short version. Around 10:30 a.m. ET on Wednesdays, crude can move hard on the EIA print, but the first burst is often sloppy, spread-out, and full of traps. If you trade CL or MCL, the edge is simple: know the estimate before the release, map your levels early, and let order flow confirm the move before you hit anything. I’m going to keep this tight and focus on what matters most: what moves price first, what to watch in the first minute, and how to keep slippage from blowing up a good idea.
WTI Crude Oil futures lower on larger-than-expected inventory build. 2/5/25
sbb-itb-46ae61d
What Is the EIA Inventory Report?
The EIA’s Weekly Petroleum Status Report is the official weekly snapshot of U.S. crude, fuel stocks, and refinery activity. If you trade CL or MCL, this is one of the reports that can move price right away.
What the Weekly Petroleum Status Report Covers
These are the fields crude traders watch first:
| Data Point | Why CL/MCL Traders Watch It |
|---|---|
| Commercial Crude Inventories | Main read on oversupply or undersupply in the U.S. market |
| Cushing, OK Stocks | WTI delivery hub inventory; closely watched by traders [1] |
| Gasoline Inventories | Shows consumer demand; a big draw can take some of the sting out of a bearish crude build |
| Distillate Inventories | Tracks diesel and heating oil demand from industry and transport |
| Refinery Utilization | Shows how much crude is being turned into products |
The crude number usually drives the first move, even when gasoline or distillates go the other way. If crude builds but gasoline posts a big draw, that can calm down what would otherwise look flat-out bearish.
That’s why the market doesn’t always react to the headline in a simple way. Traders aren’t just looking at one line. They’re weighing crude, products, and refinery data all at once.
Why the Release Time Matters
The 10:30 a.m. ET release hits when traders have to make snap decisions before the market fully sorts out the details. That’s part of why the first move can be violent.
The API drops its own inventory survey on Tuesday evenings, so the market gets an early read. But API is a private estimate. EIA is the official print. When the two numbers are far apart, you can get fast repricing as soon as the EIA report lands [1].
The timing matters because it drops in the middle of the week and forces the market to reprice fast.
Why Crude Moves So Hard After the EIA Number
The EIA release hits a thin market, so CL can reprice in seconds. If the number comes in way off expectations and the first wave of liquidity is weak, price can rip fast. That’s why the order book matters just as much as the headline itself.
Inventory Surprise vs. Market Expectations
The part that moves price isn’t the raw inventory print by itself. It’s the gap between the print and what the market expected. A bigger-than-expected build is usually bearish. A bigger-than-expected draw is usually bullish.
Still, crude doesn’t always react in a clean, one-line way. Traders are reading crude, gasoline, and distillates together, and that can muddy the first move.
| Inventory Category | Larger-Than-Expected Build | Larger-Than-Expected Draw |
|---|---|---|
| Crude Oil | Typically bearish (prices fall) | Typically bullish (prices rise) |
| Gasoline | Usually bearish | Usually bullish |
| Distillates | Usually bearish | Usually bullish |
Once the print hits, the next problem is liquidity. If the book gets thin right at release, price can jump before most traders even process the full report. In practice, the crude number usually drives the first move, even when the product data leans the other way.
What Happens to Liquidity, Spreads, and Slippage at Release
In the seconds before 10:30 a.m. ET, liquidity often thins out. The first push is usually driven by algos, stop runs, and traders ripping headlines as fast as they can. On the DOM, that often shows up as:
- wider spreads
- a thinner book
- stops getting hit fast
That mix increases slippage risk fast.
Slippage is usually worst in the first 10 to 30 seconds after the release. The move is so quick that you can’t be setting things up at 10:29:59. Your calendar, key levels, and position size need to be ready before 10:30.
How to Prepare Before 10:30 a.m. ET
Use the minutes before 10:30 a.m. ET to make your decisions before the number drops. By the time the EIA print hits, you should already know the calendar, the contract, the levels, and how you plan to enter. The whole point is simple: remove every choice except whether the trade is there.
Confirm the Calendar, Expectations, and Your Contract
Holiday weeks can push the release to Thursday, so check the schedule before you do anything. Then look at Tuesday’s API report. Traders use it as an early read on the EIA print. That’s all it is. A rough setup, not a prediction.
After that, lock in your contract. CL is the standard crude oil futures contract, and the dollar-per-tick hit is bigger. MCL is one-tenth the size, which gives you tighter control over dollar risk. Pick one now. Don’t leave that decision for 10:30 a.m.
Mark Key Levels Before the Report
Mark the overnight high and low, the prior-day high and low, and the prior value area. Those spots often hold stop clusters from traders stuck on the wrong side. You should also mark the levels created by Tuesday’s API reaction.
If Wednesday’s EIA backs up the API trend, price often keeps moving from those areas. If the EIA goes against the API, those same levels can turn into the reversal zone. That’s why they matter. The first EIA move often runs straight into them.
Decide Before the Report Whether You Are Trading the Spike or the Reaction
This is where a lot of traders screw up. They don’t decide until the market is already moving.
- Trading the spike means entering in the first 30 seconds on the first burst. It’s faster, riskier, and leans hard on DOM reading and order flow.
- Waiting for the reaction means letting that first move settle, then getting involved only if price holds above or below a key level.
Neither one is wrong. But you need to choose before 10:30. Set your max dollar risk, your order type, and your size ahead of time. Then stick to it. Once the report hits, planning is over. From there, it’s all about order-flow confirmation.
What to Watch During the Release
At 10:30:00 a.m. ET, the job changes. You’re not planning anymore. You’re reading the tape.
If your plan was to hit the spike, start with the DOM. If your plan was to trade the reaction, sit on your hands for a bit and wait for the footprint and value acceptance to tell the story.
Reading the DOM When the Number Drops
Right after the release, watch what happens to liquidity. Does size stay stacked, or does it get yanked the second the number hits?
A real move usually shows aggressive buying or selling with follow-through. It keeps pushing. It doesn’t just blip and stall.
A reversal setup often looks different. You may see absorption instead. That’s when big resting size takes the hit from aggressive orders, but price still can’t break. That’s a clue the move might be running out of gas.
Don’t smash market orders while the spread is still blown out. Wait for it to settle. If the spread stays wide even a few seconds after the release, you’re still in fake-out territory.
Using Footprint and Volume Profile to Confirm the Move
Once the first burst cools off, footprint and volume profile give you a cleaner read on whether the move is sticking or fading.
Footprint charts show whether traders are actually backing the move. You want to see clear buying or selling control on each bar. If that read is muddy, the move is harder to trust.
Volume profile helps filter the spike.
- A push into a low-volume node that gets rejected can point to continuation.
- If price rotates back into the prior value area, that first spike may have been a stop-run or trap, not a real trend shift.
The First 30 Seconds vs. the First 30 Minutes
Treat the first 30 seconds as the impulse. Treat the next 30 minutes as the check.
The first 30 seconds can show direction fast. The next 30 minutes tell you if that direction has any legs.
The cleaner trades usually come after the first spike settles down. When the spread tightens back up and the footprint shows clear buying, clear selling, or absorption, the market gets a lot easier to read than it is in those first chaotic seconds.
How to Manage Risk Trading CL and MCL Around EIA
Once you know what the report can do to price, the next step is damage control. EIA is a risk event first. Direction matters, sure, but fill quality and stop discipline matter more.
Position Size, Tick Value, and Dollar Risk
CL pays $10 per tick. MCL pays $1 per tick. That’s one-tenth the size, which matters a lot when slippage starts chewing through your risk budget.
Use MCL if a bad fill on CL could shove you past your max loss. Keep your size tied to a fixed dollar amount, and price in slippage before the release, not after it smacks you.
| Contract | Tick Value | Exposure |
|---|---|---|
| CL (Standard) | $10.00 | Full exposure |
| MCL (Micro) | $1.00 | 1/10th exposure |
If your daily loss limit is tight, trading MCL during EIA isn’t playing small. It’s the smarter move.
How to Limit Slippage and Spread Damage
CL spreads that usually sit at 1–2 ticks can blow out the second the number drops. If you send a market order into that mess, you’re volunteering to pay the widest spread and get the worst fill.
A simple way to keep the damage down:
- Use limit orders when you can
- If the spread is still ugly, wait 30 to 60 seconds before using a market order
- Make sure that risk cap lines up with your prop-account rules
That’s not fancy. It just keeps you from doing dumb stuff in a fast tape.
Prop Firm Rules Around Scheduled Releases
Check the account’s news-event policy before the release. Some firms restrict EIA windows. All of them still enforce daily loss limits, so size for the worst-case fill, not the fill you hope you’ll get.
If you need firm-specific rules, don’t guess. Check the site’s Best Futures Prop Firms rankings page and then verify the policy on the firm’s own site.
With size, order type, and loss limits set, the Wednesday sequence becomes mechanical.
A Step-by-Step EIA Trading Plan for Every Wednesday
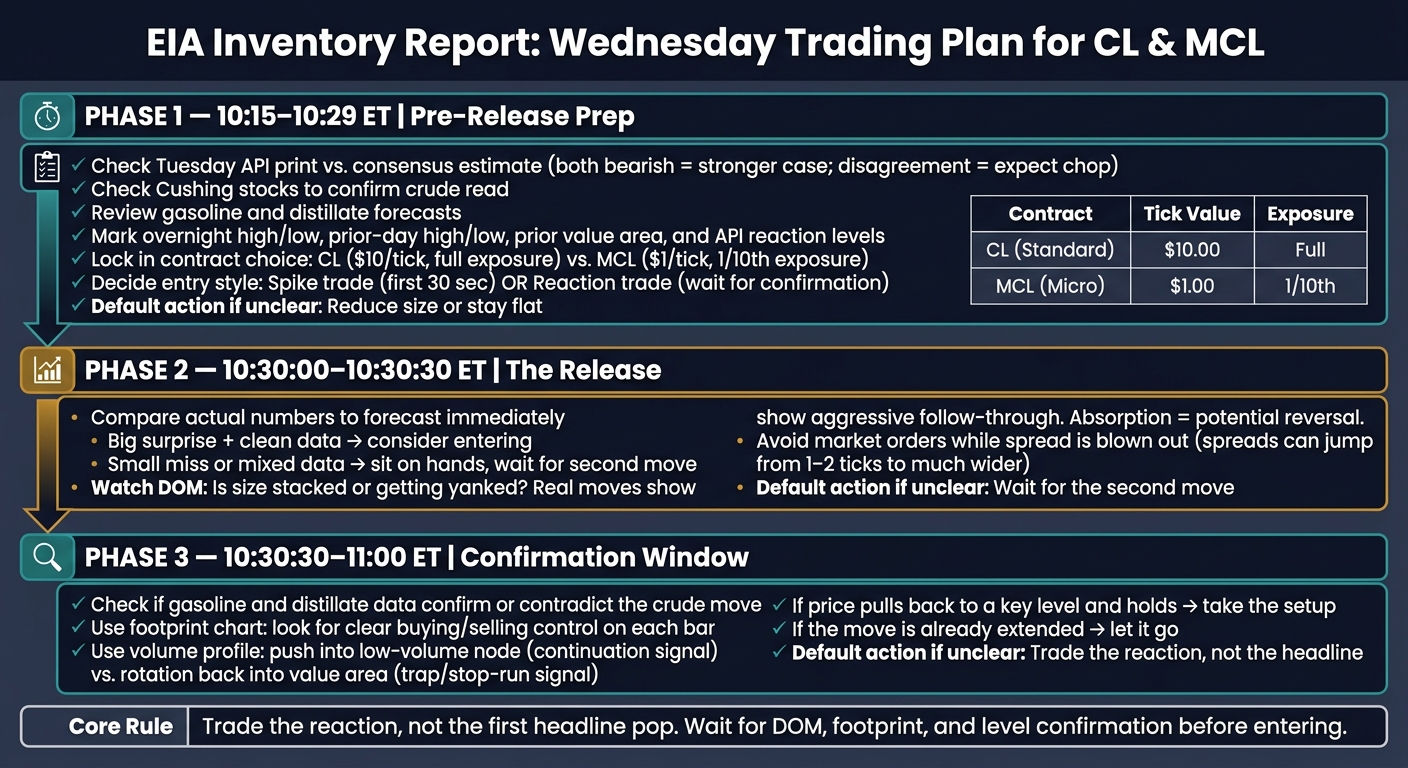
EIA Inventory Report: Step-by-Step Wednesday Trading Plan for CL & MCL
With your levels mapped, size set, and contract picked, this is the Wednesday flow.
10 to 15 Minutes Before the Report
Check the API print and the consensus estimate. If both lean toward a build, the bearish case gets stronger. If they disagree, expect messier price action.
Check Cushing too. That helps confirm the crude read. Also look at gasoline and distillates. A crude miss can get shrugged off if the products go the other way.
Mark your levels and decide your entry style before 10:30 ET.
Once that’s done, stop fiddling with the plan and wait for the release.
From 10:30:00 to 10:30:30 ET
When the data hits, compare the actual numbers to the forecast right away. The size of the surprise usually drives the first move. Small misses tend to chop. Big misses tend to push price in one direction.
Take the first move only if the surprise is big and clean. If not, sit on your hands. Mixed data often turns into noise, so wait for confirmation.
After that first burst, shift your focus to confirmation.
From 10:30 to 11:00 ET
Once the opening spike cools off, check whether gasoline and distillate numbers confirm the crude move or push against it. If price pulls back into a key level and holds, take the setup. If it’s already gone, let it go.
At that point, only trade if price respects the level.
| Time Window | Primary Focus | Default Action If Unclear |
|---|---|---|
| 10:15–10:29 | API lead, consensus, key levels | Reduce size or stay flat |
| 10:30:00–10:30:30 | Surprise delta, initial reaction | Wait for the second move |
| 10:30:30–11:00 | Confirmation vs. reversal | Trade the reaction, not the headline |
Should You Trade Crude During the EIA Release?
After the first reaction and your confirmation tools, the question comes down to this: should you trade EIA at all?
Only take the trade when the headline surprise is clear, the product data isn’t sending mixed signals, and your risk is small enough to handle a hard snapback. If that isn’t there, let the first move cool off.
With spreads blowing out and slippage hitting hard, waiting for confirmation should be your default. DOM, footprint, and small size are the filters that tell you whether this is a trade or a pass. If the setup isn’t clean, it goes bad fast.
Trade the release only when the setup is clean. Otherwise, stay out.
FAQs
How big does the EIA surprise need to be to matter?
An EIA inventory surprise starts to matter when the crude stock number misses expectations by a lot. A common cutoff is a 3σ surprise: the actual print comes in more than three standard deviations away from the median consensus forecast.
Using that yardstick, upside inventory surprises have lined up with larger average moves in crude futures. The first hit is about a 0.5% drop right after the release, then part of that move tends to retrace. Downside surprises have shown smaller average reactions.
What if crude and gasoline numbers conflict?
If crude and gasoline move in opposite directions, read the EIA as a net balance report. A build in crude with a draw in gasoline can mean supply and demand are out of sync for the week. But don’t lean too hard on the gasoline number by itself if distillates and the broader product-demand data don’t back it up.
In practice, CL/MCL can knee-jerk on the surprise and then snap back within hours as traders sort through crude, gasoline, distillates, and implied demand versus the consensus. Watch the full complex at and after 10:30 a.m. ET.
Should beginners trade the first EIA spike?
Usually, no.
Right after the EIA release, crude can snap hard in both directions as traders react to inventory surprises. That means high volatility, slippage, and wider bid-ask spreads. It gets messy fast.
The first move also tends to be an overreaction. For newer traders, it’s smarter to let that chaos cool off before doing anything. If you don’t already trade with tight prop-style risk controls, sitting out the initial spike is often the better play.