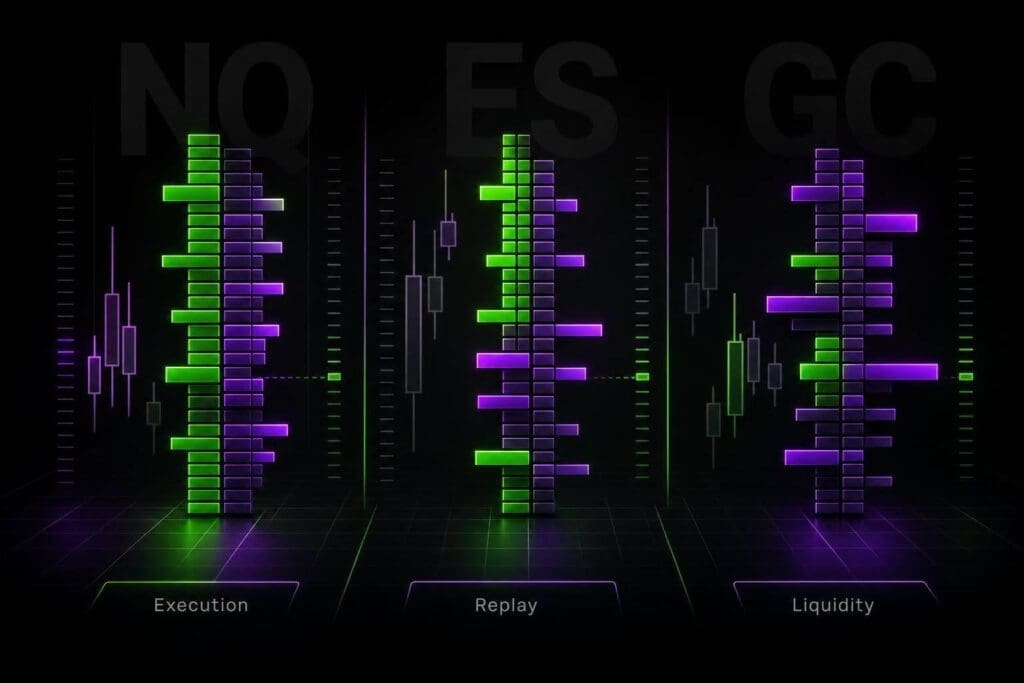
If you trade futures with order flow, I’d keep it simple: Sierra Chart is the pick for raw footprint control, NinjaTrader is the easy execution-first choice, and Quantower is the clean middle ground for prop-style setups. The rest fit narrower jobs. Bookmap is for liquidity reads, MotiveWave is for replay-heavy review, and TradingView is for chart prep, not serious footprint trading.
Below, I’m cutting the article down to what matters. You’ll get the short version on who each platform fits, where it falls short, and which one I’d point you toward based on DOM use, replay, feed support, and screen workflow.
Bookmap vs. Footprint Charts | Bruce Pringle
1. NinjaTrader Order Flow+ Volumetric Bars
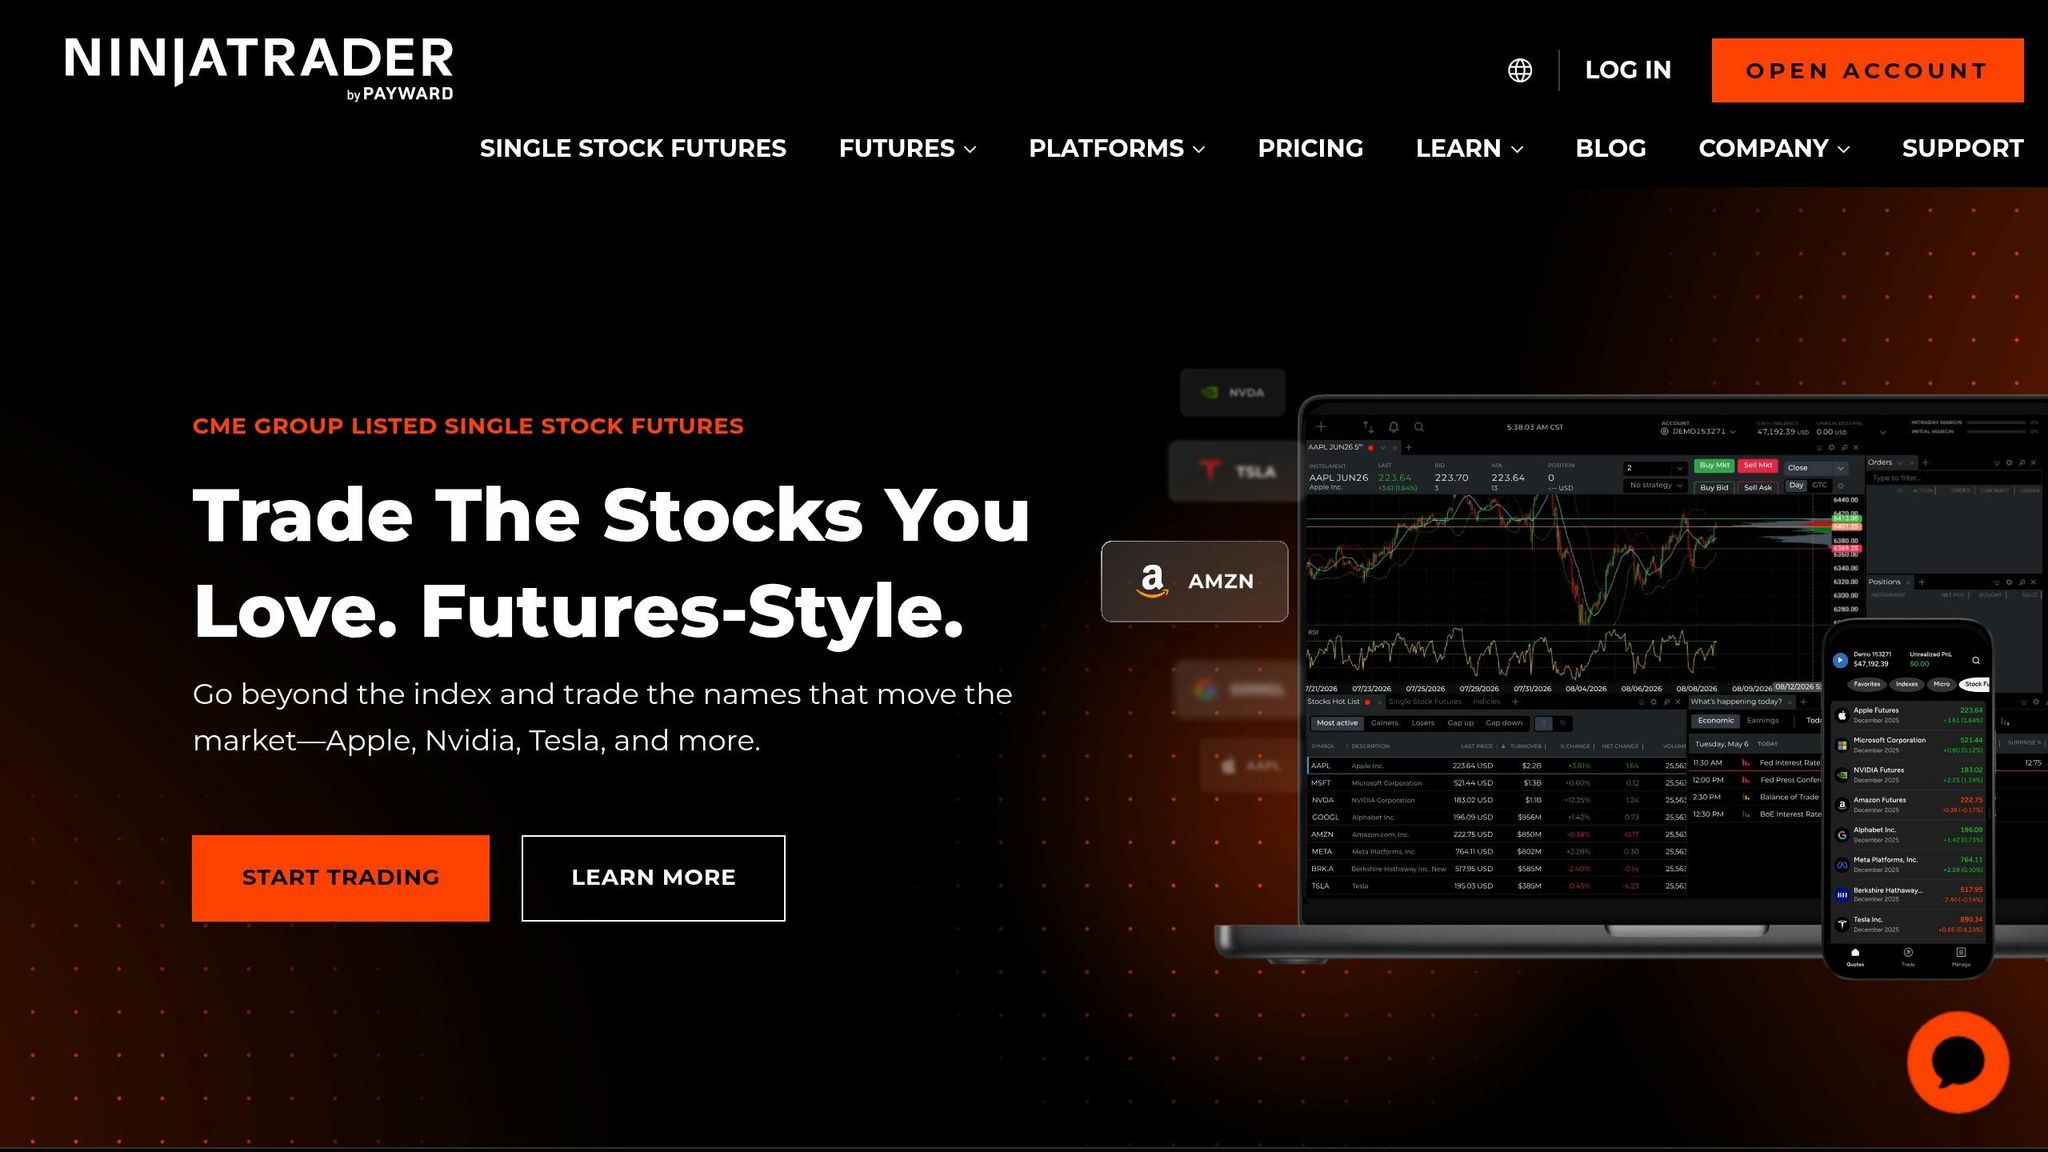
NinjaTrader’s Order Flow+ gives you native Volumetric Bars for bid/ask, delta, and imbalance analysis inside each bar [1][2]. That’s the big draw here. You get charting and footprint-style order flow in the same platform, without leaning on third-party add-ons just to handle the core reads.
The SuperDOM pairs one-click execution with ladder-style order book visibility [1][7]. If you want footprint analysis and order entry on one screen, that setup makes sense. It’s built for execution first, not just chart watching. Native Rithmic and CQG connectivity also lines up well with a lot of prop-trading workflows that run on those feeds [1][2][6].
Market Replay is built in, so you can drill footprint reads and order flow setups on historical tick data [7]. That’s useful for screen time and review. In live trading, though, the native order flow tools matter more than replay.
There’s a catch. Native Order Flow+ isn’t as flexible as platforms built mainly for footprint work. If you want deeper cluster customization, you’ll hit the ceiling sooner. That’s usually where traders start adding third-party tools, which means more cost and more moving parts. NinjaTrader is also Windows-only, so Mac and Linux users need virtualization or dual boot [1][6].
On cost, the base setup is easier to get into: basic charting and simulation are free. But Volumetric Bars need a paid license or lease. On top of that, CME Group market depth data for non-professionals can run about $40.50/month through various providers [4].
If deeper cluster control is your main thing, compare Quantower next.
2. Quantower Cluster Chart
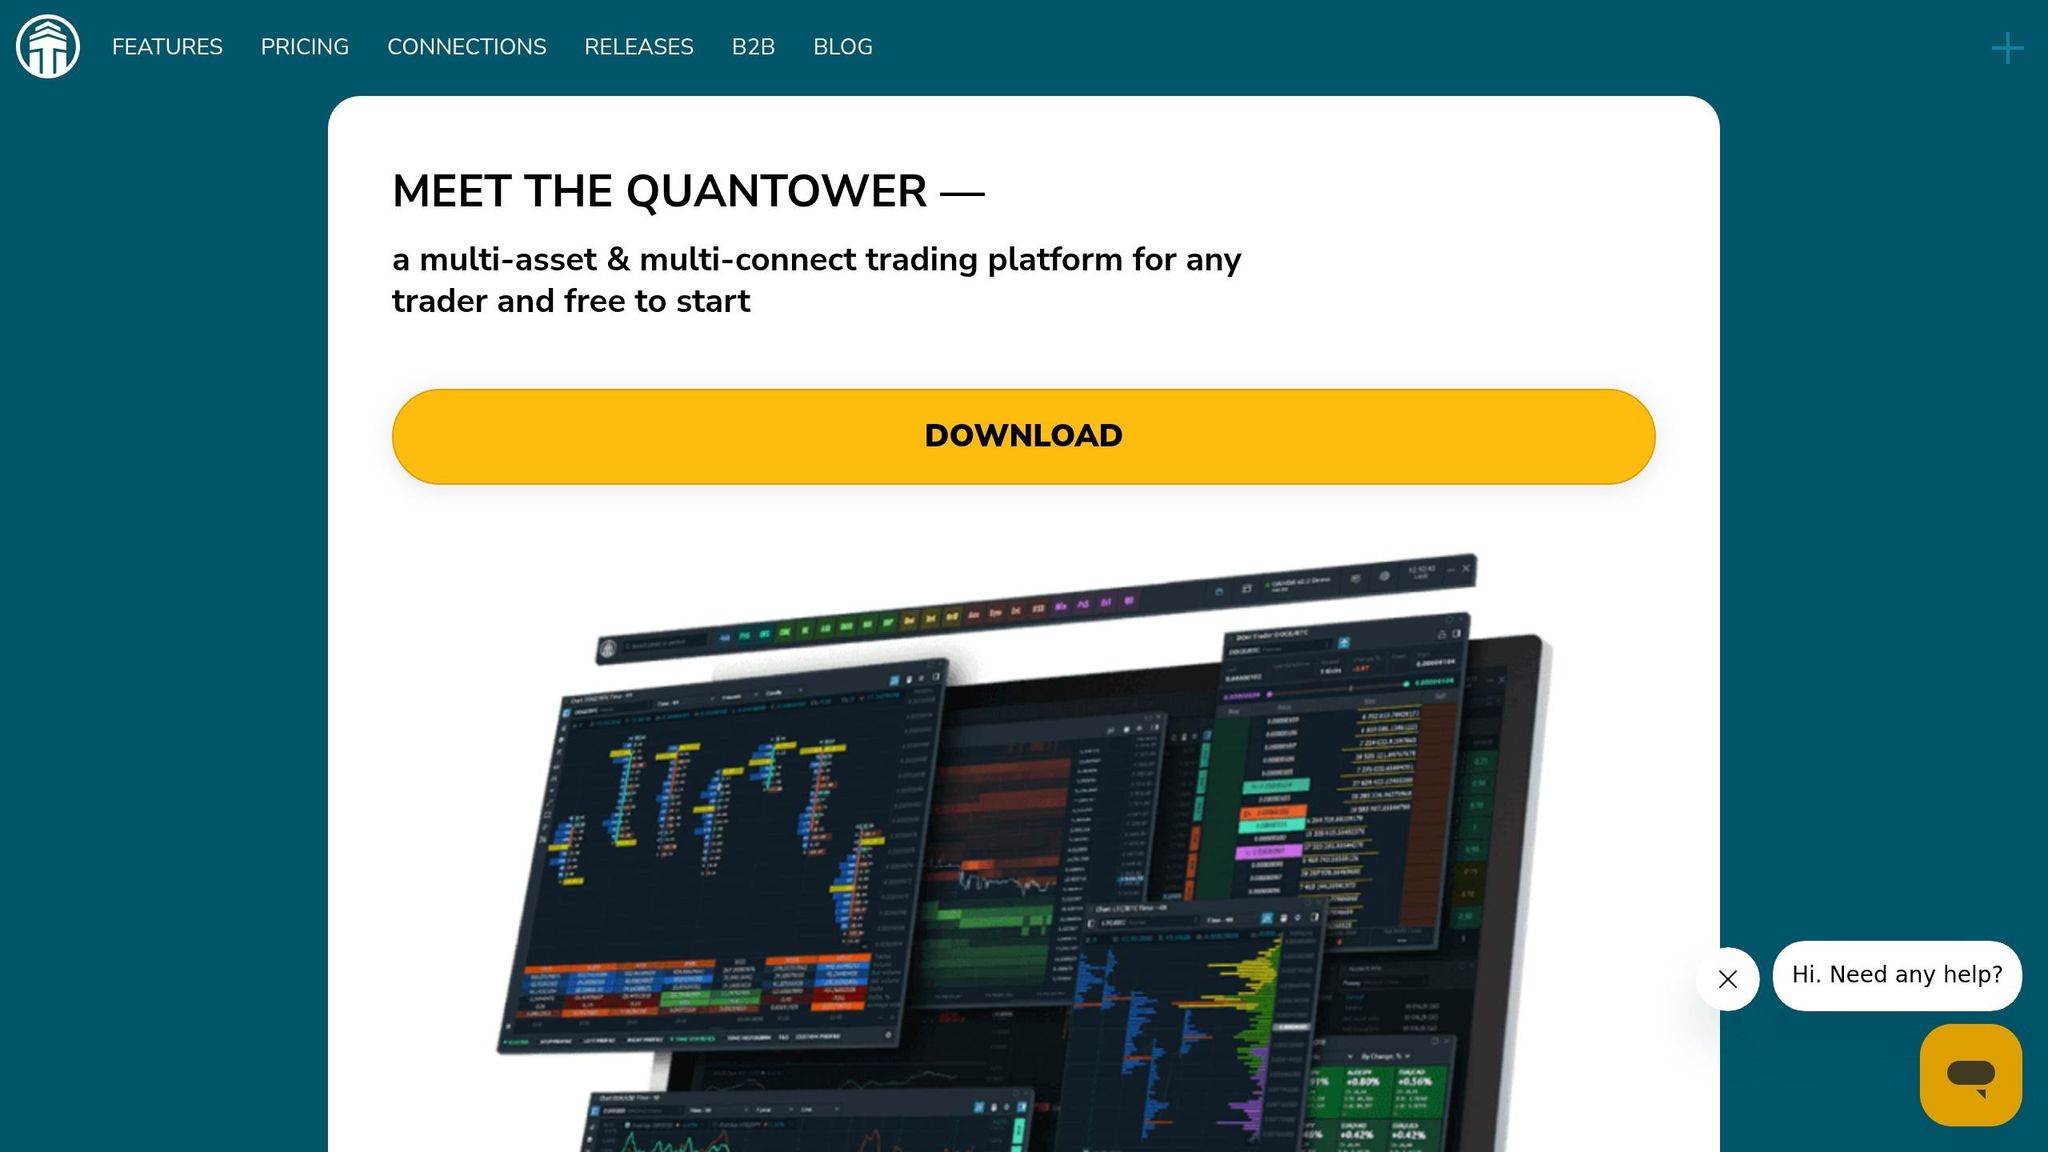
Compared with NinjaTrader, Quantower gives up a bit of simplicity and gives you more control over how the screen looks and how the footprint works. Its Cluster Charts show bid and ask volume at each price level, with views for delta, bid x ask, volume, and imbalance ratios. That’s the stuff you use to catch absorption and exhaustion in ES, NQ, CL, and GC. If simpler footprint tools feel boxed in, Quantower gives you more room to shape the layout the way you want.
The big draw here is the DOM Surface heatmap. It shows resting liquidity as a heatmap, so you can see resting limit orders, pulling, stacking, and how liquidity shifts over time. Side by side with Cluster Charts, that gives you a cleaner read on what’s sitting in the book and what’s getting yanked. For ES and NQ scalpers, that matters. Fast reads on absorption and stacked imbalance can be the whole trade.
Quantower supports more than 60 broker and data feed connections, including Rithmic, CQG, Tradovate, and Interactive Brokers[1][6]. That’s broad enough for most prop setups without weird workarounds. The upside for prop traders is simple: chart analysis, execution, and review all sit in one workflow.
Replay keeps your live layouts and footprint settings intact, so practice actually looks like live execution. That’s a big deal when you’re drilling imbalance and absorption reads in a fast market like NQ before putting money on the line.
Pricing is straightforward:
- All-in-One: $70/month
- Lifetime license: $1,690
- Free tier: basic charting and execution
- Real-time data feeds: add about $20 to $50/month for feeds like Rithmic or CQG[1][6]
Quantower is Windows-only[1][6]. If you want more scripting depth and a heavier research workflow around footprint trading, MotiveWave is the next step.
3. MotiveWave Volume Imprint
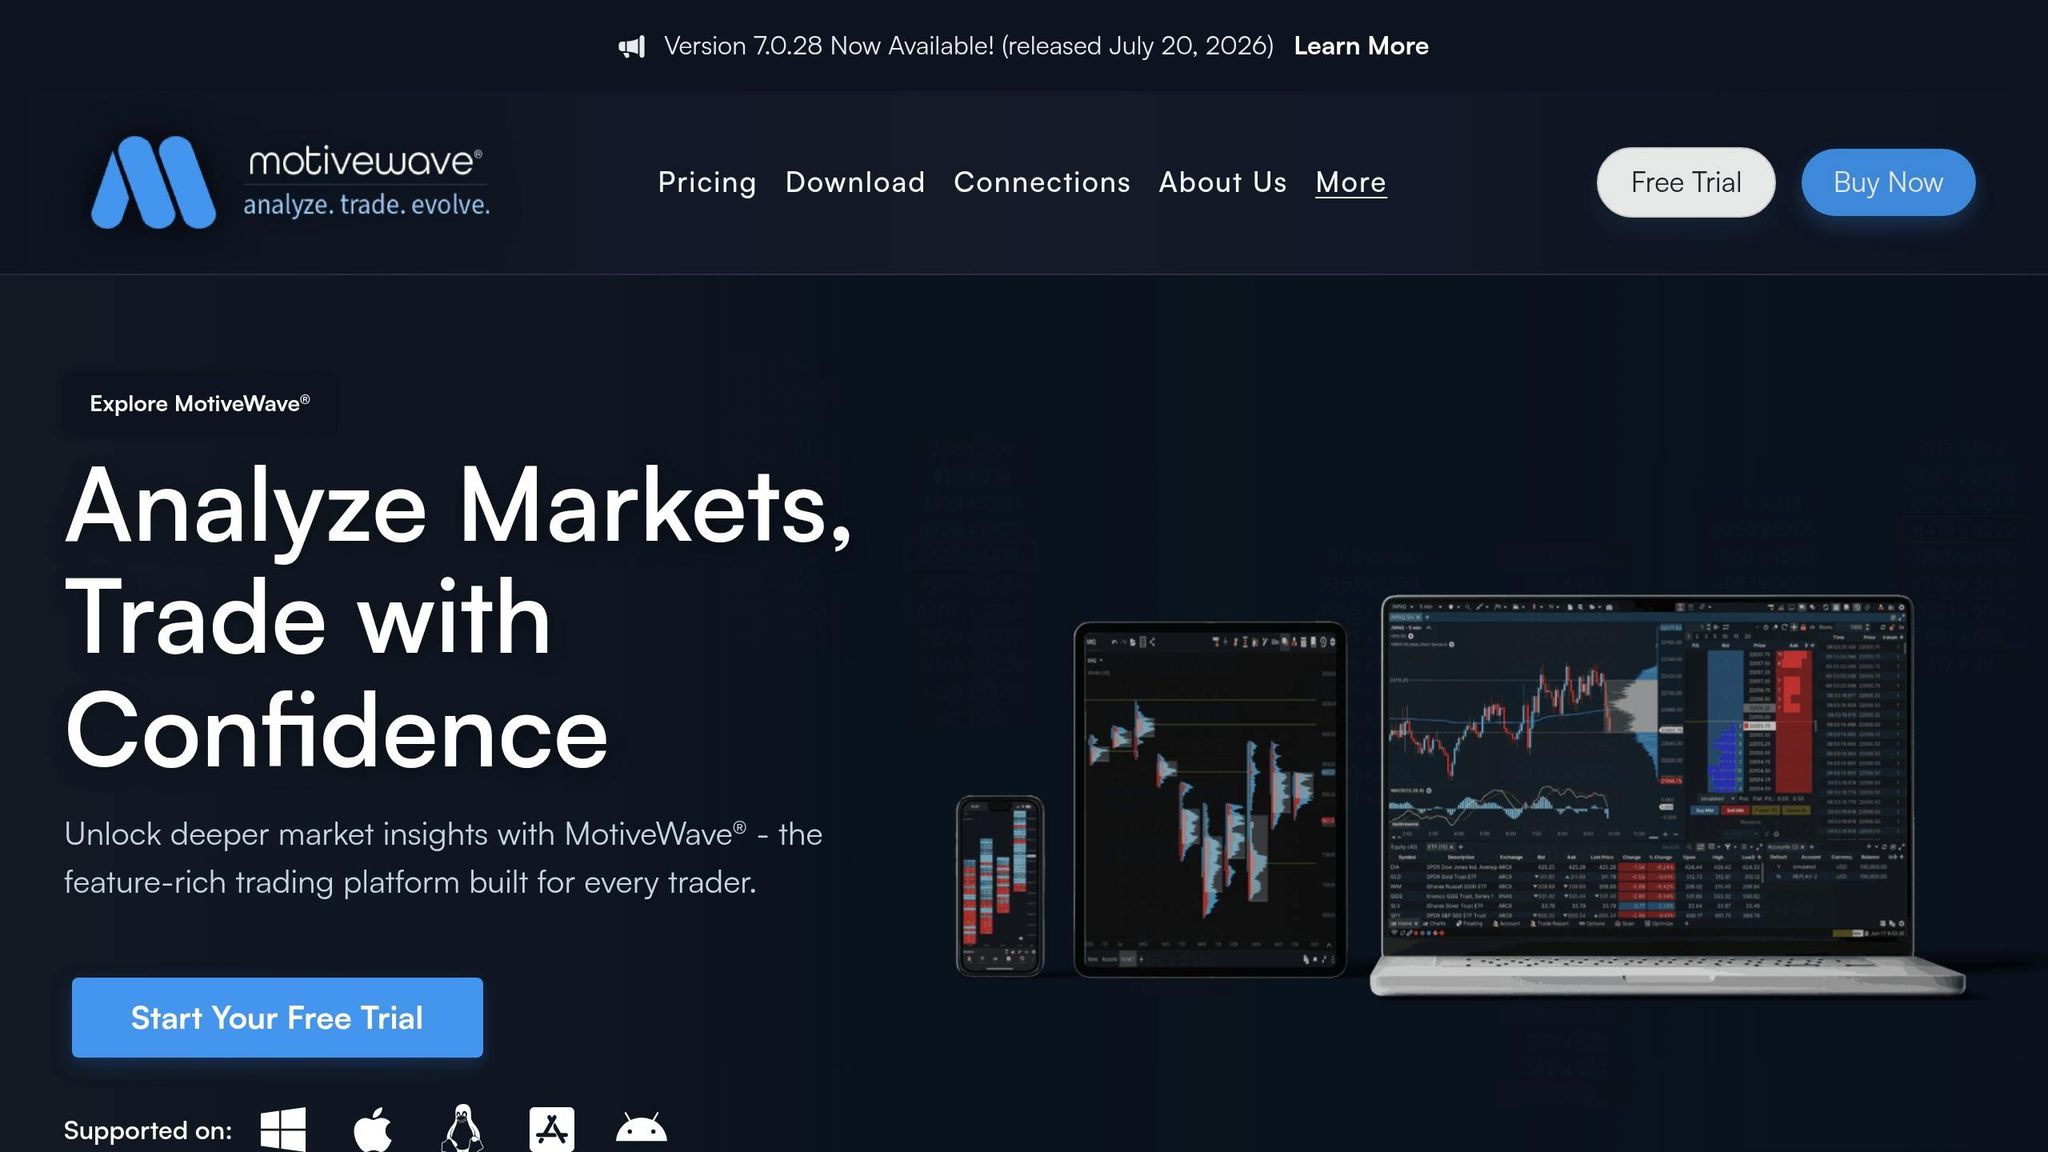
MotiveWave is built for footprint work and replay. Its Volume Imprint puts bid/ask split, volume-at-price, and imbalance reads on the same screen, which makes imbalance and absorption easier to read and review[3].
The big edge here is Replay Mode. You get tick-by-tick playback, so you can go back through old order flow, pause the action, and tighten up your entry rules based on what actually happened during the session[3].
MotiveWave also lets you save chart templates and reuse them across markets. Build a Volume Imprint layout for ES once, then drop that same setup onto CL or GC. That kind of consistency helps when you’re rotating contracts during the day[3]. The downside is the setup can be a pain. Each market needs manual feed mapping and filter setup[3]. It does work with more than one broker and feed.
MotiveWave makes more sense for traders who care more about replay and post-session review than fast DOM execution. If your style leans more visual and more liquidity-first, the next stop is Bookmap with its Footprint add-on.
4. Bookmap with Footprint Add-On
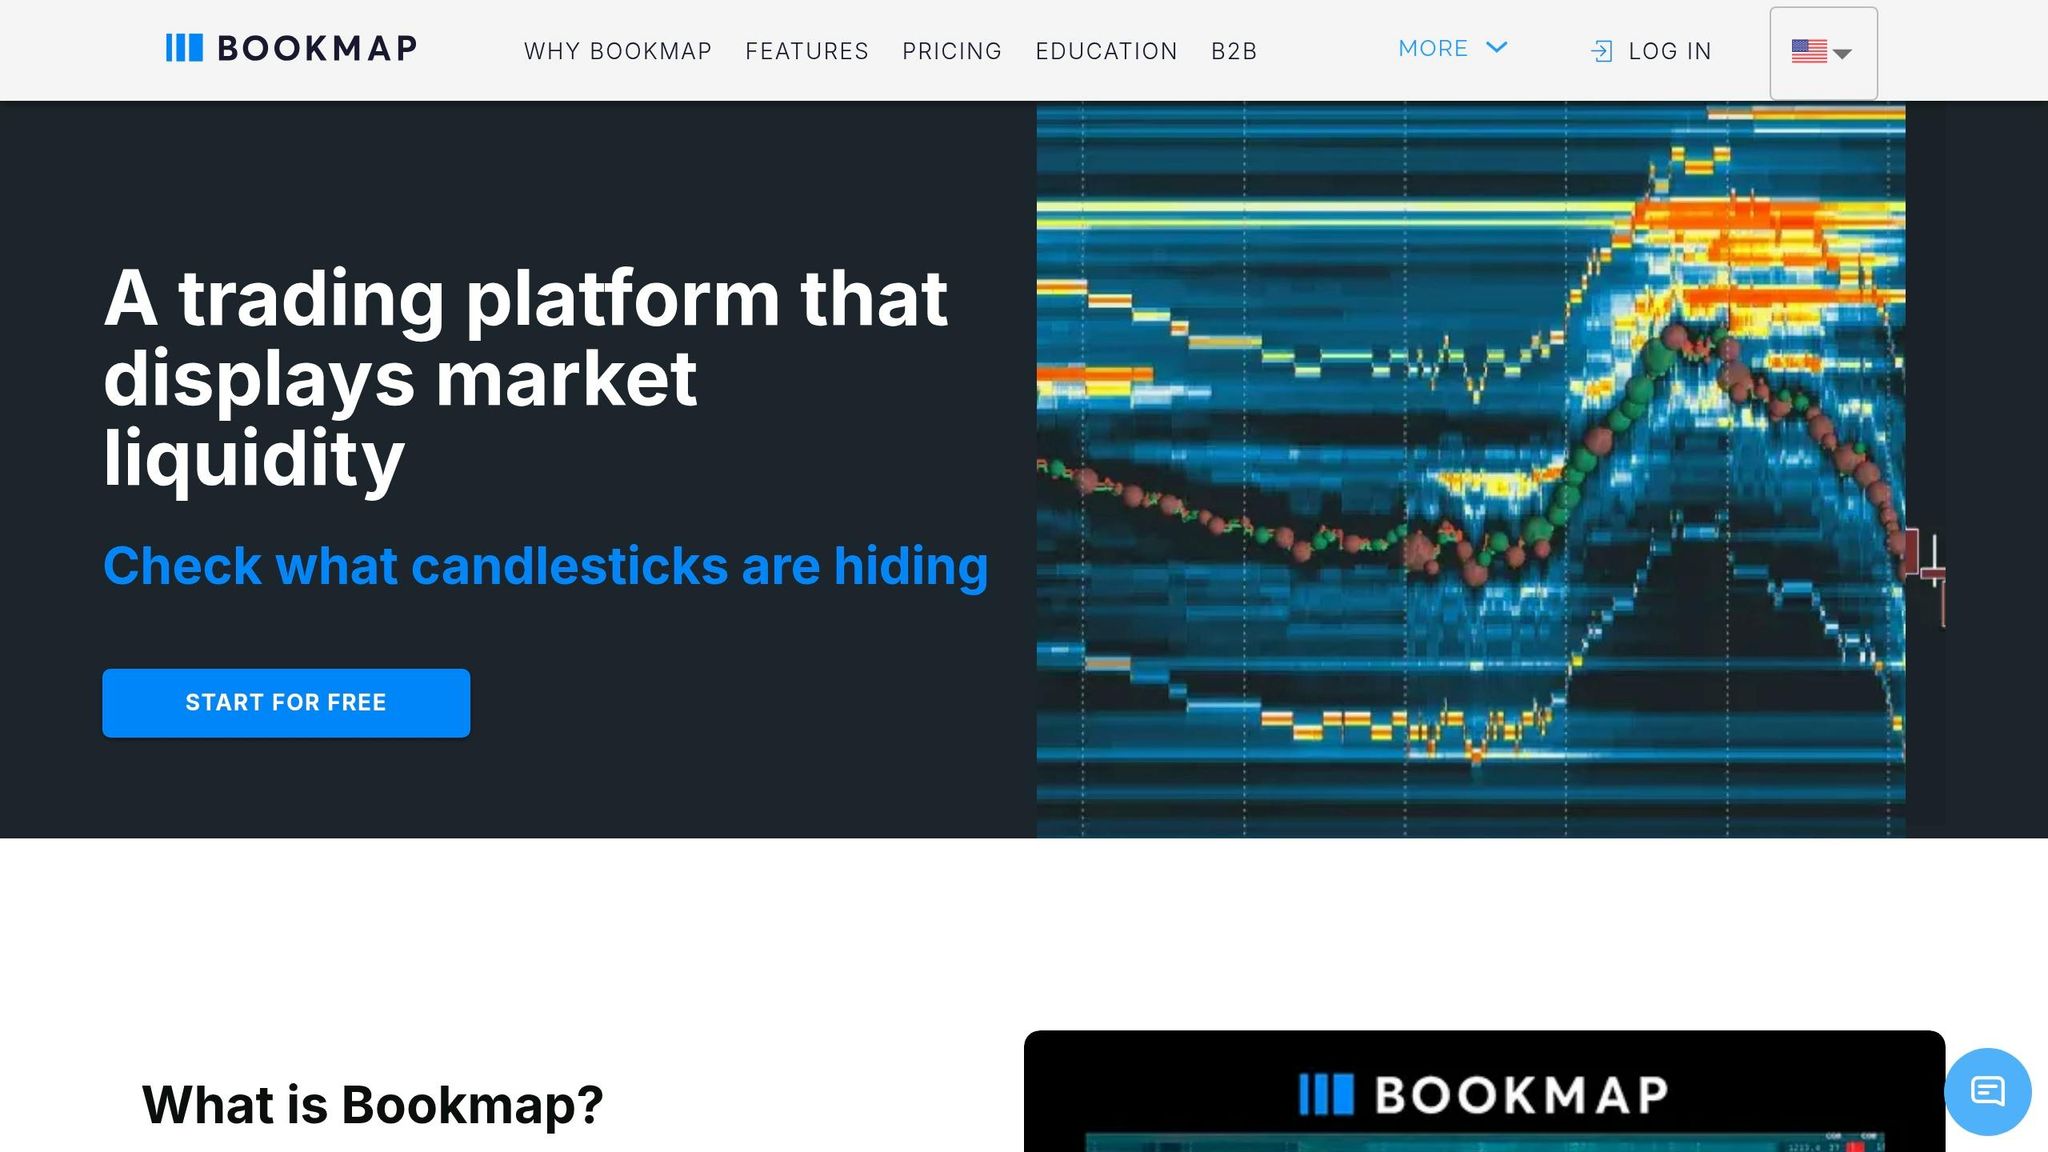
If you read the market through liquidity instead of a wall of numbers, Bookmap goes a different direction. It doesn’t lean on dense cluster charts. It turns the live order book into a real-time, color-coded heatmap [2]. On top of that, it tracks Cumulative Volume Delta (CVD) and uses Volume Dots to show changes in executed volume and bid-ask participation [2][3]. You can see liquidity stack, pull, and absorb before price reacts.
That’s the whole point here. Pre-trade context. You can watch price push into liquidity walls and see if that volume gets absorbed or if price snaps away from it [2]. Bookmap also has a native Iceberg Order Detector that flags iceberg-like behavior by spotting large orders broken into smaller prints [2]. One-click trading is built in, and Replay gives you tick-by-tick review [2][3].
There are trade-offs. Bookmap is less flexible with prop-firm setups than NinjaTrader or Quantower [2]. It connects to futures data through Rithmic or CQG, but you’ll pay for market data separately. The Digital plan is free, Global runs $49/month, and Global+ is $99/month [2]. It’s also Windows-only [2].
A couple more things matter in live sessions:
- Reliable use depends on clean tick data and correct symbol and exchange mapping [3].
- Performance starts to slip when you load too many instruments at once [3].
So no, this isn’t a full footprint replacement. It’s better used as a liquidity-first companion tool. If you want to see where size is sitting, where it’s getting pulled, and whether price is about to slam into a wall or bounce, Bookmap does that job well.
If you want lighter footprint-style visuals with less platform complexity, TradingView add-ons are the next option.
sbb-itb-46ae61d
5. TradingView Footprint Add-Ons
TradingView is good at one thing: keeping things simple. What it does not do well is deep, native footprint work.
Its Volume Footprint comes with the Premium plan at $59.95/month. You get bid/ask volume by price, which is useful, but you do not get native tick-level order flow [5][3]. That puts it in the light analysis bucket, not the full order-flow workstation bucket.
If you want imbalances, stacked imbalances, or absorption, you’ll usually end up leaning on Pine Script indicators. That can work. But there’s a catch: script quality is all over the place [5][3]. Some are clean and usable. Some are junk. If you plan to use one on fast markets like ES or NQ, test it first. Hard.
Execution is where TradingView starts to show its limits. Yes, it connects to multiple brokers. No, that doesn’t fix the main issue. It still doesn’t have a native DOM, and it still lacks the tick-level data active futures scalpers usually want [2][7]. So the common setup is pretty simple: use TradingView to review charts, mark levels, and prep the trade, then execute somewhere else that has a native DOM. That gap matters in prop-firm workflows. Broker connection alone is not the same as proper DOM execution or tick-level order flow.
Replay has the same problem. Bar Replay is included on Essential plans and up, but it does not rebuild the tick sequence [5]. If you’re trying to check an order-flow pattern in CL or GC tick by tick, TradingView won’t do the job. On top of that, real-time CME data costs about $14/month extra for non-professional traders, on top of the base subscription [5].
So here’s the blunt version: use TradingView for analysis and prep. Don’t make it your main futures execution platform if footprint depth and fast order-flow reads matter. If that’s what you need, Sierra Chart is the next place to look.
6. Sierra Chart Numbers Bars and Footprint Workflow
If you want the most configurable footprint workflow on this list, Sierra Chart is the advanced pick. It’s a Windows-native C++ platform, and that matters when the market gets busy. Sierra stays fast in fast tape, which is a big reason a lot of order-flow traders still stick with it, even though the interface looks old-school. [4][8]
That speed lines up well with Numbers Bars, which is Sierra Chart’s main footprint tool. You get deep control over bid/ask reads, delta, imbalances, and volume-at-price. You can dial in absorption reads, filter for exhaustion, and decide exactly how the footprint displays on the screen. If you’re trading CME futures, Denali data helps with more accurate bid/ask attribution. [4][3]
On cost, you’ll need Package 11 (Integrated Advanced) at $46/month or Package 12 (Integrated Advanced with MBO) at $56/month. Package 12 adds Market-by-Order data. CME Group non-professional data with market depth usually adds about $40.50/month if you have a qualifying live account. That puts the total around $86.50 to $96.50/month. [4]
Replay is one of Sierra’s strong points. It supports tick-by-tick replay from 0.1x to 100,000x and uses stored intraday data files. So no, you don’t need to have recorded the session yourself just to go back and study it later. You can review the same footprint and DOM setup you use live, which is exactly how it should work. [4]
The catch is simple: setup takes time. Sierra gives you a ton of control, but you pay for it with a steeper learning curve and a less polished UI. That’s the main drawback. Build your templates, save your chartbooks, and make the workflow repeatable. Otherwise, you’ll spend too much time fiddling with settings instead of reading the market.
For prop traders, Sierra can still fit into common execution setups. It supports Rithmic, CQG, Teton, and Interactive Brokers for order routing. If you’re trying to keep exchange fees down, the CME funded-account process can help you qualify for lower non-professional data fees. [3][4]
Pros and Cons by Trading Workflow
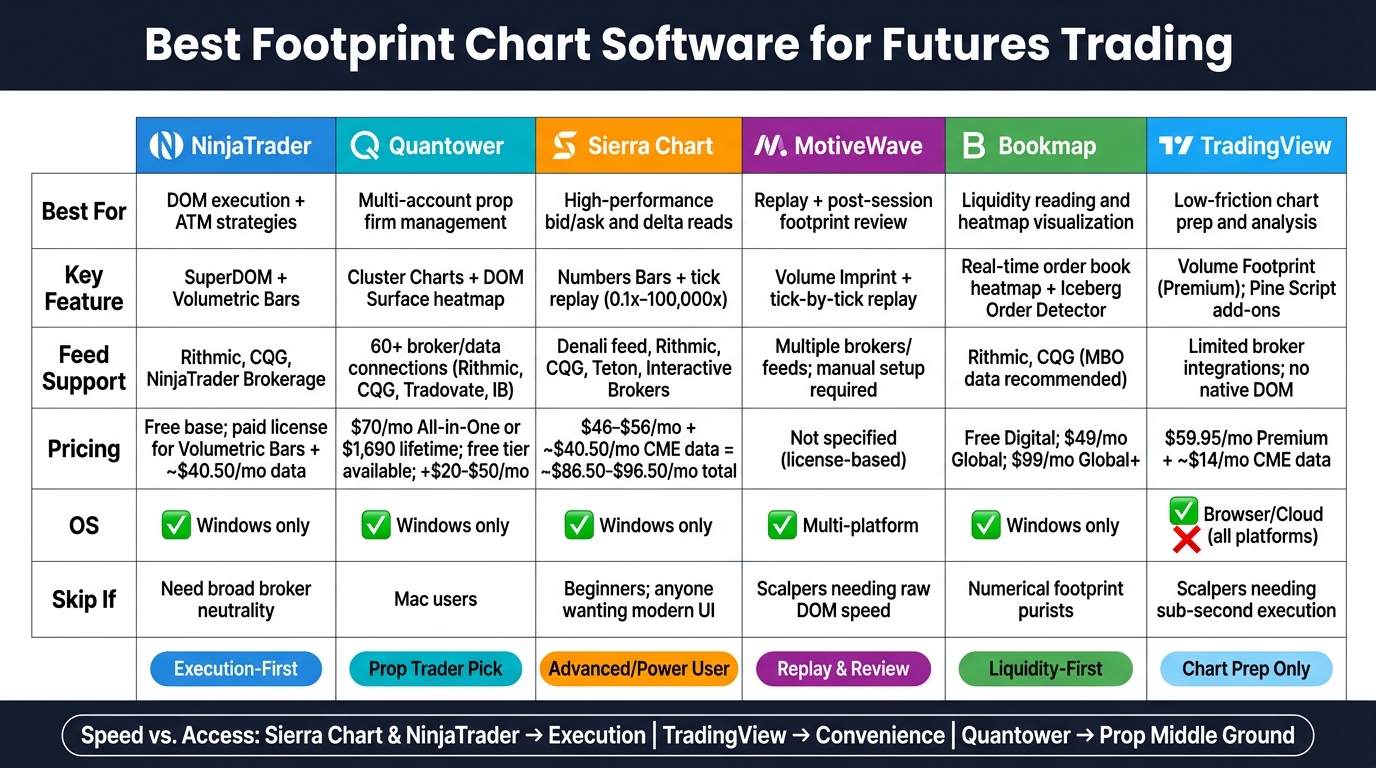
Best Footprint Chart Software for Futures Trading: Side-by-Side Comparison
For futures traders, this isn’t about who has footprint charts. It’s about which platform fits how you trade. If your day revolves around DOM execution, replay, multi-account control, or reading liquidity, that should drive the pick.
| Platform | Best-Fit Workflow | Why It Wins / Main Trade-Off |
|---|---|---|
| NinjaTrader | DOM execution + ATM | SuperDOM, ATM strategies, Rithmic/CQG support |
| Quantower | Multi-account prop management | Broad broker support, DOM Surface, copy trading |
| MotiveWave | Replay + strategy development | Structured replay, footprint research |
| Bookmap | Liquidity reading | Heatmap + iceberg detection |
| TradingView | Chart prep + browser access | Cloud sync, Pine Script |
| Sierra Chart | High-speed scalping | Numbers Bars, deep customization, tick replay |
The big split here is speed vs. access.
- Sierra Chart and NinjaTrader lean hard toward execution
- TradingView leans toward convenience
- Quantower lands in the middle for prop workflows
That framing cuts through a lot of the noise. If you need fast order entry and tight control, Sierra Chart or NinjaTrader make more sense. If you want browser access and easy chart prep, TradingView is the easier fit. If you’re juggling prop accounts, Quantower has a strong middle-ground setup.
Use these workflow matches to narrow the final choice in the next section. Next is the practical fit: which setup matches your account, data feed, and execution style.
Which Footprint Software Fits Your Futures Setup
Pick the platform based on how you trade, which feed you use, whether you need prop-account support, and how much setup work you’re willing to deal with. The workflow matches above should already narrow the field. From there, this is the quick filter.
| Software | Best Use Case | Feed Fit | Skip If |
|---|---|---|---|
| NinjaTrader | Dedicated day trading and SuperDOM | Best with NinjaTrader Brokerage; supports Rithmic/CQG [1][8] | Traders who want broad broker neutrality |
| Quantower | Multi-account prop firm management | 60+ broker and data-feed connections [1][2] | Mac users |
| Sierra Chart | High-performance bid/ask and delta reads | Its Denali feed is built for low-latency CME data [4] | Beginners; anyone who wants a modern UI |
| MotiveWave | Replay and post-session footprint review | More manual setup and data mapping [4] | Scalpers who need raw DOM speed |
| Bookmap | Liquidity reading and heatmap visualization | Best with high-quality MBO data [2] | Numerical footprint purists |
| TradingView | Low-friction chart prep | Limited to specific broker integrations [8] | Scalpers who need sub-second execution |
One thing to watch with Sierra Chart: its evaluation accounts don’t qualify for non-professional CME data pricing, so check your funded-account setup before you commit.
FAQs
Which footprint platform is easiest for beginners?
GoCharting is the easiest footprint platform for beginners. It runs in your browser, which cuts out a lot of the usual setup pain: no messy Windows install, no local data-feed tinkering, and no need for a beast of a PC. You still get native footprint charts, volume profiles, and order flow tools.
If you want desktop software, Quantower is the easier pick for most traders than Sierra Chart or ATAS. That said, it still has a learning curve, so don’t expect to master it in one sitting.
Do I need a separate data feed for footprint charts?
Yes. Footprint charts run on real-time tick data, and most platforms don’t bundle that with the software license. In plain English: paying for the charting platform usually does not mean you’re getting the data feed too.
You’ll usually need a separate market data subscription through your broker or an approved provider like Rithmic or CQG.
With Quantower, for example, you pay for the platform and the exchange data as separate pieces. If you’re using a prop-firm bundle or white label setup, the platform itself might be included. But the market data still has to come from somewhere.
What should prop traders prioritize in footprint software?
Prop traders should put reliable, low-latency tick-by-tick data at the top of the list. If the data is off, your footprint is off. Same goes for volume-at-price. You need precise bid/ask volume tagging, or the whole read gets muddy fast. Strong data-feed connectivity matters too, because clean market microstructure reads depend on it.
Workflow matters just as much once you’re in the platform every day. Look for solid trade replay, workspace customization, and multi-account handling that doesn’t feel clunky. You also want clean visuals that make institutional activity, absorption, and exhaustion easy to spot at a glance. And yes, check the boring stuff before you commit: make sure the software supports the instruments you trade and works with the prop firm’s execution setup.