If you trade futures and your screen is still just candles plus an RSI, you’re missing the part that drives entries: who’s hitting, who’s sitting, and where size gets stuffed. That’s what order flow software is for. I’m not going to rehash every feature list from every platform site. I’ll boil this down to what each tool actually does, where it helps, and where it just clutters your layout. If you scalp ES, NQ, CL, or anything else off tight stops, this is the stack that matters and the fluff you can skip.
Bookmap Education Course Part 1 | Trading Order Flow | DOM | Market Depth Trading
sbb-itb-46ae61d
1. Footprint Charts
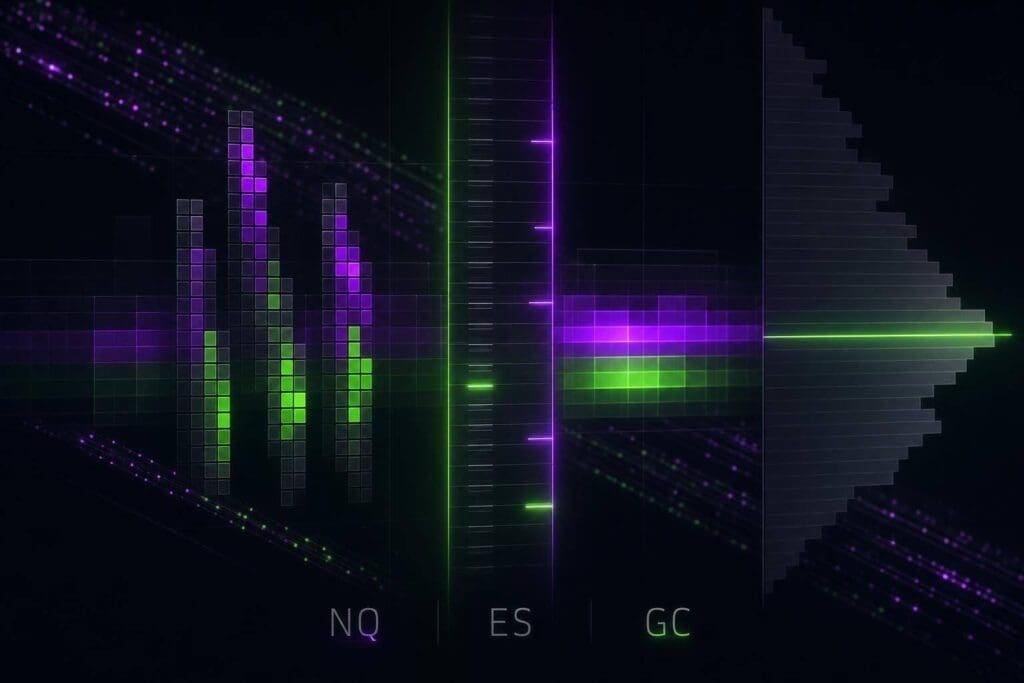
A footprint chart shows bid and ask volume at each price level inside the bar. That lets you see who was doing the hitting, and how hard. You’re not just looking at price moving up or down. You’re seeing the aggression behind the move.
Delta and Imbalances
The two things that matter most here are delta and stacked imbalances.
Delta is the net difference between buying and selling volume inside a bar. If price keeps pushing higher but delta flips negative, that divergence often points to exhaustion. Buyers got price up, but the volume underneath doesn’t back it up. That’s usually a warning sign, not random noise.
Stacked imbalances show steady buying or selling pressure across several price levels. In fast markets, that helps a lot. You can spot directional pressure without guessing.
Footprints matter because they show whether aggression is real or just noise.
Absorption and Trapped Trade Zones
Footprints also help you spot absorption. That’s high volume at a price level where price stops moving because a large limit order is soaking up incoming market orders. On the chart, it often looks like heavy effort with no follow-through. That’s the kind of thing a plain candlestick chart hides.
They can also show unfinished auctions, which often act like magnets later when price comes back.
Once you can read pressure inside the bar, the next move is watching where those orders are sitting in the ladder.
Platform and Feed Fit
For scalping, focus on tick accuracy and fast replay. For deeper analysis, focus on cluster tools and filtering. Footprint charts work best on tick-by-tick data. If your feed is filtered or aggregated, trades can get missed and the footprint gets distorted. That defeats the whole point.
For scalpers, Rithmic is often the go-to for ultra-low-latency tick data [4].
On platforms, ATAS is the top pick for detailed footprint work. It has 400+ footprint variants and Cluster Search, which helps cut through noise [2][6]. Quantower fits traders who want more broker and feed flexibility. It supports 60+ broker and data-feed connections, plus Cluster Charts and DOM Surface [1][2]. NinjaTrader is still the most used desktop option, but its footprint tools sit behind the paid Order Flow+ add-on at $60/month [4][5].
| Platform | Best-Fit Use | Key Differentiator |
|---|---|---|
| ATAS | Order flow specialists [2][6] | 400+ footprint variants, Cluster Search |
| Quantower | Multi-broker, prop traders [1][2] | 60+ feed connections, DOM Surface |
| NinjaTrader | Desktop power users [4][5] | Widest ecosystem, $60/month add-on |
Use Market Replay first to practice reading absorption and imbalances before trading live [2][5].
That matters most when execution speed and liquidity read matter more than chart aesthetics.
Footprints show what hit the tape; the DOM shows where the next trade can get filled.
2. DOM and Price Ladder
The footprint tells you what already happened inside the bar. The DOM shows resting orders sitting on the book right now. That’s the whole point, and it matters when you’re trying to nail an entry instead of chasing after the move. If you can read a footprint, the DOM is the next screen to add.
Execution Visibility
A good DOM puts execution right in front of you. You can enter with one click, move orders, and manage attached stops and targets from the same panel [1][2].
Liquidity Context
A plain chart shows price. The DOM shows the liquidity behind that price.
When bids start stacking below and offers sit heavy above, you get a better read on where price might stall, bounce, or rip through. Big resting-order clusters can act like support or resistance, at least until they get pulled or smashed through. That’s why the ladder matters. It shows the stuff a standard chart hides.
Quantower’s DOM Surface pushes this further with a heatmap-style view of limit order activity shifting in real time. It makes added liquidity and pulled liquidity much easier to spot without squinting at the ladder [1]. And when the DOM starts moving fast, time and sales helps you check whether traders are actually hitting those levels or if it’s just book movement.
Timing Precision
Scalpers use the DOM to read stacking and absorption [7]. That’s where entry timing gets tighter, and exits get faster when order flow flips on you.
For tick-by-tick execution, a fast DOM paired with a low-latency feed like Rithmic keeps the ladder current enough to trade off. If the ladder lags, your read is late. Simple as that.
The DOM takes footprint signals and puts them into execution. The next tool is time and sales, which shows each print as it hits the tape.
3. Time and Sales
If the ladder shows where orders are sitting, the tape shows whether traders are actually hitting them. The DOM shows resting liquidity. Time and sales shows executed trades. That distinction matters. You use the tape to check whether buyers or sellers are pressing a level, not just sitting there looking tough.
Platforms like ATAS and Jigsaw Trading clean up fragmented prints by filtering and grouping them, so bigger orders split into smaller pieces are easier to spot [6][2]. That’s why the tape only earns its keep when you’re watching a real level. Random prints in the middle of nowhere? Mostly noise.
At a key level, the tape can tell you a lot fast. If buyers keep lifting the offer and price still won’t move, that says something. Same if sellers keep smacking the bid and the market just holds. Tape tools can also help spot iceberg orders, where bigger orders are broken into smaller prints [3][2]. When you watch the tape next to a DOM level, you get a cleaner read on whether resting liquidity is legit or just bait that’s about to get pulled.
For scalping, use the fastest reliable tick-by-tick feed you can get. Then add a size filter. Something like 10+ lots or 50+ lots, depending on the contract, cuts out junk and keeps your eyes on prints that might matter [6][2]. That’s the whole point: the tape works best as confirmation, not as a standalone trigger.
A few platform notes:
- ATAS offers Smart Tape, with the Plus plan starting at €24.95/month [6]
- Jigsaw Trading offers Reconstructed Tape as a one-time buy from $579 to $1,379, plus $50/month for live data [2]
- Quantower includes Time & Sales in its All-in-One package and syncs it with the DOM Surface [1]
Tape matters most near high-volume nodes and value-area extremes. In the middle of the range, it usually just adds noise.
4. Volume Profile
Volume Profile shows you where the market accepted price and where it didn’t. That’s the point. Use it for context, not for pulling the trigger. Mark the levels first. Then let the DOM and tape handle entry timing.
Market Structure
Volume Profile gives you the Point of Control (POC), which is the highest-volume price, plus the Value Area, where about 70% of volume traded [1][2]. Those are your main anchors. They show where the market was comfortable doing business. Price outside those zones is a different story. That’s where you start thinking about how far it might move before it finds acceptance again.
Liquidity Context
High-Volume Nodes (HVNs) and Low-Volume Nodes (LVNs) build the map. HVNs often act like speed bumps. LVNs are more like air pockets. Price can rip through them fast or reject hard off them [1][2]. If price breaks through an LVN, it can move quickly toward the next HVN [1]. That gives you a clean structural map before the session even opens.
Timing Precision
Use Volume Profile before the open to mark VAH, VAL, and POC. Then use the DOM and footprint for entries [1][5]. Simple workflow. If price is trading above the prior session’s Value Area, that points to a bullish structural bias. If it’s below, the bias leans bearish.
Platform and Feed Fit
Feed quality matters here. Use Rithmic or CQG if you want cleaner profile levels. Aggregated feeds can blur volume at exact prices, which makes the profile less useful [4][7].
On platforms, here’s the short version:
| Platform | Volume Profile Quality | Best Feed Fit |
|---|---|---|
| Quantower | Professional-grade, configurable | Rithmic, CQG |
| ATAS | Deep cluster analysis | Rithmic, CQG |
| NinjaTrader | Advanced via Order Flow+ | Rithmic, CQG |
| Tradovate | Basic, DOM-centric | CQG (integrated) |
A few platform notes matter:
- Quantower costs $70/month for the All-in-One package and includes Volume Profile with its DOM Surface [1][6].
- NinjaTrader charges $60/month for Order Flow+, or it comes with the lifetime license [4].
- ATAS starts at €24.95/month for the Plus tier and is built for deeper cluster analysis [2][6].
- Tradovate is more basic, with a DOM-first workflow and thinner native profile tools [4].
Heatmap tools then show how resting liquidity sits around those levels.
5. Heatmap and Bookmap-Style Liquidity Tools
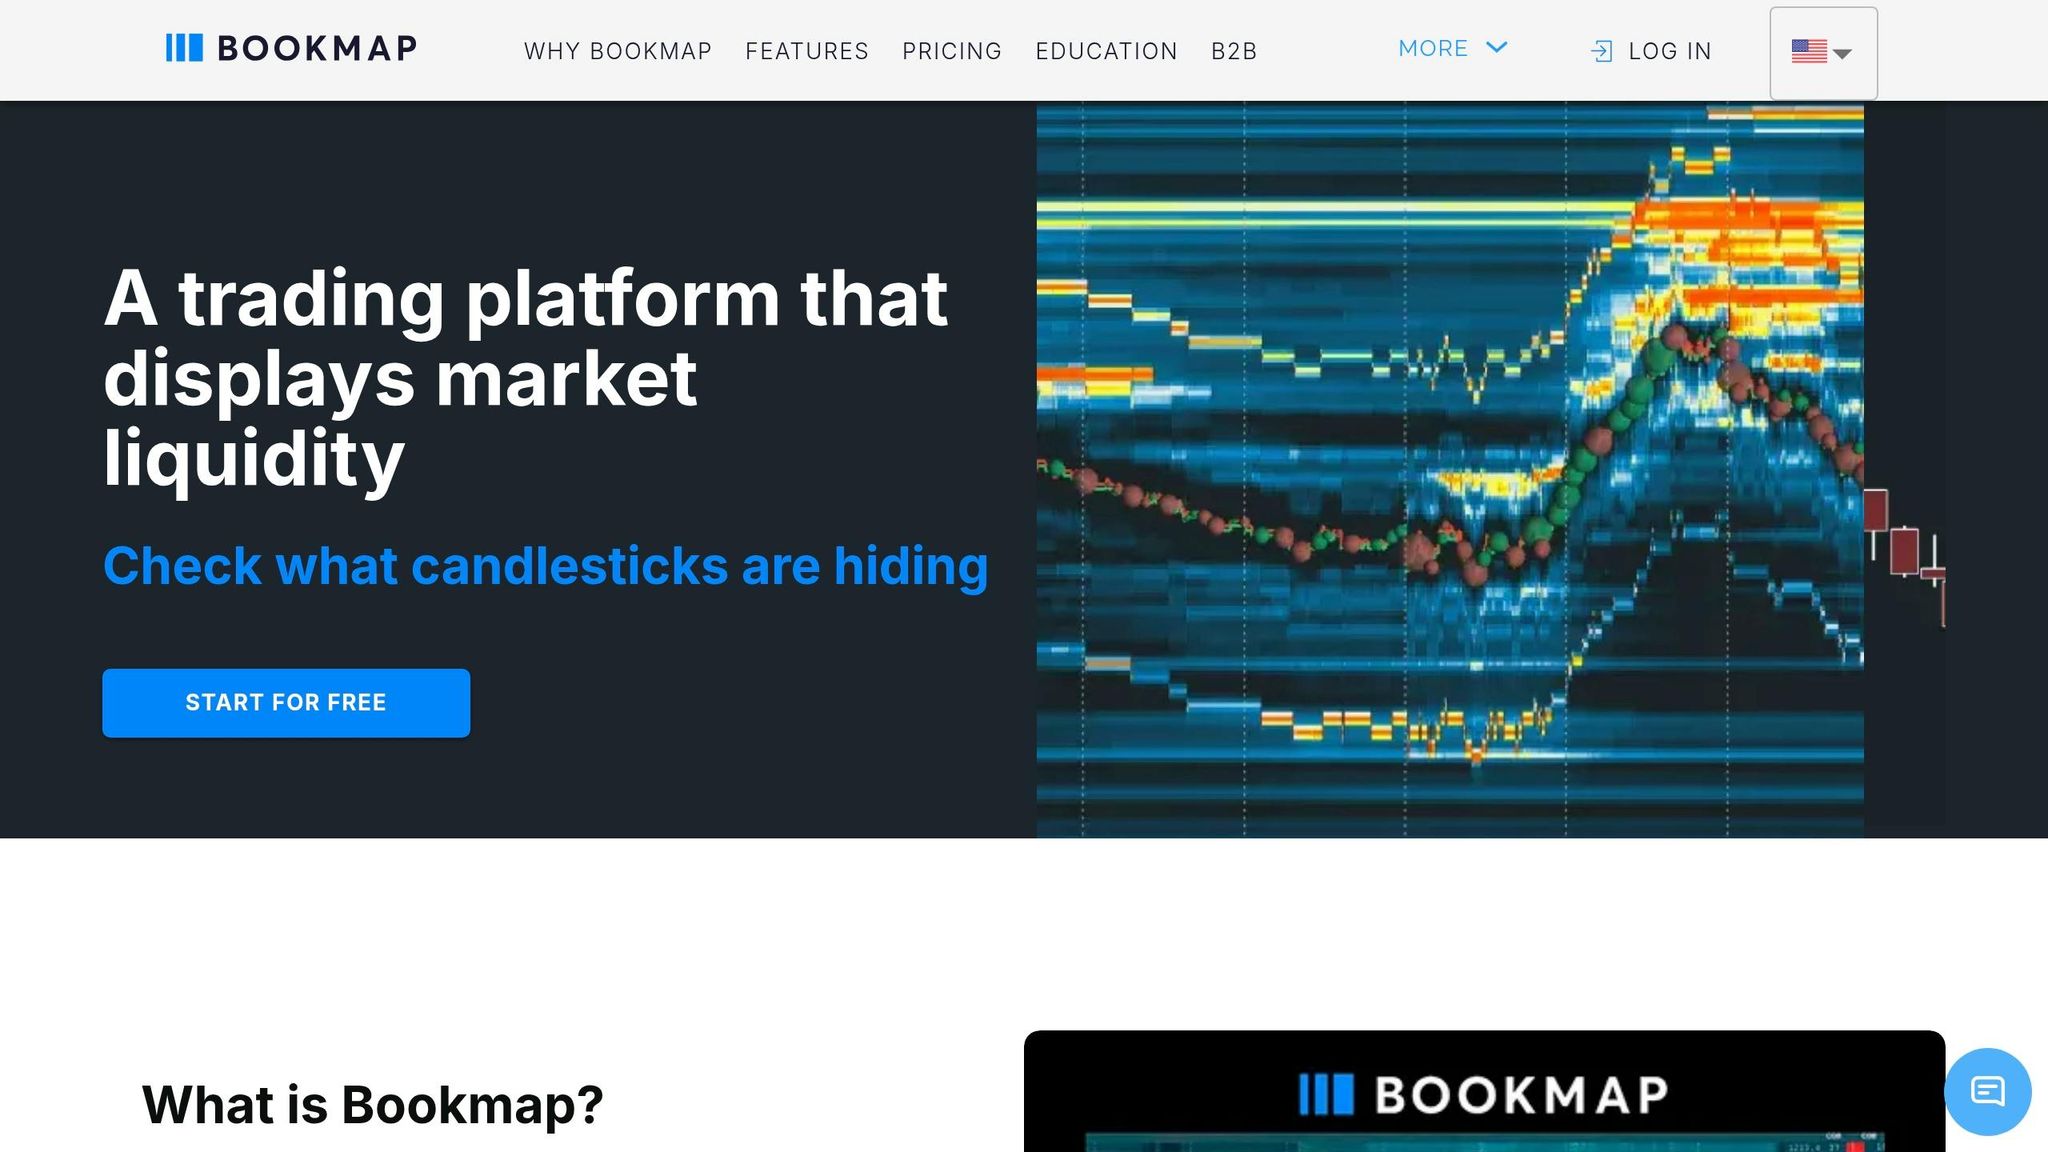
Heatmap tools show how resting liquidity changes over time. Footprints show what actually traded. The DOM shows the book right now. A heatmap fills in the gap: where size showed up, sat there, or got pulled before price even touched it. That’s why heatmaps are so useful when you’re trying to judge if liquidity is real, fake, or already backing off before you click in.
Execution Visibility
This is where heatmaps earn their keep. You can spot pulls, cancellations, and liquidity that disappears before price gets there. On a plain DOM, you might see a big bid flash on the screen and then vanish. If you blink, you miss it. On a heatmap, that cancel leaves a visible trail [2].
Bookmap shows the order book as a live heatmap, and Quantower’s DOM Surface adds iceberg-style order detection for large orders broken into smaller prints [2].
That matters because a level can look strong on the ladder, then turn out to be smoke. Heatmap playback gives you that extra bit of context the static DOM doesn’t.
Liquidity Context
Bright red and orange zones usually mean thicker resting liquidity. Darker zones mean thinner liquidity, where price can move faster. That’s the key difference from Volume Profile. Volume Profile tells you where volume traded. The heatmap tells you where resting orders are sitting, holding, or getting yanked [2].
If you trade fast moves, that distinction matters. A high-volume area and a thick wall in the book are not the same thing.
Timing Precision
Heatmaps help most when the whole trade comes down to whether a level is still there right before entry. A wall that starts thinning as price moves in is a warning sign. Odds are that liquidity gets pulled. A wall that keeps absorbing aggressive orders without shrinking looks more like support [2][3].
That’s the difference between leaning on a level with confidence and stepping into a trap.
Platform and Feed Fit
Feed quality matters more here than most traders think. Heatmap tools need tick-by-tick, full-market-depth data to rebuild order-book behavior with decent accuracy. Rithmic is often treated as the lower-latency option at about 1–2 ms, while CQG is known more for stability and broader platform support at around 3–5 ms [4].
Platform cost also moves around a lot:
- Bookmap: free Digital plan, Global at $49/month, Global+ at $99/month
- Quantower All-in-One: $70/month
- NinjaTrader Order Flow+: $60/month or included with a lifetime license [1][2][4]
A couple of platform notes matter too. NinjaTrader and ATAS are Windows-only. NinjaTrader also hits system resources harder than most platforms, so extra RAM and an SSD help when the market gets wild [3][4].
Chart-trading interfaces tie all of this together at the point of entry.
6. Chart-Trading Interfaces
After you read liquidity on the DOM, tape, and heatmap, chart trading is the execution layer.
A chart-trading interface lets you place, move, flatten, or reverse orders right on the chart. No separate ticket. No extra clicking.
Execution Visibility
Platforms like NinjaTrader and Quantower can show on-chart P&L, so you can see exactly what you’re up or down without bouncing between panels [8]. Bracket orders can place your stop and target the second you enter. That’s great for trade management. Not for reading the book.
Liquidity Context
A chart tells you where price is and where your orders are sitting. What it does not show well is resting liquidity like a DOM does. Quantower‘s DOM Surface adds heatmap-style liquidity context next to the chart, but that’s a separate layer, not the chart itself [1][2]. Read liquidity somewhere else first. Then use the chart to execute.
Timing Precision
For scalpers, chart trading is support. It’s not the main read.
The DOM and tape give you the tick-by-tick view of aggression that a chart just can’t match. If you’re taking fast scalps, the ladder and tape lead. The chart follows.
Platform and Feed Fit
Cloud-based chart trading adds routing latency compared with a direct desktop-to-feed setup [8]. TradingView is the clean example here. It’s good for charting and analysis. It’s not the tool I’d pick for latency-sensitive scalping.
Platform and Feed Setups That Make Sense for Futures Traders
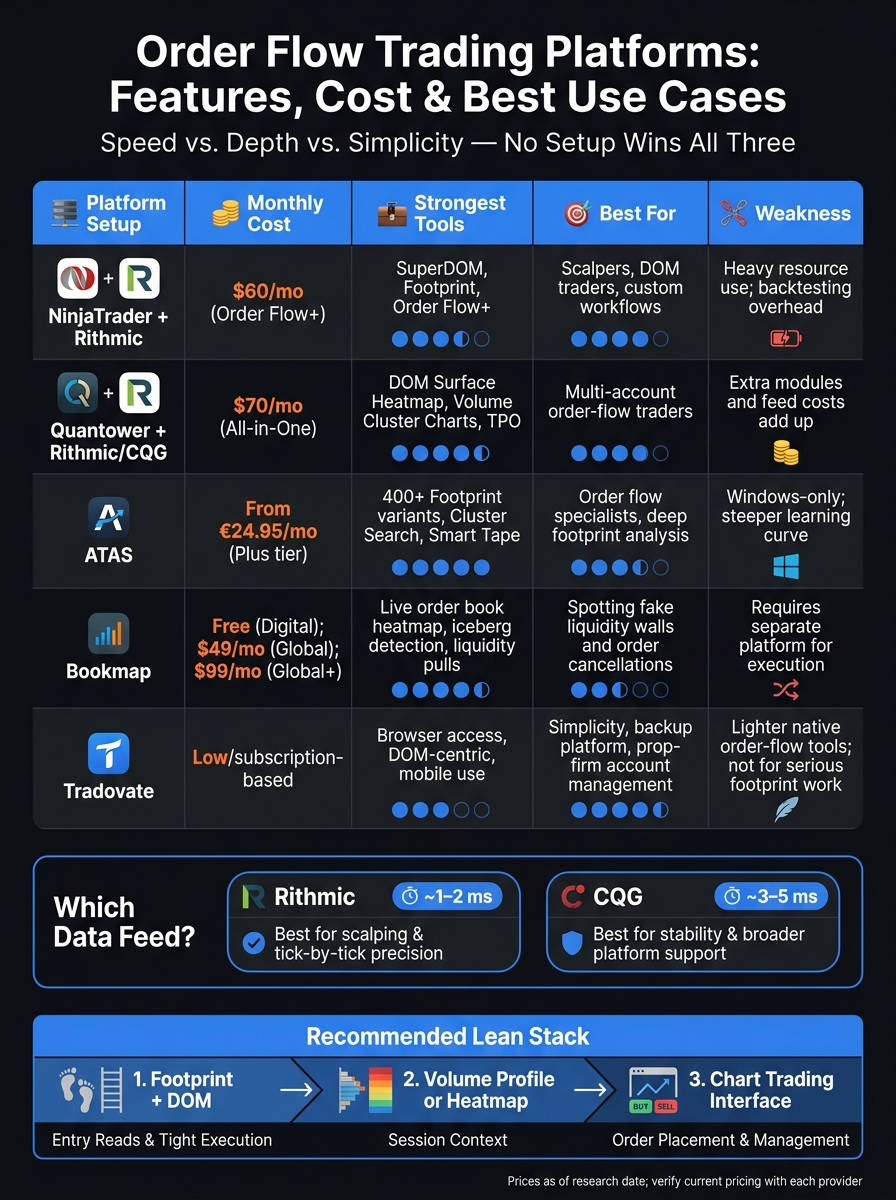
Order Flow Trading Platforms Compared: Features, Costs & Best Use Cases
Once you know which order-flow tools you need, the next step is picking a platform and feed that actually match the way you trade. For most futures traders, the choice comes down to speed, flexibility, or simplicity. You usually don’t get all three at once.
NinjaTrader + Rithmic is the default retail order-flow setup for scalpers and DOM traders.
Quantower + Rithmic or CQG fits traders who want deeper order-flow tools and the freedom to work across more than one broker.
Tradovate is the simple, execution-first pick, especially if you care about browser access and easy account handling. Its built-in order-flow tools are lighter than what you get in NinjaTrader or Quantower, so it’s better as a practical execution and backup platform than as a serious footprint or heatmap workspace [4][5].
TradingView via Tradovate is a charting layer. It’s not an order-flow-first setup.
MotiveWave + Rithmic is more chart-first than DOM-first. If advanced charting matters more to you than a heavy DOM workflow, it can make sense [4].
Here’s the quick side-by-side view:
| Setup | Strongest Coverage | Best Use Case | Where It Costs More Than It Adds |
|---|---|---|---|
| NinjaTrader + Rithmic | SuperDOM, footprint, Order Flow+ | Scalpers, DOM traders, custom workflows | Backtesting and scripting you won’t use |
| Quantower + Rithmic/CQG | Footprint, DOM Surface heatmap, Volume Profile vs Price Action, TPO | Multi-account order-flow traders | Extra modules and feeds |
| MotiveWave + Rithmic | Advanced charting with Rithmic connectivity | Chart-oriented futures traders | Advanced studies you don’t need |
| Tradovate | Browser access, mobile use, prop-firm management | Simplicity, backup use, account management | Missing depth you expected |
| TradingView + Tradovate | Charting, alerts, cross-device access | Discretionary chart traders | Charting tiers you don’t need for execution |
That tradeoff is the whole game. No setup wins on speed, depth, and convenience at the same time. The next section gets into where each tool pulls its weight, and where it doesn’t.
Pros and Cons of Each Order Flow Tool
Now that the core tools are clear, here’s the part that matters: which ones help, and which ones just eat screen space.
If you’ve already sorted out your platform and data feed, this is the next filter. You’re not picking the “best” tool in a vacuum. You’re picking based on what you need most in the moment: detail, speed, or context.
| Tool | Biggest Strength | Main Limitation | Best Use Case |
|---|---|---|---|
| Footprint Charts | Reads absorption and imbalance at the candle level | Hard to read fast | Identifying absorption and exhaustion at key levels |
| DOM / Price Ladder | Shows live resting liquidity for entry timing | Needs tick-accurate data; spoofing can clutter the view | Scalping and precise entry/exit timing |
| Time & Sales | Confirms aggression at key levels | The tape is unreadable without filters | Confirming large participation at key levels |
| Volume Profile | Maps value and key reference levels | Reflects past volume, not live intent | Defining session structure and locating targets |
| Heatmap / Liquidity Tools | Exposes liquidity walls and pulls | Often requires an extra subscription; mentally heavy in fast markets | Spotting liquidity walls, icebergs, and order pulling before price reacts |
| Chart-Trading Interfaces | Speeds execution and bracket management | Lacks microstructure detail for tight-stop scalping | Discretionary trend traders and multi-position traders |
A few of these tools do the heavy lifting. Others are support.
For tight-stop scalping, footprint charts and the DOM usually matter most. That’s where you get the closest read on absorption, imbalance, resting liquidity, and entry timing. If you’re trying to work a 4-tick to 8-tick idea, that microstructure view isn’t optional. It’s the whole game.
Volume Profile and heatmaps are more about context. They help you frame the session, mark value, and spot liquidity that may matter before price gets there. Useful stuff, no doubt. But they’re not the first thing you should stare at when you need to click in and manage risk fast.
Chart-trading interfaces sit in a different lane. They don’t tell you much about order flow by themselves. What they do is make execution cleaner. That matters if you’re managing brackets, scaling out, or handling more than one position. For pure tape reading, though, they’re support gear, not the signal.
Time & Sales is one of those tools traders either swear by or ignore. The truth is simpler. It can confirm aggression at a level, but raw tape gets messy fast. Without filters, it turns into noise. With filters, it becomes a check, not a full setup engine.
So if you’re trying to keep the layout lean, the stack is pretty simple:
- Use footprint + DOM for entry reads and tight execution
- Add Volume Profile or heatmap for session context
- Use chart trading to place and manage orders faster
That sets up the next step: matching the tool stack to the kind of trader you are.
Conclusion
Pick tools based on the job: execution, structure, or liquidity.
Each one handles a different part of the trade. For entry timing, use a DOM or price ladder. For market structure, use Volume Profile or TPO. For liquidity, use Bookmap-style heatmaps or Quantower’s DOM Surface.
After that, match the tool to the data feed that can handle it. For tight scalping and tick-by-tick precision, Rithmic is the better fit. If you want broader platform support, CQG is the better call. NinjaTrader and Quantower both give you low-cost ways to get started [4][1]. Start small. Add tools only when missed reads or slower execution are costing you.
FAQs
What order flow tool should I learn first?
For most traders, start with the DOM ladder. It’s the clearest way to watch live liquidity, price movement, and your execution in one place. If you’re trying to read order flow, this is the base layer. No fluff. Just what the market is doing right now.
Then move to footprint charts. They show volume traded at each price level inside a bar, so you can spot buyer and seller activity with a lot more detail than a plain candlestick gives you.
One thing that saves money: don’t pay for advanced features too early. First figure out the trading problem you’re trying to fix. Then buy the tool that fixes it. Not the other way around.
Do I need Rithmic, or is CQG enough?
It comes down to how you trade and how much order flow data is part of your edge.
CQG works fine for most discretionary traders. If you mostly trade off charts, want multi-platform flexibility, and don’t want a setup that turns into a headache, it’s the easier pick.
Rithmic makes more sense if you scalp from the DOM or lean hard on footprint charts, absorption, and order flow reads. You get lower-latency, tick-by-tick data, plus MBO support. For that style, those details matter.
Which tools actually matter for scalping?
For futures scalping, the tools that matter most are the ones that help you get in, get out, and see liquidity before the move is gone.
- DOM for fast entries and exits
- Footprint charts for bid-ask imbalances
- Liquidity heatmaps to spot resting orders and absorption
A low-latency feed like Rithmic helps too, because speed matters when you’re working tight stops and small targets.
Keep the setup clean. Keep it fast. If your screen is cluttered or your platform lags, you’re already behind. The whole point is to read order flow, react fast, and not fight your own tools.