I’d start at 1,000 ticks for NQ, ES, and MNQ, then change the count if the chart outruns your decisions or delays your setup. There’s no magic setting, and a smoother chart won’t fix bad entry rules.
Here’s how I’d narrow the choice: compare 500, 1,000, and 2,000 ticks for entry timing, false breaks, and execution pace. A 1,000-tick bar counts executed trades, not contracts or seconds. That matters at the 9:30 a.m. ET open, when bars can fly by.
<u>Test each contract separately on the same platform and feed.</u> You’ll learn which count fits your setups without mistaking fewer bars for better signals. On MNQ, include trading costs and consistency rules for scalping before calling a trade profitable.
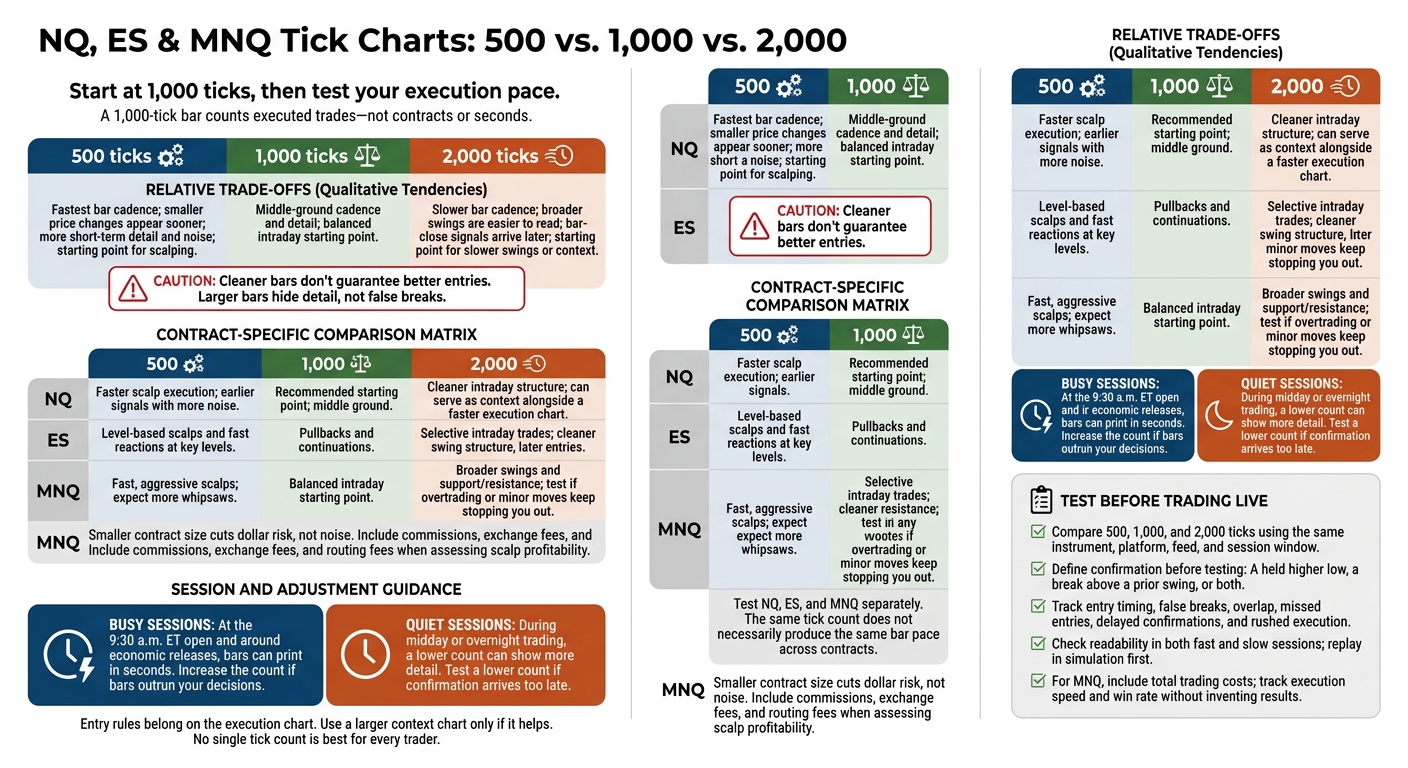
NQ, ES & MNQ Tick Charts: 500 vs. 1,000 vs. 2,000
1. NQ
Bar Speed
NQ moves fast, so your tick count directly affects execution pace. 500 ticks prints bars fastest, 1,000 slows the cadence, and 2,000 prints more slowly. Bars form faster in busy sessions and slower in quiet ones. For consistent comparisons, keep your broker and platform synchronized and use a low-latency data feed.[1] NQ makes the trade-off clear: earlier signals come with more noise.
Signal Clarity
A 500-tick chart shows smaller price changes sooner, along with more noise. 1,000 ticks gives you a middle ground to start from. 2,000 ticks groups more trades into each bar, making broader swings easier to read but delaying bar-close signals. Cleaner bars don’t guarantee better entries.
Trading-Style Fit
Start with 1,000 ticks. Use 500 for faster scalp execution and 2,000 for cleaner intraday structure. You can also use 2,000 ticks for context while placing trades from a faster chart.
If 500-tick bars push you to rush orders or break entry rules, increase the count. Don’t force yourself to trade faster. Judge the setting by whether you can spot your setup and execute your plan cleanly under pressure at NQ’s pace.[1]
sbb-itb-46ae61d
2. ES
Bar Speed
Read ES on its own terms. The same tick count won’t necessarily print bars at the same pace as NQ. Judge a 1,000-tick ES chart by how it behaves during your session, not by what you see on NQ.
Signal Clarity
Use 500 ticks for fast reactions at key levels and 1,000 ticks for pullbacks and continuations:
Watch for a retest of the broken level or a break of the prior swing.
At 2,000 ticks, swing structure is cleaner, but entries come later. These three settings serve different jobs. There’s no single best count.
Trading-Style Fit
Start with 500 ticks for level-based scalps, 1,000 for pullbacks and continuations, or 2,000 for selective intraday trades. Increase the count when busy ES sessions make bars noisy. Lower it when quieter sessions leave your signals arriving too late.
3. MNQ
MNQ uses the same tick-chart logic as NQ and ES, but bars can form at a different pace. Test MNQ separately.
Bar Cadence
The same tick count won’t always produce bars at the same pace on MNQ. Its smaller contract size cuts dollar risk, not noise.
Signal Clarity
500 ticks works for fast, aggressive scalps, but expect more whipsaws. 1,000 ticks gives you a balanced intraday starting point. 2,000 ticks filters more noise when you’re tracking broader swings and support/resistance.
Faster settings give you earlier signals. Slower settings make the chart easier to read. Pick the pace that fits scalping or reading intraday structure.
Trading-Style Fit
Start with 1,000 ticks, then test 500 for faster scalps. Try 2,000 if you’re overtrading or minor price moves keep stopping you out. Use the chart you can act on consistently.
A readable MNQ chart helps you skip marginal setups where trading costs can wipe out the profit. Paper trade first and track execution speed and win rate. If you scalp MNQ frequently, compare commissions, exchange fees, and routing costs. Those charges can eat a larger share of small profits [1].
Bar Speed in Busy and Quiet Sessions
Session pace changes how tick settings behave, so test them under the same conditions. The chart needs to stay readable as volume speeds up or slows down.
At the 9:30 a.m. ET open and around economic releases, bars can print in seconds [1]. During quieter midday or overnight sessions, a lower tick count can show more detail. If bars fly by during busy periods, increase the count for cleaner structure.
Test 500, 1,000, and 2,000 ticks using the same instrument, platform, feed, and session window. Test MNQ separately because its trade flow doesn’t always match NQ [1]. Judge each setting by how easily you can read the chart at your trading pace, not by bar count alone.
Signal Clarity: Early Entries vs. Clearer Swings
After you pick a starting tick count, decide whether you want earlier signals or cleaner swings.
Faster signals give you more chances to act, not better entries. Smaller tick bars show more short-term movement. Larger bars compress that detail and delay confirmation at bar close. They hide detail, not false breaks.
The trade-off is between a chart you can read fast and one with cleaner swings. Choose a setting that matches how fast you can read, confirm, and act.
Before testing, define what counts as confirmation:
A held higher low, a break above a prior swing, or both.
If price loses a previously broken level during the pullback, that’s the first sign continuation may be failing [3][2]. In replay, compare false triggers, how far price moved before failure, and whether the setup pushed you into rushed execution. Use those results to pick a tick count that fits your scalping or intraday pace.
Choosing Tick Settings for Your Trading Style
Once you’ve weighed earlier entries against clearer swings, match the tick count to how fast you execute. Start with your execution pace, not your favorite setting.
Use these counts as starting points. Test NQ, ES, and MNQ separately.
| Trading style | Starting count | What to check |
|---|---|---|
| Scalping | 500 ticks | Can you spot the setup and place the order without rushing? |
| Intraday | 1,000 ticks | Can you read pullbacks before confirmation arrives too late? |
| Slower swings | 2,000 ticks | Are the bigger swings clear enough to trade? |
Keep your execution chart and context chart in separate roles. Add a larger context chart only if it makes the session easier to read. Entry rules belong on the execution chart. Use context to judge continuation or exhaustion. [1][2]
Replay checklist: Use the same session windows for each setting. Check entry timing, false breaks, overlap, missed entries, and delayed confirmations. Heavy overlap usually points to congestion. If bars print faster than you can make a decision, increase the count. If valid entries show up before confirmation, test a lower count. Check readability in both fast and slow sessions.
Replay each setting in simulation before trading live. For MNQ, include commissions, exchange fees, and routing fees when comparing total costs. [1]
FAQs
How are tick charts different from volume charts?
Tick charts form a bar after a set number of trades, no matter how large those trades are. Volume charts form a bar after a set number of contracts or shares change hands. One large trade can complete a volume bar, but on a tick chart, it still counts as just one trade toward the bar’s threshold.
Can I change tick settings during a session?
You can change your tick chart settings anytime during a trading session to match your preferences and market conditions. Use a lower tick count for faster signals or a higher count for clearer price swings.
How do I know my tick setting needs adjusting?
Adjust your tick count when the chart gets hard to read or signals don’t match your execution pace. Increase it if noise makes swings or trends hard to spot. Decrease it if signals arrive too slowly.
Aim for a setting that keeps market structure clear and gives you time to act without feeling overwhelmed.